During whole-plant growth in a stable environment, roots and shoots maintain a dynamic balance such that
\[y=bx^k \tag{6.17}\]
Where y is root biomass and x is shoot biomass. More generally, x and y can be any two parts of the same organism that are growing differentially with respect to each other, but root–shoot relations are the most common candidate in such analyses of plant growth.
The allometric equation \(y=bx^k\) (Equation 6.17) was formalised by Huxley (1924) and can be ln transformed to become
\[\text{ln } y= \text{ln }b + k\text{ln }x \tag{6.18}\]
This formulation enables a straight-line plot of ln y as a function of ln x with slope k (i.e. the allometric coefficient) and intercept ln b. This empirical model does not explain the nature of growth controls between roots and shoots but does offer a simple description which is not confounded by plant size. Moreover, any departure from a particular root : shoot relationship is immediately obvious, and sources of variation in root : shoot ratio can be resolved into starting conditions (differences in intercept, ln b) versus biomass partitioning during growth (differences in slope, k).
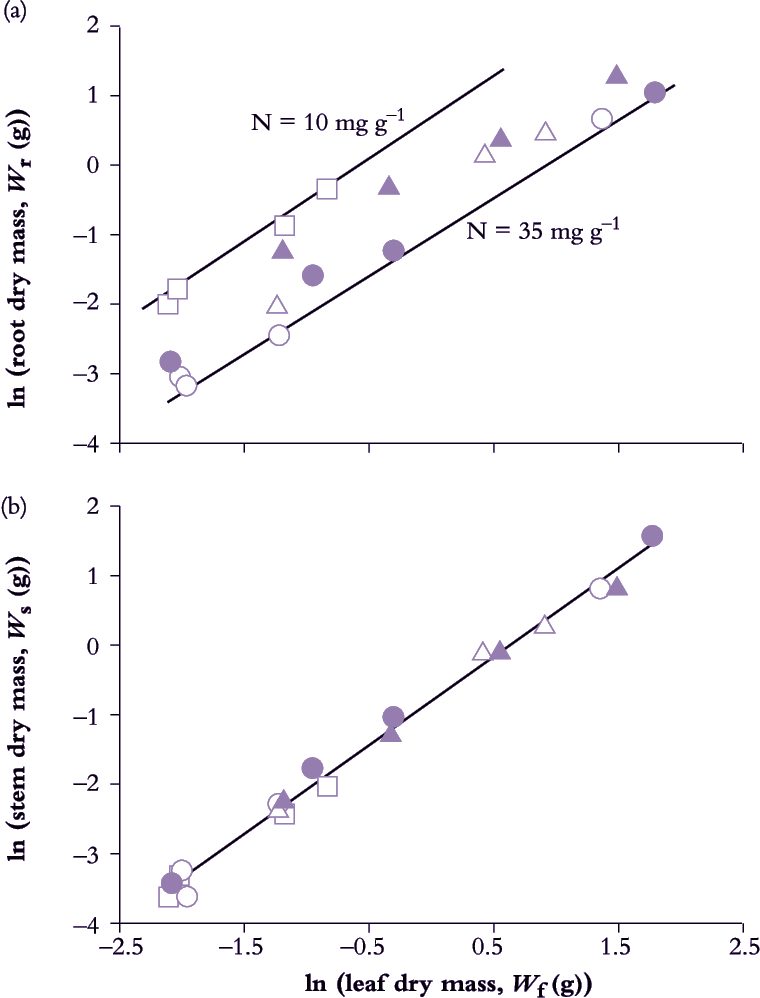
Leaf, stem and root growth under controlled conditions in Eucalyptus grandis seedlings demonstrate such application (Figure 6.11). Nitrogen input in nutrient spray chambers was used as a driving variable for growth where five relative addition rates generated a wide range in whole-plant RGR (from 0.039 d–1 0n lowest to 0.111 d–1 on highest rate).
Data from all treatments and harvests were pooled to reveal a strict allometric relationship between root and leaf growth (Figure 6.11) with a nitrogen effect on intercept but not slope. Nitrogen nutrition had influenced biomass allocation to the extent that low addition rate had initially promoted root growth relative to leaves (hence higher intercept), but subsequent to this early adjustment, and once growth had stabilised, biomass allocation to roots and leaves maintained a constant relationship irrespective of addition rate. In this case k = 0.982, indicating a net bias towards leaf growth over root growth — a ‘net bias’ because carbon loss via excretion, root renewal and respiration was not measured so that more photoassimilate would have been allocated to roots than was fixed in biomass.
Stem and leaf biomass also maintained a strict allometric relationship (Figure 6.11) where k = 1.261. A value for k greater than unity implies a consistent bias towards stem growth relative to canopy growth, as would be expected in a eucalypt with a high rate of stem growth (and favoured in plantation forestry). Significantly, nitrogen treatment was without effect on either intercept or slope (Figure 6.11) and emphasises the highly conserved relationship between leaves and stem in these seedlings.
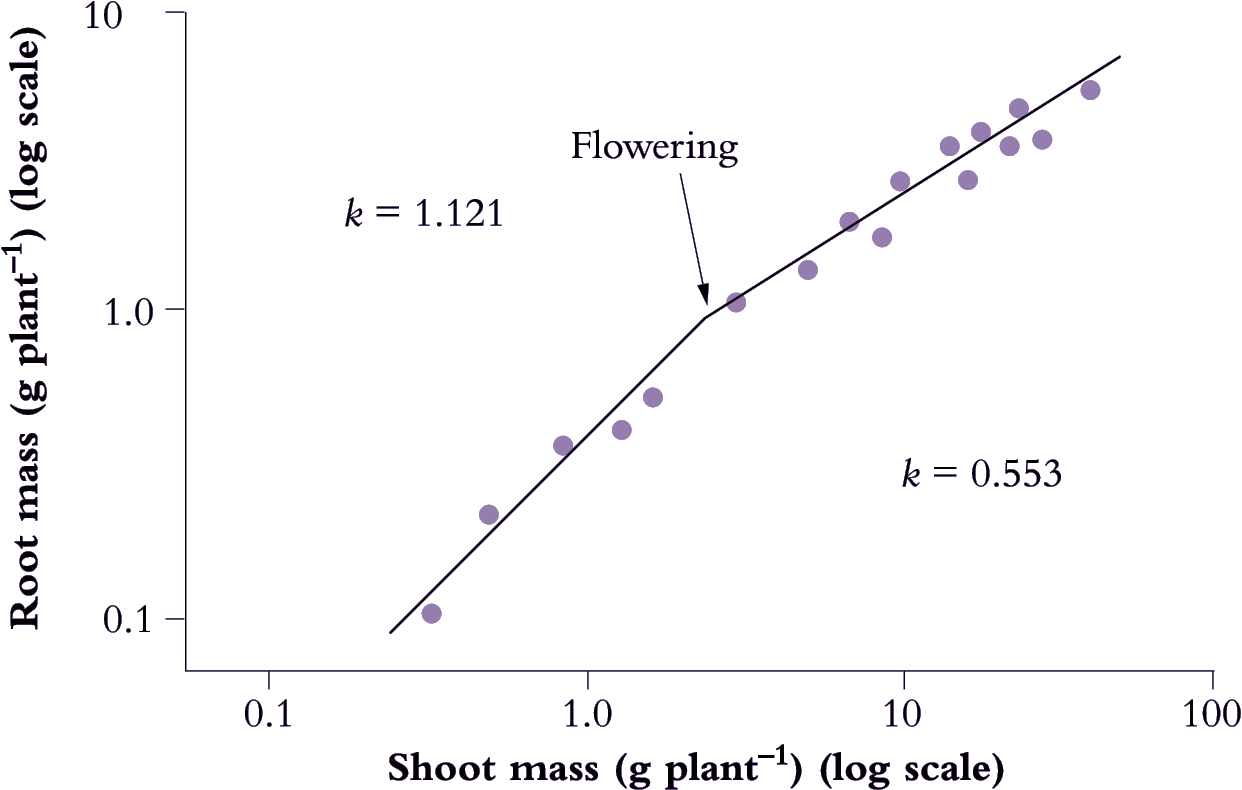
Developmental events also influence allometry and Italian ryegrass (Lolium multiflorum) provides a nice example (Figure 6.12) where a log–log plot of root mass as a function of shoot mass showed an abrupt change in slope when flowering occurred. In that case, k decreased from 1.121 to 0.553, and although shoot dry mass was about 10 times root biomass, a change in allometry was clearly evident.