6.4 - Reproductive development

Fig6.13.png

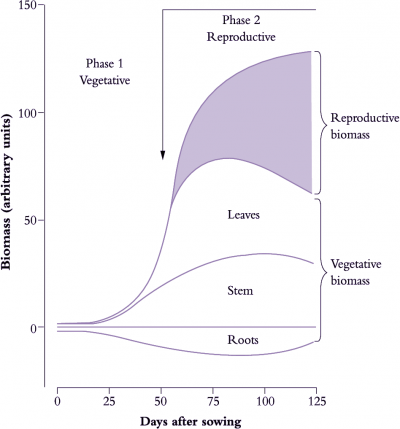
Figure 6.13. A notional distribution of biomass during the vegetative growth and reproductive development in an idealised annual plant such as a cereal or grain legume over c. 125 d. Whole-plant biomass follows a sigmoidal pattern with a near-exponential increase during vegetative growth and an asymptotic increase during subsequent maturation. Reproductive structures have by then become dominants sinks for photoassimilate, drawing 90-95% of their carbon from current photosynthesis but also mobilising stored assimilate from leaves, stems and roots, which lose biomass during that process (Original drawing P.E. Kriedemann; based on various sources)

Annual plants show a sigmoidal increase in total biomass during each life cycle (Figure 6.13) where a near-exponential vegetative phase (Phase 1) gives way to a reproductive phase (Phase 2) starting with flower initiation. In effect, Phase 1 sets a potential for reproductive yield whereas events during Phase 2 determine realisation of that potential because nearly all of the photoassimilate stored in reproductive structures (90–95% in cereal grains, for example) comes from carbon fixed subsequent to initiation. Reproductive organs then become dominant sinks for current photoassimilate as well as carbon-based resources previously stored in leaves and stems.

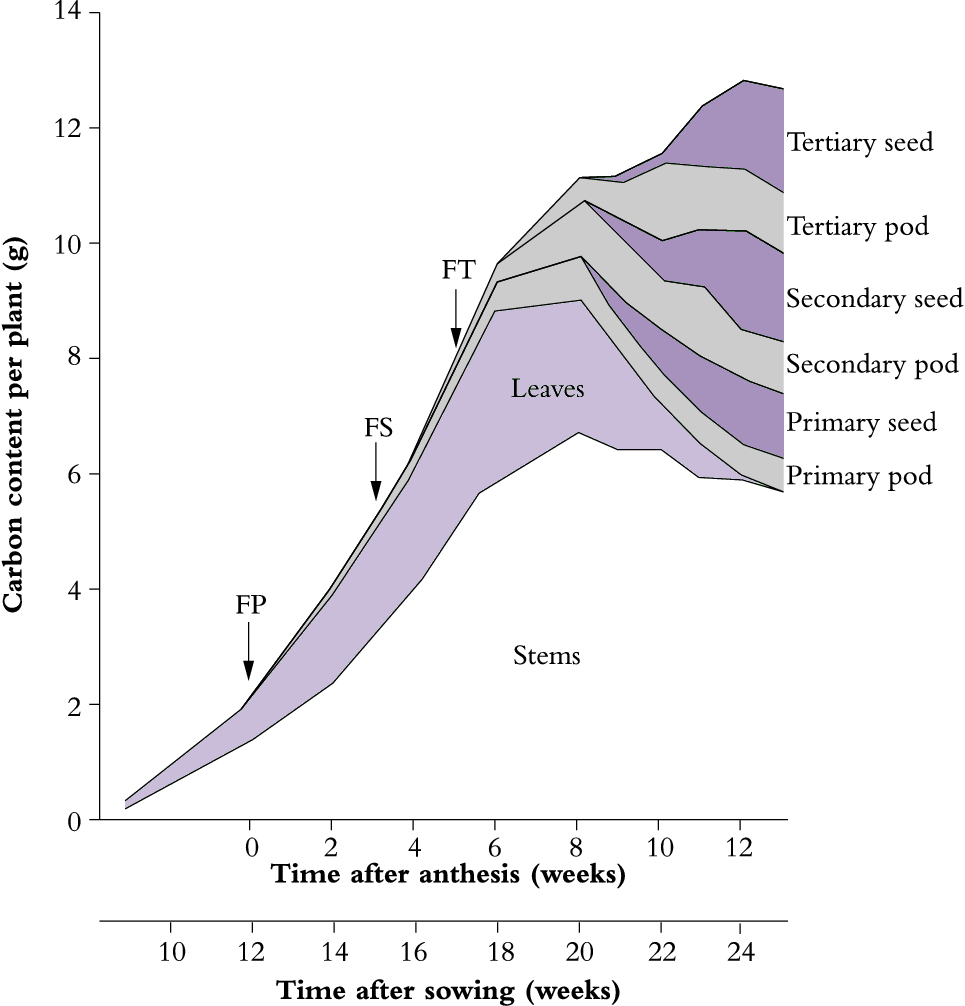
The carbon content of shoot components changes dramatically following onset of reproductive development. As shown for lupin in Figure 6.14, the dynamic balance between leaves and stem that had been previously maintained during vegetative growth is now replaced by an accelerated senescence of leaves and loss of non-structural carbohydrates from leaves plus stems to provide assimilates for the developing pods. At full maturity, reproductive structures in lupin account for about 50% of above-ground biomass, with seeds accounting for about two-thirds of that investment (Figure 6.14). In most grain or seed crops, the mature reproductive structure accounts for 50% of the above-ground biomass (Table 6.4).

Fig6.14_edit.png

Figure 6.14. An unirrigated crop of lupin (Lupinus angustifolius cv. Unicrop) shows major redistribution of plant carbon from vegetative to reproductive structures during grain filling. This cultivar is indeterminate with successive cycles of reproductive development. FP, FS and FT indicate commencement of flowering on primary, secondary and tertiary shoots respectively. Seed carbon increased exponentially over the period 8-12 weeks after anthesis coinciding with leaf loss and some reduction in stem carbon. Nearby irrigated lupins retained leaves much longer. Based on Pate et al. (1980) Aust J Plant Physiol 7, 283-297

In wheat, also, assimilates are redistributed from stems to grains, more so when photosynthesis is limited (Rawson and Evans 1971). Remobilisation of stem reserves into grain is particularly important in a terminal drought. In wheat, stem reserves might contribute a high proportion to grain weight, and account for 80% of the carbon source rather than 10% as in well-watered conditions. But because grains are much smaller after drought, the absolute amount of carbon transported from the stem may be similar to that moved in good conditions. Percentages can be misleading.

In nature, a combination of ecological factors and life cycle options has led to wide variation in reproductive effort by vascular plants so that dry matter invested in reproductive structures relative to vegetative biomass will vary accordingly. For example, late successional rainforest species which combine shade adaptation with longevity are characterised by large propagules where massive seed reserves buffer young seedlings against shortfalls in carbon supply due to deep shade or dry spells. By contrast, early successional (pioneer) species on disturbed sites benefit by producing a large number of widely disseminated seeds. Their reproductive effort is best invested in number rather than size, and carries an added advantage that at least some viable seed will be produced even under stressful conditions. Weedy barleygrass is a case in point where Chapin et al. (1989) report that these species produce 4.5-fold more grains, but they are only one-sixth the size of cultivated barley. Ripening patterns also differed where grains matured synchronously in cultivated barley, but matured and dehisced progressively from tip to base in ears of barleygrass.


6.4.1 - Harvest index

The term “harvest index” is used in agriculture to quantify the yield of a crop species versus the total amount of biomass that has been produced. The commercial yield can be grain, tuber or fruit. Harvest index can apply equally well to the ratio of yield to total plant biomass (shoots plus roots) but above-ground biomass is more common because root mass is so difficult to obtain.

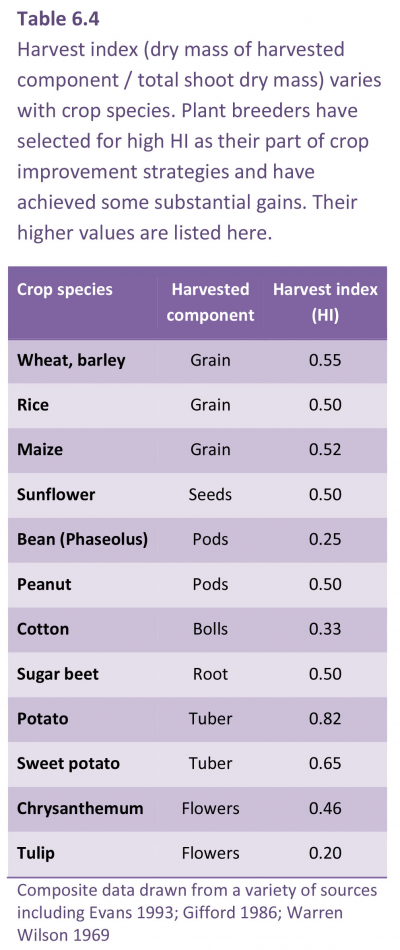
The harvest index of the lupin plants shown in Figure 6.14 was about 0.33. Potential values for the harvest index of various crop and horticultural species are shown in Table 6.4.

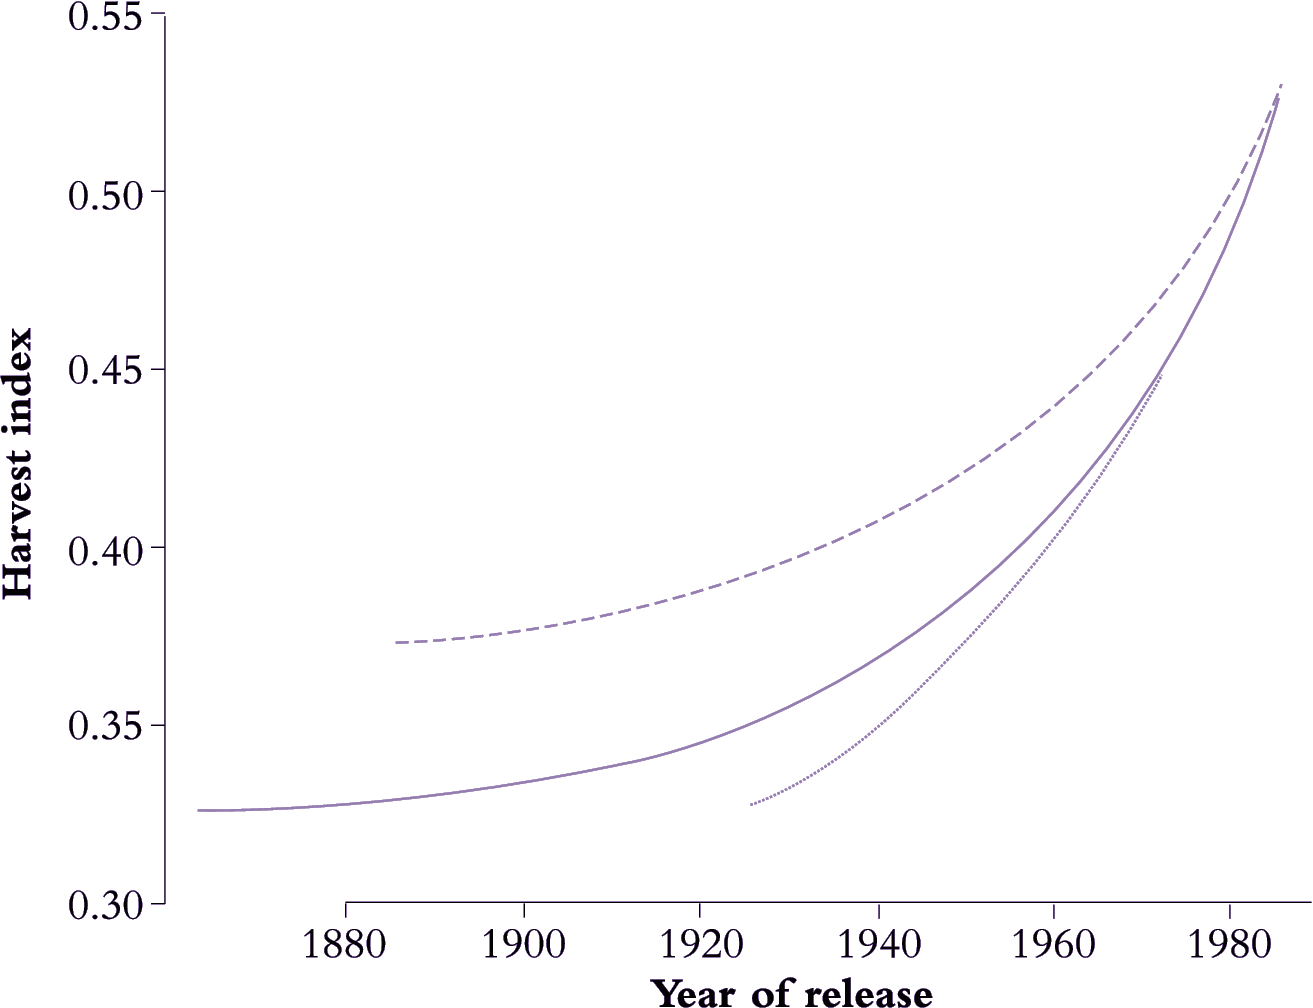
Domesticated plants have been subjected to sustained selection pressures on reproductive development by humans (Table 6.4) and now reflect wide variation from tuber-forming species such as potato, where over 80% of plant biomass is harvested as storage organs, to high-value flower crops such as tulip where blooms might represent only 20% of the final biomass of whole plants. Mid-range are legumes, cereals and other grain crops where human selection for yield has led to a notable increase in HI. Wheat, for example (Figure 6.15), increased from between 0.30 and 0.35 to almost 0.55 over a century, while barley and rice have shown similar trends.

Fig6.15.png

Figure 6.15. A century of breeding and selection has produced some solid gains in harvest index (HI) (ratio of grain to whole shoot biomass) for crop species including barley (dashed line), wheat (solid line) and rice (dotted line) as shown here. Introduction of dwarfing genes to reduce lodging under high-nutrient cultivation was a major factor in this achievement. Cereal architecture necessitates some trade off between stout stems to support heavy ears and a retention of leaf area to generate photoassimilate. HI will eventually reach a ceiling set by those constraints. Based on Evans (1993)

Yield improvement in cereals, cotton, peanuts and soybean which is similarly due to substantial increase in HI, emphasising (Gifford et al. 1984) that partitioning of photoassimilate rather than generation of whole-plant biomass was responsible for such yield improvement.

6.4.2 - Yield components

Yield of a cereal crop such as wheat or rice depends on the numbers of seeds that mature on a plant, and their size. Carbon partitioning during vegetative development and before flowering influences the number of flowers that are formed on a plant, as the reproductive sink competes with growing tissue in leaves, stems and roots for carbon supply. Carbon partitioning after flowering influences the rate of seed growth and the final size of the seed.

Major sources of variation in yield can be identified via a simple yield component model. Taking cereals as an example, final grain yield (g m–2) is a product of grains per square metre and mass per grain.

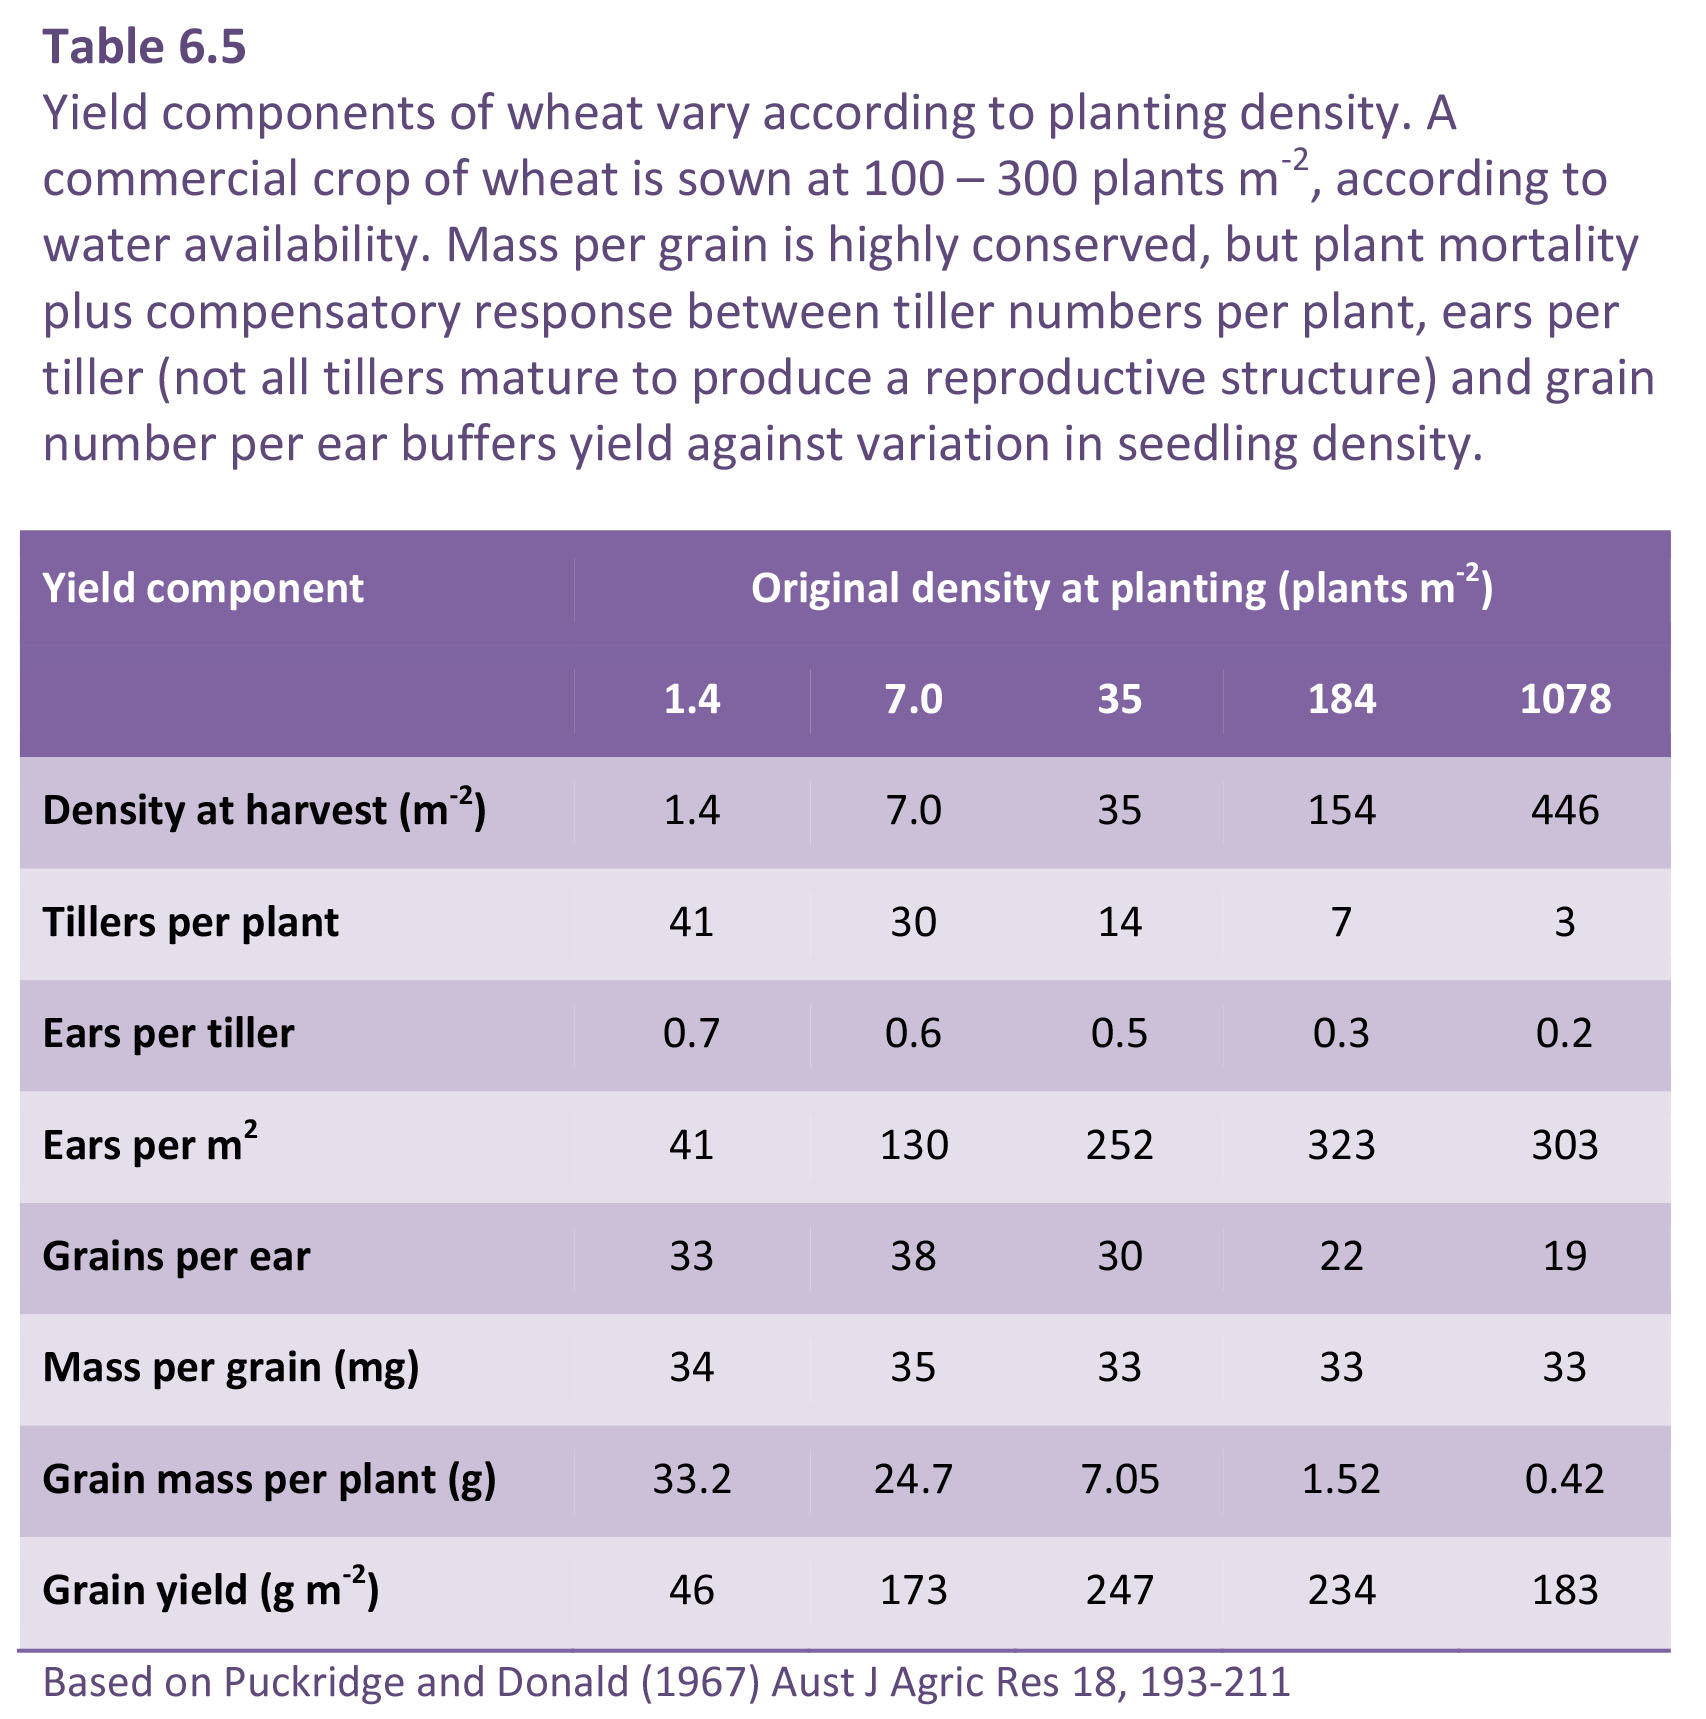
Planting density and fertilizer can further influence yield components, as shown in the example in Table 6.5. In cereals, lateral shoots are called “tillers”, and the mature inflorescence that forms on a mature tiller an “ear”. Ears m–2 is in turn an outcome of planting density (plants m–2), tillers per plant and ears per tiller. Not all tillers produce an ear, especially if the density is high and the plants then limited by light as well as possibly by fertilizer or water.

Some yield components such as mass per grain are especially stable, others such as ears m–2 and grains per ear vary widely with seasonal conditions or according to original planting density (Table 6.5). In that case (Insignia wheat at Glen Osmond, South Australia), mass per grain was highly conserved (33–35 mg) whereas tillers per plant varied from 41 at lowest planting density to only three at highest density. Significantly, yield variation was buffered by compensatory responses in yield components. For example, effects of low planting density were offset by production of more tillers per plant and more ears per tiller. Grains per ear then determine potential yield so that growing conditions would have become crucial for realising such potential via grain retention and filling

Genotype × environment interactions lead to huge variation in cereal grain yield and have been exploited for yield improvement. Universally, high grain number per square metre is a prerequisite for high yield and can be achieved via more ears per square metre and/or more grains per ear. In wheat and barley, grain number per ear has been primarily responsible for gains in yield; ears m–2 and mass per grain have not shown consistent increase (see Evans 1993 and literature cited).

For a commercial crop, mass per grain is the most important single component, and determines its use. The size (and sometimes shape) of the harvested product determines the value of the crop to the grower. A small or “pinched” wheat grain is of little value as it cannot be milled for flour and is fed to animals.
6.4.3 - Increasing harvest index

Fig6.16_edit.png

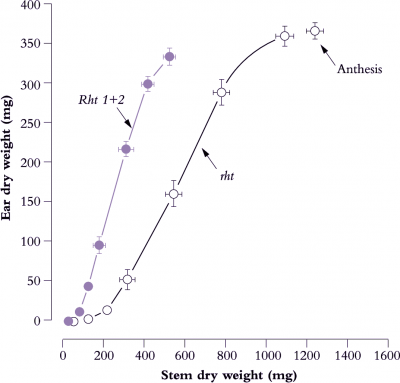
Figure 6.16. Early growth of reproductive tissues relative to stem mass in dwarf genotypes foreshadows faster ear development and higher HI. The tall and productive Mexican spring wheat (Yaqui 50, designated rht) eventually produces heavier ears, but returns a lower HI at maturity. Introduction of two major dwarfing genes (Rht 1 + Rht 2) resulted in shorter stems. Consequently developing ears were subject to less competition for photoassimilate during early differentiation and for grain filling subsequent to anthesis. Bars represent standard errors. Based on Bush and Evans (1988) Field Crops Res 18, 243-270

A major impetus to improve HI in cereals came from the introduction of dwarfing genes. In primitive wheats, and tall plants generally, reproductive structures have to compete with rapidly extending stems for photoassimilate, but dwarf cultivars alleviate such competition and enable a shift in carbon partitioning to ears. Early growth of ears and stems in two lines of a Mexican spring wheat (Figure 6.16) illustrate this principle. A steeper slope in the dwarf line (designated Rht 1+2) compared with the tall line (rht) implies greater allocation of photoassimilate to ear growth relative to stem growth. The two dominant dwarfing genes (Rht 1 plus Rht 2) which are insensitive to gibberellic acid result in short stems and enhanced yield. Such genotypes formed the basis of the Green Revolution.

Tall wheat commonly “lodges” (falls over) in nitrogen-rich conditions, and dwarf wheats were originally developed to overcome this problem. Crop physiologists and breeders subsequently recognised the yield advantage from improved partitioning of photoassimilate. Continuing selection for yield within the semidwarf background, which became common after the 1970s in both spring and winter wheats, has seen further yield progress with little change in plant height. Yield has improved further in spring wheats (Sayre et al 1997; Sadras and Lawson 2011) and in winter wheats (Shearman et al 2005) but yield progress in more recent varieties is associated with notable increases in total biomass. This has occurred in both spring wheats (Sadras and Lawson 2011) and winter wheats (Shearman et al 2005; Zheng et al 2011). Also whereas past yield progress in wheat has always been associated with more grains m-2 and unchanged or smaller grains, yield gain in recent varieties in some cases has been linked to heavier grains (e.g. Zheng et al 2011). The switch from higher harvest index to greater biomass may reflect limits to harvest index, now around 0.5 for the best varieties about 80-100 cm in stature, while the appearance of newer varieties with heavier grains may reflect pressure from grain processors. Either way the changes point to the power of empirical selection.

Some room still exists for further improvement in shoot HI compared with 1980s values (Figure 6.15) but there is a corollary. If shoot biomass remains unchanged, further improvement in HI implies further reduction in leaf and stem mass. Considering leaves, specific leaf area (area:mass ratio or SLA) will have a finite limit for structural reasons so that the area of CO2-assimilating tissue servicing those enlarged sinks must also reduce as mass is reduced. Net assimilation per unit area (NAR) will therefore need to increase even further if potentially higher yields are to be realised. This could be achieved by either increases in photosynthetic potential or in more efficiency use of the energy produced.

The following section deals with respiratory efficiency and plant growth.