Chapter 14 - Temperature and acclimation

Chapter editor: Rana Munns                         

Contributing Authors:  John Angus, Owen Atkin, David Brummell, Aidan Farrell, Peter Gorsuch, EW Hewett,Vaughn Hurry, Howard Rawson

1CSIRO Plant Industry, 2Australian National University, 3Plant and Food Research NZ, 4University of the West Indies, Trinidad, 5Massey University NZ, 6Umeâ University, Sweden

This chapter is updated from a previous version by PE Kriedemann, SE Hetherington, IF Wardlaw and EW Hewett for Plants in Action 1st Edition

Fig14.0.jpg

Fighting ice with ice! Alleviating frost damage in a New Zealand orchard with overhead sprinklers. Plant tissues encased in ice that is continuing to form will remain at 0°C, that is, just above the threshold for injury (Photograph courtesy E. W. Hewett)

Life on earth is restricted to a narrow thermal band (Figure 14.1). Within that range, global conditions can still be extreme with air temperatures as low as –70°C in Antarctica and as high as +57°C in North Africa. Remarkably, life can endure those circumstances, and worse. Thermophilic bacteria exist in hot volcanic springs at +94°C and seeds, lichens and mosses may survive down to –260°C as forms of latent life. However, the temperature range for active growth in higher plants is much more modest and generally constrained between about 5°C and 45°C. The minimum temperature for active growth in tropical and subtropical plants that are chilling sensitive is from 10°C to 15°C (Section 14.4).

Fig14.1.png

Figure 14.1. Plant growth within the earth's biosphere is limited to a narrow range of temperatures compared with the overall cosmic span from absolute zero, where molecular motion ceases, to 10 000 K where atoms are ionised. Taking the life zone as spanning -5 °C to 45 °C vascular plants show remarkable thermal resilience within this range which enables them to colonise a great diversity of habitats. (Values generalised from various sources)

On a global scale (Figure 14.2) vegetation types have broad mean annual temperature ranges, from the arctic and alpine tundra at the low end of the temperature scale to tropical forests at the high end. Within this classification Australia and New Zealand cover a wide range of temperature conditions with mean annual temperatures varying from 4°C in the alpine areas of Australia and New Zealand to 28°C along the tropical northern coast of Western Australia.

Fig14.2.png


Figure 14.2. Mean annual temperatures in Australia and New Zealand range from 28°C in the north (tropical forest zone) to 4°C at higher elevations in the south (arctic and alpine tundra zone). Temperature extremes are an important factor in regulating survival and growth of many species, with periods of heat stress (>45°C) and freezing temperatures (<-2°C) common to some areas. Active growth of higher plants is normally limited to temperatures ranging from 0°C to 40°C, but many subtropical species will be chill damaged by temperatures lower than 10—15°C and many temperate species will not survive long periods of temperatures higher than 30°C. (Generalised from various sources)

14.1 - Thermal environment and plant heat budgets

Temperatures vary with latitude, altitude, size of land mass (and position within that land mass), atmospheric conditions (cloud cover and air movement) and local topography. Atmospheric temperatures decrease by about 1°C for each 2° increase in latitude, or for each 100 m increase in altitude. Temperatures in high altitudes near the equator can be similar to low-land temperatures further from the equator. The potato, which has its origin in tropical high altitudes, is now grown widely in low-altitude regions of the world where temperature conditions are similar. However, temperature is not the only concern in this expansion of a crop plant to new growing regions, as a change in latitude and altitude may require some adaptation to changing photoperiod and radiation levels.

Seasonal variation in temperature is greatest near the poles, and small near the equator. At high altitudes the increased solar radiation which can result in rapid local heating is balanced by greater night radiation losses. The most stable temperatures occur under oceanic conditions in the tropics.

Survival outside the active growth range of all plants is nevertheless dependent on developmental stage, duration of temperature stress and degree of acclimation. Terrestrial plants have evolved life cycles that match seasonal necessity, which at low temperatures necessitates winter dormancy. Within the dynamic range of plant–temperature relations, where short-term responses are readily reversible, phenology and productivity have been successfully linked with various measures of accumulated heat (thermal time), and predictive models validated.

14.1.1 - Temperature means and extremes

Fig14.3.png

Figure 14.3. Wheat-growing areas of Australia have been classified according to the temperature conditions normally prevailing during crop growing seasons (Nix 1975).Temperature increase following heading is common in all regions and plants frequently suffer periods of heat and drought stress during grain filling. Avoiding these late stresses by earlier planting can be difficult, particularly in those regions subject to spring frosts which may damage the developing florets of the inflorescence (ear) (Based on H A Nix (1975) plus other unpublished sources)

Average monthly temperatures are more relevant to plant growth than mean annual values.  Timing cardinal stages in plant development (phenology) can often be predicted from temperature measurements taken during the growing season. This integration of time and temperature is expressed in terms of degree-days (see later comments). However, when considering the effect of temperature on yield it is necessary to take extreme conditions into account, particularly at sensitive stages of growth.

Although unseasonally warm growing conditions late in winter are not necessarily harmful to fruit trees, this will often result in early bud break and flower development, increasing the possibility that these more sensitive stages of development will be damaged by a late frost.

For annual crops some degree of adjustment is possible to avoid a particular environmental stress by varying the cultivar or time of planting. However, even this increased flexibility may not be adequate to cope with the irregular nature of many stresses. In the wheat-growing areas of Australia, temperatures increase from the time of heading through to crop maturity so that grain filling often occurs at above-optimum temperatures. Added to this is the possibility of extreme high temperatures (heat shock) or drought. In warmer growing regions these temperature extremes may be avoided in part by earlier planting, but this approach will depend on suitable temperature conditions and the availability of water for germination and seedling establishment early in the year. In cooler wheat-growing regions earlier planting may expose the developing infloresence to possible frost damage resulting in reduced fertility and grain set (Figure 14.3).

14.1.2 - Plant temperatures

Most field studies on the relation between growth (and yield) and temperature are based on meteorological data collected in the vicinity of the crop or ecological area under examination. Although these data have proved to be of considerable value in assessing the response of plants to temperature, actual plant temperatures can differ considerably from air temperature and temperatures can also vary from organ to organ within a plant.

Plant temperatures will be influenced by plant form (erect or prostrate), leaf area, aspect (e.g. north- or south-facing slope), irradiance (sun angle, cloud cover and altitude) and air flow (wind). There are also plant characteristics such as reflection from the surface of the leaf, leaf angle and leaf cooling by transpiration which will reduce plant temperature and may minimise the damage associated with above-optimal air temperatures. At the other end of the scale, where there is moisture on leaves, the latent heat produced during external ice formation (a white frost) may provide some initial protection of tissues against frost damage.

Leaf temperatures generally follow the diurnal changes in air temperatures (Fig. 14.4). At sunrise with a clear sky there is a rapid rise in air temperature and leaf temperature, with a slower and lower rise in root and surface soil temperature. This relationship is altered considerably by cloud cover and at night root temperatures will be higher than leaf temperatures. Organ volume (thickness) can also have a marked influence on temperature and this can be seen, for example, in the apple-growing regions around Auckland in New Zealand. On a windless sunny day with an air temperature of 26°C, while leaf temperature in an apple orchard may reach 29°C, the peripheral flesh of the fruit on the sunny side of a tree can reach 45°C.

Fig14.4.png

Figure 14.4. Plant temperatures generally follow the diurnal pattern of air temperatures, but may be higher (sometimes 10°C or more) due to strong irradiance from full sunlight, or cooler (often by 2-3°C) due to transpirational cooling. Tissues and organs of a plant are not necessarily at a uniform temperature. Root temperatures are generally lower than those of leaves during daytime and higher at night-time, reflecting the differences between air and soil temperatures. Based on Davidson (1969) Ann Bot 33, 561-569.

Under normal field conditions mean day temperatures can commonly be 5°C to 10°C higher than mean night temperatures, with a much greater amplitude between maximum and minimum temperatures. The importance of this day/night differential has received considerable attention in relation to the growth and yield of glasshouse crops where there is the possibility of some degree of temperature control. However, it is also of interest in field crops in relation to the development of models for use in predicting the effect of weather conditions on crop development.

Total plant growth would be favoured by low night temperatures as this would reduce respiratory losses at a time when the supply of carbohydrate might become limiting. However, dry matter production for a wide range of crops grown under constant but optimal temperature is equal to and often greater than dry matter production by the same crops grown under differential day/night temperatures with the same mean value. Where a day/night temperature differential is imposed, low night temperatures rather than low day temperatures favour growth. The amplitude of the day/night temperature differential is also important and increasing this from 10°C to 20°C can reduce growth.

14.1.3 - Plant energy budgets

Fig14.5.png

Figure 14.5. A notional energy budget for a mesophytic leaf on a well-watered plant. Taking an incident irradiance of 400 J m-2 s-1 as representative of midday conditions, 30 units are reflected, leaving 370 J m-2 s-1 absorbed. If air temperature is taken to be 20°C, relative humidity 50%, wind speed 0.8 m s-1 and leaf area 0.01 m2 (i.e. 100 cm2), then transpiration will be about 4 mmol H20 cm-2 s-1, and latent heat exchange will account for about 180 J m-2s-1. Sensible heat exchange will account for the remainder (about 190 J m-2 s-1) (Based on Nobel 1983)

All organisms must balance energy inputs and outputs in order to maintain tissue temperatures within a given range. Plants have evolved a range of adaptations that allow them to balance energy gain and loss and so avoid becoming too hot or too cold. Energy budget equations quantify the energy gained and lost through different processes. More complex energy budget models include leaf and canopy properties that influence the rate of energy transfer (see Lambers et al. 2008).

In a leaf energy budget, energy is gained through radiation absorbed, while energy is dissipated as radiant heat loss by emission of longwave radiation, sensible heat loss by convection, and latent heat loss by transpiration (Figure 14.5). For a leaf to maintain a constant temperature the energy exchange must be balanced such that:

Radiation absorbed = radiant heat loss + sensible heat loss + latent heat loss

Energy gain comes primarily from the sun in the form of shortwave radiation. Leaves absorb a large proportion of incident solar shortwave radiation, particularly in the visible wavebands (Figure 14.6). As any object with a temperature above absolute zero emits some radiation, leaves also absorb longwave radiation from their surroundings. A plant can reduce the amount of radiation absorbed by reducing the amount of leaf area exposed to the sun, e.g. by changing leaf orientation or leaf dimensions. Leaf properties such as surface wax, hairs and scales will also alter the amount of incident radiation that is reflected and transmitted (see section 14.7.2).

Fig14.6.png

Figure 14.6. Solar radiation striking a leaf is either reflected, transmitted or absorbed. Photosynthetically active radiation (0.4 to 0.7 µm) is strongly absorbed, whereas near-infrared radiation which would heat leaves but is useless for photosynthesis (between about 0.8 and 2 µm) is only weakly absorbed. Far-infrared radiation is strongly absorbed, but energy per quantum is greatly diminished at these long wavelengths, so that consequences for leaf heating are greatly diminished. Based on Gates (1965) Meteor Monogr 6, 1-26.

During the day, thermal energy that is absorbed by a leaf must be dissipated to prevent the leaf from overheating. A large amount of heat is lost through the emission of longwave radiation, but this is normally balanced by inputs of longwave radiation from the surrounding environment. The rate of radiant heat loss is determined by leaf temperature and by leaf emissivity. Emissivity does not vary greatly between leaves; generally darker, smoother leaves have a higher emissivity (as well as a high absorbance) (Lambers et al., 2008). At night time, radiant heat loss can cause leaf temperature to drop well below that of the surrounding air. On long, cloudless nights, when there is little radiant input from the atmosphere, dew can condense on the leaf surface and, in extreme cases, leaves may cool below zero resulting in frost damage. 

During the day a leaf typically loses sensible heat to the surrounding air through convection. At night the situation is usually reversed with leaves gaining heat from the surrounding air. The rate at which heat is gained or lost is proportional to the difference in temperature and to the amount of resistance between a leaf and the surrounding air. Characteristics that increase the size of the boundary-layer, e.g. large leaf dimensions or presence of leaf hairs, will reduce the rate of heat exchange. Similarly, reduced wind speed will reduce the rate of sensible heat exchange.

For transpiration to occur, water contained in cells within a leaf must change into water vapour and escape through stomatal pores. For the water to move from a cell to the inter-cellular air space it must change from a liquid to a gas (water vapour). This phase change from liquid to gas consumes a large amount of energy and in doing so cools the leaf. This loss of energy is referred to as latent heat loss. The rate at which transpiration occurs is proportional to the difference in humidity and to the amount of resistance between the inside of the leaf and the surrounding air. As well as wind speed and boundary layer properties, transpiration is strongly influenced by stomatal resistance. When the stomata are closed, heat loss through transpiration is negligible. Although stomatal resistance has a large impact on leaf temperature, it is generally accepted that stomatal opening does not respond directly to changes in temperature. In hot, dry conditions stomata will typically remain closed even when a leaf is overheating (Lambers et al. 2008).

Further Reading

Lambers H, Chapin FS, Pons TL.  2008. Plant physiological ecology. Springer

Nobel PS. 1983. Biophysical plant physiology and ecology.WH Freeman.  

14.2 - Growth and development responses to temperature

Updated by John F Angus and Howard M Rawson, CSIRO Plant Industry, Canberra

Plants can be classified in their temperature responses into broad groups. One group is defined by sensitivity to low temperature: ‘chilling-sensitive’ species are unable to grow, and often suffer visible damage, below 10–15°C and ‘chilling-tolerant’ species are able to grow down to 0°C and able to survive below this temperature.  Within each group, important temperature-sensitive processes are leaf expansion and stem elongation, both of which depend on cell expansion before the cell walls harden.

Another division is based on differences in the pathway of CO2 fixation during photosynthesis, where species in which initial fixation occurs via Rubisco and the photosynthetic carbon reduction cycle are designated C3 species and species in which initial fixation occurs via phosphoenolpyruvate (PEP) carboxylase and the four-carbon dicarboxylic acid pathway are designated C4 species. C4 species include maize and sorghum and such species have high optimum temperatures (≥30°C) for growth. Most C4 plants are also chilling sensitive (Section 14.4). C3 species, on the other hand, show considerable variation in their optimum growth temperature, which can range from close to 30°C in rice to less than 10°C in some alpine species, and they also include a wide range of both chilling-sensitive and chilling-tolerant plants.

14.2.1 - Plant variation in sensitivity to temperature

At any given stage of development, it is possible to define the minimum temperature below which a plant will not grow, suboptimal temperatures where a further increase in temperature will result in increased growth, optimal temperatures when growth is at its maximum, supraoptimal temperatures where a decrease in temperature will result in increased growth and the maximum temperature above which a plant will stop growing. Sustained temperatures beyond this range will be lethal.

Temperature is an important factor in controlling changes in growth and development from germination, through vegetative growth to floral initiation and reproductive growth. Not all stages of development, or different physiological processes, are equally sensitive to temperature. For example, the stage of pollen meiosis during anther development in rice is particularly sensitive to low temperature extremes, whereas in wheat it is less so. Variation in temperature tolerance is also evident within single plants as well as between genotypes. Young actively growing tissues are generally more sensitive to temperature variation than mature tissues and dormant tissues such as buds and seeds can often survive quite extreme temperatures. Frost tolerance in apple is greatest in the stem and then follows a sequence of decreasing tolerance from the mature leaf to the young leaf and floral parts, with the ovary, style and stigma of flowers being least tolerant of frost.

Variation in temperature sensitivity between tissues and physiological processes is also seen in sorghum, a subtropical C4 species. Frost damage occurs to green tissue below –1°C, there is poor seed germination below 6°C, chlorophyll destruction occurs in mature green tissue under high light at 10°C, there is poor pollen development below 13°C and chlorophyll formation in young developing leaves is inhibited at temperatures below 16.5°C (Bagnall 1982).

Fig14.7.png

Figure 14.7. Temperature effects on growth can be viewed in relation to either rate of organ production or the final size attained. Size results from both rate and duration of growth, and there are many examples where organ size is reduced at high temperature because rate of growth cannot compensate for a reduced duration of growth. This is illustrated for wheat (a temperate cereal) and rice (a subtropical cereal). At low temperature wheat has a much larger grain than rice, but rice has a much more stable grain size than wheat in relation to temperature and at 30°C grain size in the two species is very similar. (Based on Tashiro and Wardlaw 1989)

Temperature effects on growth can be viewed in terms of rate multiplied by duration of growth where individual components have different temperature optima (Figure 14.7). As temperature increases within a plant’s dynamic range, duration of growth decreases but rate of growth increases. As a consequence, organ size at maturity may change very little in response to temperature despite variation in growth rate. As temperatures are raised further, an increased rate of growth is no longer able to compensate for a reduction in duration, and the final mass (or volume) of a given organ at maturity is reduced. This is providing that soil water can be maintained during this period. This response can be seen in a range of tissues including leaves, stems and fruits (and seeds). A smaller organ size at maturity due to high temperature is usually associated with smaller cells rather than a change in cell number.

14.2.2 - Thermal time and crop development

As already described, the time taken for plants and their organs to develop within their dynamic temperature range decreases as temperature increases. This was first quantified in the eighteenth century when the French physiologist Reaumur showed that grapes growing in different regions and seasons ripened when the accumulated daily temperature, ti , reached a (fairly) constant value, k, which is known as day degrees, heat units or heatsum. In equation (1) daily temperature is the mean of maximum and minimum temperatures, the subscript i refers to days and the summation was from winter until grape ripening. The units are °C.d.

\[\displaystyle\sum\limits_{winter}^{ripening} t_i=k \tag{14.1}\]

The system of accumulating temperature in this way is known as thermal time and can be applied to the life cycle of a plant or organ, or a phase of a plant’s development such as the seed-filling phase or the expansion of a single leaf.

One weakness of this system is that temperature accumulates above 0°C while in reality, for many species, development stops at temperatures well above freezing.  Instead of accumulating temperatures above 0°C, thermal time systems now use a base or threshold temperature, tbase, which varies with species and is estimated as the value that provides the most constant value of k. Using this system, heat sum is calculated from daily temperatures above tbase , as indicated by the subscript + in equation 2

\[\displaystyle\sum\limits_{finish}^{start} (t_i-t_{base})_{+}  =k \tag{14.2}\]

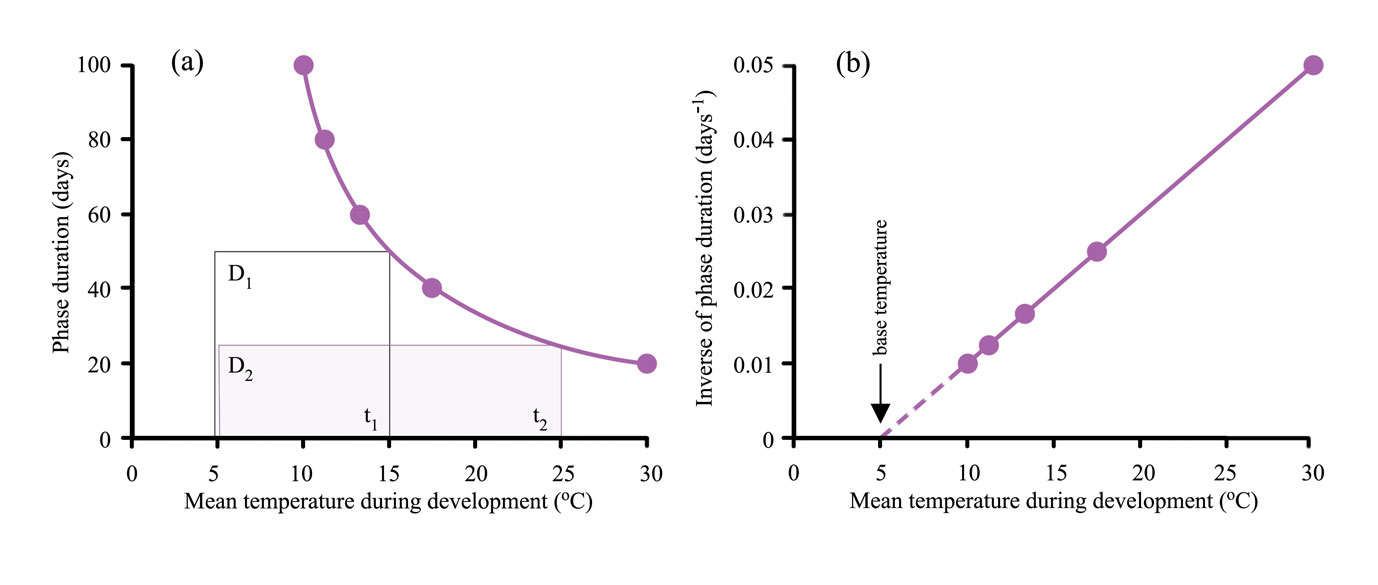
The thermal time system can be simplified providing no daily temperature during a phase falls below tbase.  An example of the simplified system appears as a graph of duration of a phase, D, versus the mean temperature of the phase, ť (Figure 14.8a).  This line is defined by the duration of the phase, D, and the mean temperature of the whole phase above the base temperature, ť-tbase.  The product of these variables is the heatsum, k (equation 3).

\[D(t-t_{base})=k \tag{14.3}\]

Fig14.8.jpg

Figure 14.8. Duration of a phase in a plant’s life cycle, measured as time, decreases as mean temperature increases. For many plants, duration, when measured as thermal units, becomes a constant value. This thermal duration is called a heat sum, heat units or day degrees. It is calculated as the product of time duration and the mean temperature of the phase above a suitable base temperature. The base is 5°C in this graphical example that represents the temperature response of the phase from seedling emergence to flowering (anthesis) of a temperate plant such as wheat. The wheat developmental pattern is shown in (a) as a rectangular hyperbola (purple curve) in which the areas of the rectangles are equal. Expressing the same wheat data as the inverse of time duration against mean temperature (b) produces a straight line. The slope of the straight line is the inverse of the heat sum and the intercept on the x-axis is the base temperature.

Figure 14.8 shows the effect of temperature on phase duration from seedling emergence to flowering (anthesis). The curve in Figure 14.8a is a rectangular hyperbola, meaning that the areas of rectangles defined by the graph are constant, so in the examples \(D_1(t_1'-t_{base})=D_2(t_2'-t_{base})\). For example a duration of 100 days at a mean temperature of 10°C represents a heat sum of 500 °C.d above a base temperature of 5°C i.e. 100(10-5) = 500 °C.d.  The relationship can be linearised by plotting the inverse of duration 1/D against mean temperature (Figure 14.8b). 1/D is defined as the mean rate of development, with units of day-1, and is equivalent to the proportion of development per day (equation 4).

\[\frac{1}{D}=\frac{1}{k}(t'-t_{base})_{+} \tag{14.4}\]

Extrapolation of the line to the x-axis provides an estimate of tbase and the slope of the line, 1/k, is the heatsum.  The advantage of plotting results in this way is that it provides a test of whether the thermal time system works for the data. 

According to this example for wheat, a 2°C warming above a mean of 15°C would reduce the number of days to anthesis from 50 to ~42(500 °C.d / (15°C - 5°C) = 50 days and 500 °C.d / (17°C - 5°C) = 41.7 days).  Reduced duration can mean less crop growth because of fewer days for intercepting solar radiation and photosynthesis. 

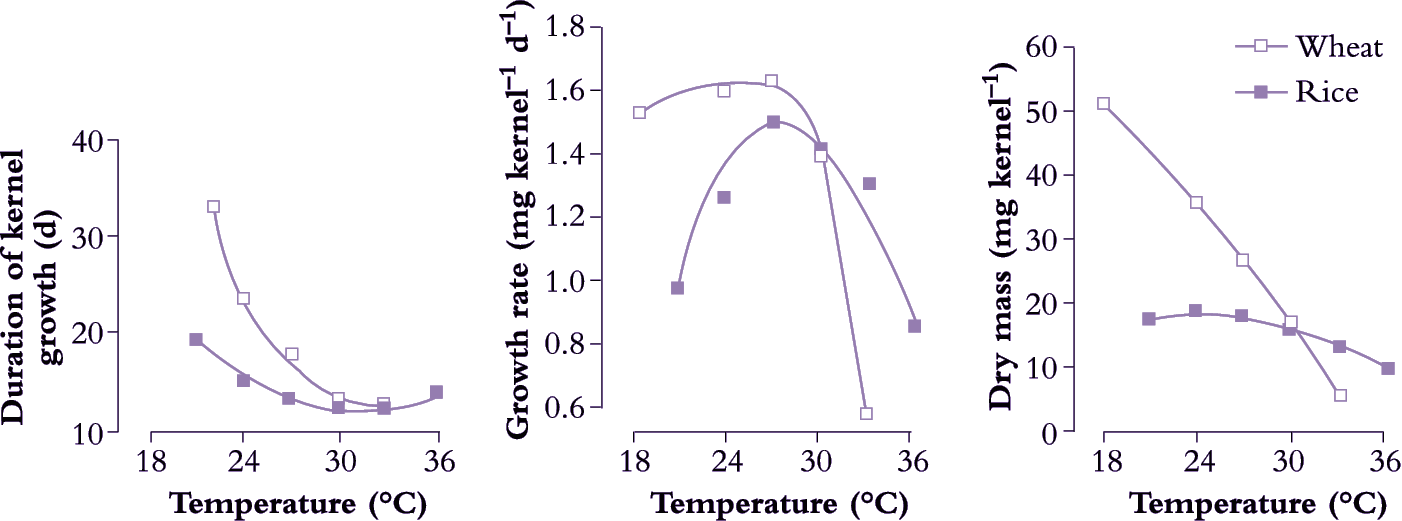
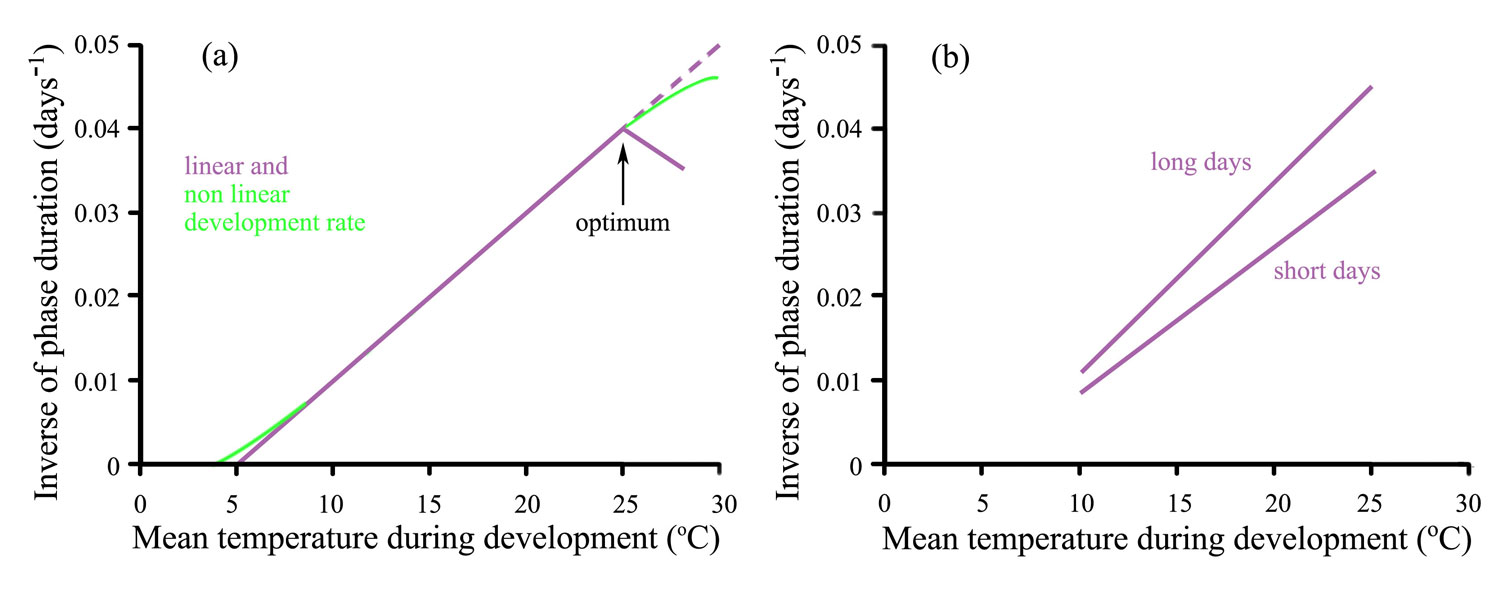
Rate of development is not always linearly related to mean temperature (Figure 14.9a).  At high temperatures the development rate of some plant phases decreases, showing a clear optimum temperature (arrowed).  This cardinal temperature along with the base temperature, defines the boundary of the dynamic temperature range for the phase, organ or species.  An optimum temperature is more likely to appear when plants are exposed to high temperature when light levels are relatively low.  Rate of development is affected by both temperature and photoperiod in photoperiod-sensitive species. So while development responses remain linearly related to temperature the slopes change with photoperiod; a long-day plant develops more rapidly in long days than in short days (Figure 14.9b).

Fig14.9.jpg

Figure. 14.9. Exceptions to the simple thermal time system shown in Figure 14.8. At temperatures close to the base temperature and at high temperatures development may diverge from a linear response of development rate to temperature (shown in (a) as the green departures from the purple straight line). In some species and phases there is a reduced development rate with higher temperature, shown in (a) by the purple line declining beyond the optimum). A long-day plant shows more rapid development in long days than short days over a wide range of temperatures (b).  Short-day plants show the reverse response. Based on Angus et al. (1981).

Thermal time can be used to predict crop development and the stages when herbicides, insecticides and fertiliser should be applied.  This is useful for farmers who manage crops over distances of hundreds of kilometres and need to visit them at a particular stage of development.  Thermal time can also be used to back-calculate the best sowing date to minimise the risk of frost or excessive heat damage at sensitive stages of development.

Fig14.10.jpg

Figure 14.10. Spreadsheet to calculate heatsum from daily maximum and minimum temperatures and a base temperature. Daily mean temperatures below the base do not contribute to heatsum, as shown by the equation in cell G9.

The dynamic ranges of temperatures for subtropical and tropical species are much higher than for this example of temperate wheat.  Consequently the base temperature will be higher and the heatsum different.  Nevertheless the method for calculating thermal time is similar. 

Practical Notes: It is easy to calculate heatsums from temperature data that you measure yourself or download from the internet. Figure 14.10 is a spreadsheet showing a week’s accumulation of heatsums using different base temperatures. When collecting temperature data, remember to shade the thermometer, allow free air circulation and install it at the standard height for your region (1.2 m above ground in Australia).  To test the relationship between heatsum and phasic development you can record development of a phase of plant development in several environments by growing plants at different times of year or in different locations. For that, you need to record on your temperature spreadsheet the date of the start of the chosen phase (maybe the sowing date) and the date of the end of the phase (maybe flowering). Work out the thermal time for each day of the phase like in Figure 14.10, and add all sums together to produce the heatsum for the phase. Compare that result with data you collect from other planting dates. Are the heatsums the same despite different temperatures? If you calculate the mean temperature for the phase on your spreadsheet and the number of days from start to finish of the phase you can graph your combined data like in Figure 14.8. If you have enough sowing dates you will be able to work out the real base temperature for that phase of the chosen species.

Some Definitions:

Development refers to the changes in form or ontogeny of plants (and animals) rather than growth, which means the increase of mass.  While normally growth and development are loosely related, it is possible to have growth without development, for example the continuous growth of vegetative buffalo grass, or to have development uncoupled from growth, for example when the flowering date of stunted drought-affected wheat is similar to the flowering date of well-watered wheat.

Phasic development relates to phases in a plant’s life cycle.  For example the phases in the life cycle of an annual crop are vegetative (between seedling emergence and floral initiation), reproductive (between floral initiation and flowering, called anthesis in wheat) and grain filling (between anthesis and physiological maturity)

Phenology is the science of the influence of climate on the occurrence of biological events

14.2.3 - Photothermal Quotient (PTQ) predicts potential crop yield

PTQ is the ratio of solar radiation to mean temperature during a phase of crop development. Nix (1976) proposed that PTQ could be used to predict potential crop yield, i.e. the yield when crop management overcomes the limitations of water deficit or surplus, nutrient deficiency, pests and diseases. Solar radiation is the numerator because it drives photosynthesis.  Temperature is the denominator because increased temperature leads to faster development and so reduces the time available for photosynthesis.

It is more correct to refer to ‘short-wave global radiation’ than solar radiation because ‘global’ here refers to radiation from the whole sky, including diffuse radiation, but excludes the long waves that have no effect on photosynthesis. The units of PTQ are MJ m-2 d-1 °C-1.  In the case of wheat a base temperature of 0°C is acceptable.  For warm season crops such as maize, a base temperature of 10°C should be used.

Evidence for the accuracy of PTQ comes from three examples of wheat.

Fig14.11.jpg

Figure 14.11. (a) Grain numbers per ear in wheat are set by temperature and radiation during the period from floral initiation to flag leaf expansion as shown by transferring plants amongst temperatures throughout the period. Numbers were closely correlated with PTQ (accumulated radiation divided by thermal time for each of the 24 treatments): After Rawson and Bagga 1979. (b) The relation between PTQ and wheat yield in 23 mini-canopies in controlled environments, compiled by Rawson (1988). The correlation between PTQ and grain number in (a) translated to a close correlation between PTQ and yield in (b) because weight per grain is relatively stable in wheat.  (c) The same linear relationship from (b), see equation 5 below, closely predicts potential grain yield at field scales at locations ranging over many degrees of latitude: southern hemisphere data from Peake and Angus (2009). This suggests that basic meteorological data of temperature and radiation is all that is needed to provide first order estimates of potential crop yields at new locations.

Figure 14.11a shows results from plants grown in naturally-lit temperature-controlled glasshouses and batches transferred every four days between different temperatures during the phases prior to ear emergence. The number of grains per ear changed with temperature but was better correlated with PTQ than with thermal time alone or radiation alone.  Since mean kernel weight is stable for a wheat variety when water and nutrition are adequate, a reasonable hypothesis is that grain yield (grain number x kernel weight) would also be related to PTQ. All that is required to estimate likely potential yield for a location would be local radiation and temperature data. Figure 14.11b shows a test of the grain yield – PTQ relationship with data from temperature-controlled glasshouses and growth chambers using mini-crops of wheat grown in different temperature and radiation environments. The regression fitted to these data was

\[\text{YIELD (t ha}^{-1}) = -3.45+9.59 \text{ PTQ} \tag{14.5}\]

Figure 14.11c shows the line from this equation along with data from commercial crops, including a crop from the Canterbury Plains of New Zealand that set the 2010 world yield record of 15.9 t ha-1

The close relationship between the prediction and the data suggests that PTQ can predict potential wheat yield from tropical to cool temperate zones. PTQ therefore provides farmers with a benchmark to assess the yield of their crops. If their yields are well below the benchmark there is scope for improved crop management or genetics.

References

Angus JF, Mackenzie DH, Morton R, Schafer CA (1981). Phasic development in field crops II. Thermal and photoperiodic responses of spring wheat.  Field Crop Res 4: 269-283

Nix HA (1976) Climate and crop productivity in Australia. In Climate and Rice. International Rice Research Institute, Philippines, pp 495-506

Peake AS, Angus JF (2009) Increasing yield of irrigated wheat in Queensland and northern NSW. Goondiwindi Grains Research Update, March 3-4, 2009. Link: http://www.grdc.com.au/Research-and-Development/GRDC-Update-Papers/2009/11/Increasing-Yield-of-Irrigated-Wheat-in-Queensland-and-Northern-NSW

Rawson HM, Bagga AK (1979) Influence of temperature between floral initiation and flag leaf emergence on grain number in wheat. Aust J Plant Physiol 6: 391-400

Rawson HM (1988) Constraints associated with rice–wheat rotations: effects of high temperatures on the development and yield of wheat and practices to reduce deleterious effects. In AR Klatt, ed, Wheat production constraints in tropical environments. International Maize and Wheat Improvement Center (CIMMYT), Mexico DF, pp 44–62 . Link: http://books.google.com.au/books/about/Wheat_Production_Constraints_in_Tropical.html?id=SBnPP4xZg3oC&redir_esc=y

Tashiro T, Wardlaw IF (1989) A comparison of the effect of high temperature on grain development in wheat and rice. Ann Bot 64::59-65

14.3 - Responses of enzymes, photosynthesis and assimilate transport

Enzyme activity is very responsive to temperature, as is enzyme synthesis, activation and stability. However the response of plant growth to temperature is the result of a number of complex processes involving many enzyme systems, and most likely governed by the response of the enzymes involved in CO2 fixation. The different temperature responses of C3 versus C4 photosynthesis are described next, along with temperature effects on assimilate transport and on the basic concepts of enzyme activity including the Q10: the increase in rate of respiration for a 10°C rise in temperature.

14.3.1 - Photosynthesis

Fig14.12.png

Figure 14.12. Plant species show characteristic variation in the way photosynthetic tissue responds to temperature. Maize (a subtropical C4 species) has a high maximum rate of CO2 assimilation with a high optimum temperature, while wheat (a temperate C3 species) has a lower maximum rate and a lower optimum temperature. (a) Absolute values; (b) shows those same data normalised to 100% at optimum temperature. Alpine plants (C3 species) have an even lower optimum temperature and may show CO2 assimilation below 0 °C, but their maximum rates of photosynthesis are often low compared with warmer climate species. Based on I F Wardlaw (1979).

CO2 assimilation underpins plant productivity and is therefore central to any analysis of the response of plants to a change in temperature. In photosynthetic terms, plants can be divided broadly into the groups discussed earlier.

Some C3 species such as snow tussocks have an optimum temperature for CO2 assimilation as low as 5°C, but it is important to note that absolute rates at this temperature may be relatively low (Figure 14.12). Most temperate grasses and cereals as well as many woody species have temperature optima in the range from 15°C to 25°C and within this range many C3 species show only small changes in CO2 uptake. In contrast to temperate C3 species, CO2 assimilation by C4 species increases considerably with a rise in temperature from 15°C to 30°C and optimum temperatures may be greater than this (Figure 14.12). Rice, a subtropical C3 species, has a higher temperature optimum for CO2 assimilation than temperate C3 species. Under high light, C4 species have a characteristically greater photosynthetic rate than the C3 species, but these differences disappear and may be reversed at low temperature. Growth temperatures may also influence the optimum temperature for net photosynthesis, which may therefore vary with season or location. However, modifications leading to an improvement in photosynthesis at high temperatures can result in decreased performance at low temperatures and vice versa.

A combination of at least two factors may be associated with the failure of C3 species to respond more favourably to high temperature in terms of CO2 assimilation. One is the limit placed on photosynthesis by ambient CO2 (Figure 14.13), and a second is the concurrent rise with increasing temperature of light-stimulated photorespiration, which is effectively absent from C4 species. Increased atmospheric CO2 inhibits photo-respiration and results in a much greater uptake of CO2 in response to increased temperature in C3 species.

Fig14.13.png

Figure 14.13. Maize (a subtropical C4 species) has a high optimum temperature (~30 °C) for CO2 assimilation, while barley (a temperate C3 species) has a lower, but less distinct optimum (~15 °C). Doubling CO2 has little effect on CO2 assimilation rate by maize (not shown here), but greatly increases the absolute rate and optimum temperature for barley by suppressing photorespiration. This O2-dependent loss of carbon increases with temperature and is largely responsible for the low optimum temperature of photosynthesis in many C3 species. Based on Labate, Adcock and Leegood (1990) Planta 188, 547-544.

While net photosynthesis is the resulting balance between gross photosynthesis and respiration, low or even negative net photosynthetic rates can have a significant effect on productivity. An example of this would be photosynthesis by the green pod of many legumes where the net uptake of CO2 is low because of a high rate of pod and seed respiration. A rise in temperature will result in greater respiratory losses from the pod and a reduction in net uptake of CO2, but this does not diminish the importance of pod photosynthesis.

Variation in stomatal resistance could be another factor associated with temperature effects on net assimilation of CO2. Adaptation to high temperature can be related to photosystem II electron transfer, the stability of chloroplast membrane-bound enzyme activities and the stability of the photosynthetic carbon metabolism enzymes that require light for activation. For example, enhanced assimilation of CO2 by rice at high temperature, in comparison with the more temperate C3 species, is associated with a greater response of ribulose-1,5-bisphosphate carboxylase in rice to increasing temperature.

In chilling-sensitive species such as maize, sorghum and mung bean, chlorophyll formation and chlorophyll destruction both occur in light at low temperatures. However, once greening has occurred quite low temperatures (but not usually freezing) can be tolerated as long as these occur during darkness. Low-temperature tolerance is also associated with a high level of strategic enzymes such as Rubisco, protein stability and membrane lipid composition.

Consideration must also be given to possible indirect effects of temperature on photosynthesis. For example, a change in root growth due to a change in temperature could alter the supply of nutrients or growth regulators, such as cytokinins, to the shoots. It is common to find a build up of non-structural carbohydrates in many parts of a plant under low-temperature conditions, a response indicating that growth is more sensitive to low temperature than photosynthesis. However, feedback inhibition of photosynthesis associated with this excess carbohydrate accumulation under low-temperature conditions occurs in a number of species. In summary, it is important to take into account the possibility of indirect effects of temperature on photosynthetic tissue when looking for genetic differences in photosynthetic responses to temperature.

14.3.2 - Assimilate transport

There are three components of nutrient and photosynthate transfer in plants that might respond to temperature in different ways: (1) transfer of metabolites across cell membranes, including the exchange between apoplasm (space external to cell membranes) and the symplasm (space contained by cell membranes); (2) cell to cell transfer (within the symplasm) via plasmodesmal connections, and (3) movement of metabolites over long distances through phloem sieve elements.

Selective transfer of metabolites across a membrane against a concentration gradient is an energy-requiring step involving respiratory activity and membrane-bound ATPase (see Figure 1 in Case study 2.1). This metabolically active process is responsive to temperature. Membrane transfer is associated with many physiological functions including movement of metabolites and photoassimilate loading within source leaves, exchange with storage tissues along the path of transport and photoassimilate loading into sinks. The response of long-distance photoassimilate translocation to low temperature varies widely between species. In many temperate Gramineae (including wheat) a drop in temperature along the path of transport to 1°C has no measurable effect on the translocation of photosynthate, but at this temperature in chilling-sensitive species such as bean and sorghum there is a marked reduction in the translocation of photosynthate. In some chilling-tolerant species such as sugar beet, there is an initial rapid decline in translocation following application of low temperature along the path of transport, but this inhibition is transient in nature, with translocation returning to normal in a number of hours. In species that are more sensitive to chilling such as squash there is some adjustment to low temperature, resulting in partial recovery. Such adjust-ments vary between ecotypes within the one species, for example in Canada thistle where behaviour is related to altitude and thus temperature in natural surroundings (Figure 14.14). Lowering the temperature of the transport pathway also reduces the lateral transfer of carbon into adjacent tissues, or alternatively the remobilisation of stored carbohydrate back into the transport system. By contrast, translocation can be relatively insensitive to temperatures up to 40°C, but will be inhibited by prolonged periods of temperature >40°C. Prolonging a high-temperature treatment, unlike the low end of the scale, does not result in recovery; rather, blockage intensifies.

Fig14.14.png

Figure 14.14. Effects of low temperature on translocation of photoassimilate through phloem has frequently been measured by changing pathway temperature between a source and a sink and following variation in the rate of movement of radioactively labelled photosynthate. (a) Translocation in some species such as wheat is especially tolerant of low temperature, but greatly reduced in others such as bean. Again, in other species such as Nymphoides and sugar beet there is an initial retardation of translocation immediately after a low-temperature block is imposed, but translocation subsequently improves even though the low-temperature is retained. (b) Canada thistle has both attributes with the northern (colder) ecotype showing rapid recovery of translocation at low temperature and the southern (warmer) ecotype showing very little recovery over the first 3 h. Based on I.F. Wardlaw (1979).

The exact nature of the inhibition of long-distance transport at temperature extremes is still uncertain. Inhibition appears not to be energy related in a metabolic sense, but low-temperature effects may be due to a displacement of proteinacious material. This would lead to transient responses that reverse in time. More sustained responses under either low- or high-temperature treatments are likely to be due to a build up of callose (a β-1,3 glucan) in sieve-plate pores.

 Whether reduced translocation is the cause of poor growth at extreme temperatures is often difficult to assess. This is partly because of the transient nature of the temperature response in many species and partly because the response of the transport system to temperature has been examined in isolation from other processes. In sorghum, where temperatures below 20°C effectively reduce translocation, this reduction is minor in comparison with the direct effect of the same temperature on growth. Current findings suggest that long-distance transport in the phloem does not have a direct role in regulating whole-plant responses to temperature.   

14.3.3 - Biochemistry and basic concepts

Fig14.15.png

Figure 14.15. Molecules must collide for a chemical reaction to occur, but from the expected number of collisions in a given solution it is clear that only a small number of these collisions actually result in a reaction. For a reaction to occur not only must molecules collide but they must do so above a critical velocity or minimum energy (activation energy).This explains an apparent anomoly where kinetic theory predicts that a 10 K (Kelvin) increase in absolute temperature (K = °C + 273) would be expected to increase the number of collisions by about 2%. However, above a critical value the rate of a reaction can increase two- to three-fold (200-300%) per 10°C rise because the number of collisions increases considerably more than average behaviour would predict. This change in the rate of a reaction with a rise in temperature of 10°C is known as the Q10 value and is around 2 to 3 for many chemical (enzyme) reactions which are operating within their dynamic range (Based on various sources, courtesy I.F. Wardlaw)

Enzymes play a major role in regulating the way in which plants respond to temperature. The effect of temperature on enzyme activity is expressed through the maximum rate (Vmax) and the enzyme–substrate affinity (Km) and this in turn is related to the effect of temperature on enzyme synthesis, activation and stability.

Basic metabolic rates tend to increase exponentially within their dynamic range (10–30°C) so that a rise in temperature of 10°C will at least double reaction rate, that is, ‘Q10’ = 2 (Figure 14.15). Q10 represents the net outcome of increased activity of an enzyme system with increased temperature, offset by any deactivation of the enzyme associated with this increase. Q10 values for metabolic processes are generally in the range of 2–3 and values below this imply that the reaction is at least partly governed by physical rather than metabolic processes. Q10 values for physical processes are commonly around 1.3. Physical limitation occurs when there are barriers to the transfer of substrate to reaction sites in a cell. Reaction rates of whole organisms or even organs often increase approximately linearly with temperature. Respiration is a case in point. This departure from an exponential increase results from a progressive shift in the reaction rates of component processes which first increase exponentially with temperature but then become modified by physical constraints such as substrate availability.

Enzymes can adjust to changes in the temperature environment, such that rates in acclimated plants are not as divergent as would be anticipated from the immediate response to temperature change. Acclimation can take a number of forms which may involve changes in isozymes or enzyme concentration, modification of an enzyme by substrate and effectors, or changes in metabolic regulation.

The concept of Q10 values has been extended to complex cellular and even whole-plant functions and has been used to provide some insight into the nature of the factors limiting the response of plants to temperature.

The ‘thermal kinetic window’ is a concept that relates enzyme activity and optimal plant metabolism to the temperature characteristics of the Michaelis–Menten constant (Km) of substrates and cofactors. Thermal kinetic windows define the temperature range outside which plants experience thermal stress. Many enzymes operate under non-saturating substrate concentrations and substrate binding (Km) may at times be of greater importance than maximum velocity (Vmax) for the characterisation of enzyme function under physiological conditions. The thermal kinetic window for a specific enzyme in a particular species (often spanning 8–15°C) is generally narrower than the plant temperatures experienced on a seasonal or daily basis, and temperature extremes that induce heat shock and chilling injury are not required for plants to experience some degree of thermal stress.

In the event of a sustained change in temperature conditions of plant growth, temperature:Km relationships for key enzyme reactions can adjust towards a temperature optimisation for metabolism and hence growth under those conditions, an out-come referred to above as acclimation and amenable to analysis via an Arrhenius plot to reveal underlying bioenergetics.

By analogy with graphs used to illustrate Michaelis–Menten kinetics, the natural logarithm of a physiological reaction rate (k) plotted against the reciprocal of absolute temperature (1/T) yields a straight line (Figure 14.7). This procedure in effect linearises an exponential response of reaction rate to temperature, and can be summarised in general terms as:

\[k=Ae^{\frac{E_a}{RT}}\tag{14.6}\]

where k is the rate constant of the reaction; A is a constant (exponential or frequency factor); Ea is the activation energy; R is the universal gas constant; T is absolute temperature in degrees Kelvin (K).

This equation can be rearranged to facilitate comparisons of reaction rate at two temperatures, T1 and T2:

\[\frac{\text{ln }k_2}{\text{ln }k_1} = A \frac{T_2-T_1}{T_1/T_2}\tag{14.7}\]

This relates enzyme activity to temperature where k1 and k2 are the reaction rates at absolute temperatures T1 and T2.

Plotting log k as a function of 1/T yields a linear relationship in the dynamic temperature range where the organism shows readily reversible responses to temperature, and can live indefinitely. Slope indicates the ‘energy of activation’ (Ea) which is the minimal energy required for the reaction to occur. A change in slope of this line indicates a change in sensitivity. A steeper slope at low temperature indicates that the energy of activation has increased and has therefore become more limiting to maximum velocity (Vmax) of the overall reaction (Figure 14.16).

Fig14.16.png

Figure 14.16. (a) Dark respiration of white clover leaves (dry mass basis) increases with temperature. However, respiration rate depends on the conditions under which plants have grown and is greater for leaves grown under cool conditions. (b) An Arrhenius plot provides a useful basis for comparing the temperature response of two sets of leaves. Respiration (reaction) rate (log transformed) is plotted as a function of the reciprocal of absolute (Kelvin) temperature (1/temperature (K)). An Arrhenius plot (see Equation 14.1) is also used in analysing many chemical transformations and processes in which absolute rates are exponentially related to temperature and thus yield a straight-line relationship as illustrated here. Arrhenius equations have been applied to a whole range of plant functions from photosynthesis to changes in dry mass. Slope is characteristic of a particular reaction and varies between species, but in this example using clover there is little difference between warm and cool region leaves, indicating that the basic activation energies are similar. (c) Many subtropical species, such as mung bean, are chilling sensitive, growing poorly at temperatures well above freezing. An Arrhenius plot of growth (or a more specific biochemical reaction) is no longer linear throughout the whole temperature range. A steeper slope at low temperature implies that the energy of activation has increased and has become more limiting to plant function compared with values above that chilling threshold. At high temperatures the slope of the line is again reversed as enzymes are inactivated. Actual values will vary from one reaction to another and between species. (a) Based on Woledge and Dennis (1982) Ann Bot 50, 25-35. (c) Based on Bagnall and Wolfe (1978) J Exp Bot 29, 1231-1242.

Considerable use has been made of Arrhenius plots in attempts to determine critical temperatures for key enzymatic reactions in plant cells. Membrane lipids may undergo a phase change from the mobile to the solid state with a fall in temperature and this will vary with the nature of the lipids in the membrane, particularly the degree of unsaturation (double bonds). Any change in lipid properties would be expected to modify the activity of membrane-bound enzymes. Because of the complex nature of membranes, such change will often be a gradual rather than an abrupt change at a precise temperature.

Arrhenius plots have also been used to analyse the response to temperature of individual organs and whole plants in order to determine critical temperatures for growth. In chilling-sensitive species, the slope of the Arrhenius plot becomes steeper at low temperature, indicating a change in enzyme–temperature relationships. Plant taxa which experience broader ranges of temperature during growth in their native habitats can have smaller Arrhenius temperature coefficients.

Membranes and their associated enzymes are likely to provide a key to many temperature responses in plants and this can be extended to frost damage where membrane destabilisation resulting from freeze-induced dehydration is a major factor in freezing injury (Section 14.6).

14.4 - Chilling injury

Original Author: Susan E Hetherington, University of Queensland, with update by David Brummell, Plant and Food Research, New Zealand

Plants may develop physiological disorders when exposed to low but non-freezing temperatures. The German plant physiologist Molisch suggested the term ‘chilling injury’ as long ago as 1897 to describe this phenomenon. Symptoms of chilling injury can differ widely between species, but usually develop rapidly in plants native to tropical and subtropical climates and almost imperceptibly slowly in plants originating in cool temperate climates. Within the range of chilling temperatures, that is, from the temperature of the freezing point of the plant tissue up to about 13°C, the rate at which chilling injury develops intensifies with decreasing temperature and increasing duration.

Throughout history, people around the world have collected plants on their travels and taken them to other countries and continents. When tropical and subtropical plants collected from low altitudes have been taken to temperate climates they have had to be housed in protective structures for all or part of the year. In the case of Citrus species introduced into northern Europe in the sixteenth and seventeenth centuries from warmer southern climates, summer temperatures in countries such as France and Germany were mild enough to allow these trees to be grown outside in the summer. At other times of the year, however, potted trees were moved into buildings known as orangeries for protection against the low temperatures. Similarly, during the late seventeenth century, a time when a great number of exotic chilling-sensitive palms, trees and foliage plants were introduced into temperate countries by plant collectors operating in the tropics and subtropics, these plants had to be protected from exposure to low temperatures at all times. Chilling-sensitive foliage plants such as Episcia spp., which are native to the Amazon basin, are killed within 30 min of being exposed to 1°C. Survival of such highly sensitive plants necessitated year-round protection from cold. This requirement was met by the invention of the heated glasshouse in the 1880s.

In modern agriculture, many species are cultivated outside their original microclimate. For example, avocado (Persea americana Mill.) was taken from tropical highlands in Mexico and is now grown in the temperate North Island of New Zealand and in inland Australia where nights are cold. When the new location has temperature minima below those of the region in which the plant evolved, problems of chilling injury can arise.

14.4.1 - Symptoms of chilling injury

Fig14.17.jpg

Figure 14.17. Cavendish Williams bananas harvested at the hard green stage from the same banana hand were either stored at 22°C for 11 d (non-chilled) or placed at 4°C for 7 d (chilled) before transfer to 22°C for 4 d. Compared to the non-chilled bananas, which gradually turned from green to yellow as they ripened, the chilled bananas failed to yellow and instead developed extensive peel blackening due to cell death. Slight peel blackening was evident when the bananas were removed from the 4°C treatment but greatly intensified at 22°C. To maintain the postharvest quality of Williams bananas, a crop which is worth approximately $180 million per annum to the Queensland economy, marketing authorities stipulate that the produce must not be cooled below 13°C during fruit storage, and for optimal fruit condition it should be kept in the temperature range 14–21°C. During the ripening of green bananas in the commercial ripening rooms at the Brisbane fresh produce market, the lowest temperature the fruit is allowed to equilibrate to is 14.5°C (Photograph courtesy S.E. Hetherington)

With annual crops, the time of greatest risk is likely to be early in a growth season, and especially during seedling establishment. Chilling injury to seedlings can show up as necrotic lesions on the young roots and shoots, with slowed growth and increased susceptibility to disease attack, and even death. Crops adversely affected by low temperatures during the establishment period take longer to mature and this in turn may mean that they are at risk to chilling temperatures towards the end of the growing season.

Not only does chilling exposure retard the growth and maturation of crops, but chilling damage to fresh produce during postharvest storage is also of economic importance (Figure 14.17, and see Section 11.6.5). Chilling injury is a particular problem with fresh fruit, vegetables and flowers, because storage at temperatures low enough to retard tissue respiration is still the most effective postharvest method for extending the shelf life of produce. Even in produce-handling industries, there is often insufficient appreciation of requirements and behaviour of individual crops or even specific cultivars, and losses ensue. The time taken for symptoms to develop varies greatly and is influenced by a number of factors including genotype, cultivar, stage of maturity and preharvest growth conditions. For example, with fruit stored at 1–2°C, it takes several months for chilling injury to develop in apples as a brown discolouration of the cortex, several weeks for the flesh of peaches to become mealy in texture, a number of days for avocados to show areas of grey discolouration in the flesh, and only a few hours for cucumbers to display tissue breakdown in the mesocarp. Obviously storage at 0–2°C is an excellent method for extending the storage life of apples, is moderately useful for peaches, but disastrous for cucumbers. Avocados are better kept at a higher storage temperature; the recommendation for extended storage of avocados is 6°C. Even this temperature is too low for tomato, another sub-tropical species susceptible to chilling injury. Ripe tomatoes should be stored cool, at 12°C or above, and not at refrigerator temperature.

Chilling injury becomes apparent in a variety of ways (Table 14.1) that vary with species and tissue. Visible symptoms are outcomes of physiological disorders, and may develop slowly during the actual chilling period, to be expressed more rapidly once the tissue is returned to warmer, non-chilling conditions.

In defining the physiological basis of chilling injury, loss of membrane integrity emerges as a major symptom and much research has been directed to elucidating the chemical and physical nature of lipoprotein membranes of species having different climatic origins. Dr John Raison and other scientists at the former CSIRO Division of Food Research in Sydney provided evidence that physical changes occur in membranes of chilling-susceptible plants during low-temperature exposure. They suggested that the molecular ordering of membrane lipids is altered in the temperature range where chilling effects become apparent. In particular, lipid composition appears to determine how membranes respond to low temperatures. Tropical species tend to have lipids with a higher proportion of saturated fatty acids (these are fatty acids such as palmitic acid which lack double bonds in their structure and therefore have higher melting points), while cool-climate plants tend to have more unsaturated fatty acids such as oleic acid. However, a consistent pattern of differences in lipid membrane composition between chilling-susceptible and chilling-resistant plants has yet to emerge and additional factors are likely to be involved. The physical nature of cell membranes remains an important point for research into chilling injury, but as yet no single physiological factor has been linked with plant susceptibility to chilling injury.

14.4.2 - Quantifying chilling injury

Fig14.18.png

Figure 14.18. Changes with time in in vivo chlorophyll a fluorescence induction kinetics in response to chilling. In chilling studies, chlorophyll fluorescence has commonly been measured as the rate of rise in fluorescence yield induced by illuminating dark-adapted tissue (the FR value). In isolated chloroplasts, a decrease in photosystem II activity is correlated with a decrease in FR (Smillie and Nott 1979). This figure shows the progressive decline in FR in a trifoliate bean (Phaseolus vulgaris L. cv. Canadian Wonder) leaflet chilled at 0°C in darkness. The first measurement of FR was made after allowing 30 min at 0°C for temperature equilibration of the leaflet. The measurement was repeated on the same area of the leaflet at the times indicated on the figure. The longer the time of` chilling, the greater the degree of chilling injury, and the slower the rate of rise of FR. The greater the chilling sensitivity of a cultivar, the shorter the time taken for a 50% decrease in FR (Original data courtesy R.M. Smillie)

One chilling response is a loss of membrane integrity. This loss has been measured by the extent of electrolyte leakage from cut pieces of chilled tissue. Other physiological methods used to quantify chilling injury include determinations of chlorophyll in seedlings kept at different temperatures, uptake of amino acids into pieces of chilled tissue, comparisons of fruit ripening rates and post-chilling measurements of plant growth and survival.

Pollen development is particularly sensitive to chilling temperatures, and assessments of pollen quality and anther length have been used to select specific genotypes of rice, tomato and other plants showing improved flower fertility under chilling conditions. However, though improved flower resistance to cold conditions is a desirable end-product in its own right, pollen resistance does not appear to be genetically linked with resistance of vegetative tissue to chilling stress.

A particularly versatile physiological method for following chilling stress in photosynthetic tissues makes use of in vivo chlorophyll a fluorescence. When plants become chill injured, fluorescence yield decreases (Figure 14.18) in response to effects of chilling on the photosynthetic system (Smillie and Nott 1979). The time taken for a 50% decrease in fluorescence has been used to compare the relative chilling tolerances of different species and cultivars. Using chilled maize seedlings the extent of the decrease in fluorescence has been positively correlated with physiological and visual symptoms of chilling injury (Hetherington and Öquist 1988).

14.4.3 - Ranges of chilling tolerance

Fig14.19.png

Figure 14.19. Increasing chilling tolerance of wild species of potato and tomato with increasing altitude implies an adaptation to that location. Each point represents a different species of Solanum (●), or variant of Lycopersicum hirsutum (O), originally collected at the altitude indicated in the graph and grown under similar field conditions at sea level. Chilling tolerance determined by the chlorophyll fluorescence method. (Original data courtesy R.M. Smillie)

Plants are commonly reported in scientific literature as being either chilling sensitive or chilling tolerant. This can be a misleading simplification, because in practice when a range of plants are compared for chilling tolerance there is an almost continuous gradient of tolerance between the two extremes (Table 14.2). Tolerance of an individual species is likely to be related to the lowest prevailing temperature in the original habitat of that particular species.

Progressive changes in chilling tolerance have also been documented in closely related plants naturally distributed over latitudinal or altitudinal clines. Growth at high altitudes and also at high latitudes represents a selection pressure for cold tolerance. Wild species of potato restricted to ecological niches within narrow spans of altitude in the Andean mountains of Peru and Ecuador provide a good example of how chilling tolerance changes along an altitudinal cline. Variants of wild tomato (Lycopersicum hirsutum L.) collected in the same regions as the potatoes behaved similarly, with chilling tolerance increasing with altitude (Figure 14.19).

14.4.4 - Chill hardening

Fig14.20.jpg

Figure 14.20. The ability to survive chilling stress is increased in chill-hardened maize seedlings. Unhardened, hardened and dehardened seedlings (see text) were chilled at 1°C for 3 d and then placed at 20/15°C for 3 d to allow symptoms of chilling injury to develop. (Based on Hetherington and Öquist, 1988)

Differences between species imply a genetic basis to variation in chilling tolerance, and this adaptive response includes a further element, namely acclimation. Tolerance shown by individuals of a particular species can be increased by exposing plants to progressively lower but only marginally chilling temperatures. This process is variously called ‘acclimation’, ‘hardening’ or ‘conditioning’. Chill hardening of plants appears to bring about changes in their metabolism, including an increase in unsaturation of membrane lipids, and allows plants to withstand subsequent and more severe stress. Such enhanced tolerance is generally lost within a few days of returning to warmer regimes, a process called ‘dehardening’.

Maize seedlings provide an example of this reversible process (Figure 14.20). Hardening has a dramatic effect on survival of seedlings subsequently exposed to a chilling stress of 1°C for 3 d. Seedlings were first hardened for 4 d in a 15°C day, 5°C night regime. Dehardening was achieved by returning the hardened plants to the original growth regime (20°C day, 15°C for 2 d). Chilling tolerance monitored by chlorophyll fluorescence measurements increased three-fold as a result of this hardening process.

In conclusion, chilling injury can occur in the field and in postharvest storage, especially when crop or horticultural species have been introduced from warmer climates. Produce losses due to chilling injury are frequently overlooked because symptom expression often takes several days to develop after the produce is returned to a non-chilling environment. A combination of better management and introduction of chilling-tolerant genotypes can reduce postharvest losses.

Further Reading:

Hetherington SE, Öquist G (1988) Physiol Plant 72: 241-247

Hetheringon SE, Smillie RM, Hardacre AK, Eagles HA (1983) Using chlorophyll fluorescence in vivo to measure the chilling tolerance of different populations of maize. Aust J Plant Physiol 10: 247-256

Smillie RM, Nott R (1979) Assay of chilling injury in leaves of alpine, temperate and tropical plants. Aust J Plant Physiol 6: 135-141

14.5 - Plant responses to cold

Owen Atkin1,2, Vaughan Hurry3 and Peter Gorsuch1

1Research School of Biology, Australian National University; 2ARC Centre of Excellence in Plant Energy Biology, Australian National University; 3Umeâ Plant Science Centre, Umeâ University, Sweden

Over 95% of the Earth’s surface experiences low temperatures below 5oC each year.  Exposure to cold slows critical metabolic processes of biosynthesis and cellular maintenance, with low temperatures being important in determining the growth, productivity and distribution of plants. Most plants are capable of rapidly responding to cold. These responses can be fast acting, with rapid metabolic changes in existing tissues. The responses can also be longer-term, resulting from the accumulation of information by the plant over days or weeks, leading to developmental changes such as promotion of flowering, breaking of bud dormancy and formation of new leaves that are thicker and display less leaf area per unit leaf mass than their warm-grown counterparts. Biomass allocation is also sensitive to sustained cold, with long-term exposure to cold resulting in plants exhibiting reduced investment in shoots. These diverse responses to temperature demonstrate that a wide range of processes in plants, leading to diverse changes in whole plant metabolism and wide-ranging changes in gene expression and proteome composition, are controlled by thermal perception.  

In following sections, responses of plants to low, non-freezing temperatures are discussed, with the focus being placed on how plants sense and respond to cold. Emphasis is placed on the mechanisms underpinning cold acclimation, defined as modifications of anatomy, physiology and metabolism in response to below optimum temperatures, which minimise irreversible freeze-damage and improves the fitness of the plant. Cold acclimation often results in plants exhibiting greater metabolic capacities than their warm-grown counterparts; as a result, in situ rates of metabolism can be similar in plants experiencing contrasting growth temperatures, when measured at their respective growth temperatures. Importantly, we focus on the recent advances in our understanding of how cold-tolerant plants acclimate to low, non-freezing temperatures. Section 4 of this chapter summarises past work on chilling-sensitive plants (e.g. plants native to tropical and subtropical climates); such plants experience chilling stress at higher temperatures than cold-tolerant species, and while they may be capable of acclimating to low-moderate temperatures, they are rarely capable of developing freezing tolerance.

14.5.1 - Cold sensing and signal transduction

All living organisms perceive and process information from the environment at the cellular level through different kinds of receptors, which transfer the signal inside the cell and activate downstream signalling cascades. For example, in humans, ‘thermoTRP’ proteins are involved in thermosensing and are activated by the cool temperatures (10-23°C) and by compounds that cause a sensation of coolness, such as menthol or eucalyptol. However, to date no cold sensor has been found in any higher plant. Furthermore, it has been shown that cold-responsive gene expression in plants increases in response to gradual decreases in temperature, as well as to sudden shifts to cold temperatures, indicating that plants can sense and respond both to the magnitude and the rate of the temperature change, making it probable that there are multiple mechanisms present to detect and mediate plant thermal responses.  

Fig14.22_0.png

Figure 14.22. Simplified model illustrating cold sensing and the induction of stress gene expression during the early alarm stage of cold hardening in Arabidopsis. ICE1 is a constitutive, nuclear localized, transcription factor that is activated by phosphorylation and controls the expression of a range of secondary transcription factors, such as the CBF family of cold-induced transcription factors, that regulate the expression of the functional, delayed response genes. These delayed response genes, in turn, play important roles in cold acclimation and the acquisition of freezing tolerance in both herbaceous and woody perennial species.

One of the more favoured candidates for sensing low temperature is a change in membrane fluidity (i.e. viscosity of the lipid bilayer of cell membranes). This reflects the fact that the structure and fluidity of lipid membranes is dependent on their composition and temperature. Low temperatures decrease the fluidity of lipid membranes as the hydrogen bonding between adjacent fatty acids is increased. The temperature at which membranes undergo a conversion from a fluid state (that exists at warm-moderate temperatures) to a gel-like state (that exists in membranes at low temperatures) is defined as the ‘transition temperature’ (Tm). Tm values as high as 15–20oC have been reported for some species, with increases in the unsaturated fatty acid content of membranes decreasing the Tm. Below the Tm, the function of membrane-bound enzymes and transport of substrates is often reduced owing to the gel-like state of the membrane.  

The mechanism via which the decreases in membrane fluidity are linked to subsequent downstream responses is still unclear, but it is likely that fluidity-mediated increases in cytosolic concentrations of calcium ([Ca2+]cyt) play a role (Figure 14.22). This is because decreases in fluidity are often associated with a fast, cold-induced increase in [Ca2+]cyt, mainly as a result of Ca2+ transfer across the plasma membrane from the extracellular spaces. Ca2+ is integral to normal cell function and its signalling network is extensive.

Increases in [Ca2+]cyt are thought play a role in the cold acclimation process, with [Ca2+]cyt acting as a secondary messenger. The increase of [Ca2+]cyt results from the activation of calcium channels primarily located in plasma membranes, and it has been suggested that the Ca2+ channels may either directly respond to cold or in some way sense changes in the plasma membrane or the cytoskeleton, triggering the molecular response to the change in temperature. The Ca2+ signal is decoded in plants by calmodulins (Ca2+-binding messenger proteins) and Ca2+-dependent protein kinases (Figure 14.22). Mitogen-associated protein kinase (MAPK) cascades participate in the signalling pathways of an array of abiotic stress responses and act as downstream transducers of the cold stress-induced Ca2+ signal.  Cold Ca2+ signalling is affected by the circadian rhythm and depends partly on cell type and sub-cellular location, potentially allowing specific responses from this generic signal.

While Ca2+ is known to regulate the activity of many signalling components, including phospholipases and protein kinases, and lead to the induction of cold-induced gene expression or repression, many questions remain. For example, the identity of the Ca2+-dependent protein kinases and the genes whose expression they control are generally unknown. Finally, while this represents one of the more intensively investigated options to explain thermal sensing and signal transduction, it is important to note that Ca2+-signalling is not the only sensing mechanism, with Ca2+-signalling often exhibiting extensive cross-talk with other signalling systems, including that of reactive oxygen species (ROS). For example, an increase in [Ca2+]cyt activates mitochondrial external NAD(P)H dehydrogenases, thus lowering the reductive power of the inter-membrane space and potentially reducing ROS formation. Such a combination of signalling networks most likely allows generic stress responses to occur in response to a variety of stimuli, leading to cross tolerance. Finally, Ca2+-signalling events may take place at different locations within the cell (e.g. within the different organelles), will have different physiological causes (e.g. production of ROS in the chloroplast or mitochondria) and, as a result, will occur at different specific times following exposure to a chilling stress event.

14.5.2 - Changes in gene expression underpinning cold acclimation

Once the change to cold temperatures is perceived and the signal transduced to the nucleus, there follows a substantial reprogramming of the transcriptome, proteome and metabolome of the plant cell (i.e. cold acclimation). The cold acclimation response is best understood in herbaceous annuals such as Arabidopsis thaliana where members of the C-repeat binding factor (CBF or DREB1) family of transcriptional activators, which bind the cis-element known as the C-repeat (CRT)/dehydration-responsive element (DRE), have been shown to control the transcription of a suite of genes that play important roles in the development of freezing tolerance. Subsequent to their discovery in Arabidopsis, many CBF homologues have been found in both monocots and dicots, including perennial species such as aspen, birch and Eucalyptus. The CBF/DREB transcription factors are inducible by stress events but are not normally expressed under non-stress conditions. The plants response to stress therefore requires that there are components within the signal transduction pathway that are constitutively present but only active following the perception of the stress signal.  For plant cold responses, a MYC-type bHLH (basic Helix-Loop-Helix) transcription factor, ICE1 (inducer of CBF expression 1), serves as an upstream activator of CBF expression. Transcriptional profiling of the ice1 mutant showed impaired expression of 40% of cold-regulated genes, suggesting ICE1 is one of the main regulators in the cold stress response, but also that it is not the only regulator. ICE1 is constitutively localized to the nucleus and induces CBF expression in a cold-dependent fashion (Figure 14.22). The ability of ICE1 to activate gene transcription in response to cold may be dependent on protein phosphorylation, making ICE1 a likely target of the MAPK cascades activated by the transient increase in [Ca2+]cyt, although the signalling components responsible for this activation are yet to be discovered.

The accumulation of CBF transcripts and the activity of the CRT regulatory motif in Arabidopsis is also modulated by the presence and quality of light during cold stress, and it also appears to be mediated by the circadian gate; with extent to which CBF transcripts accumulate in response to low temperatures being dependent on the time of day plants are exposed to low temperatures. Temperatures are typically at their lowest point in the diurnal cycle at night, and the ability to anticipate this day-night rhythm may give plants the ability to anticipate night frosts and thus confer an adaptive advantage. Entrainment of the circadian clock has been shown to be affected by temperature as well as by light and it appeared that this entrainment might be linked to the regulation of the cold stress response. Plants in temperate regions are also able to anticipate the onset of winter by detecting the shortening photoperiod. This light signalling, or measurement of the critical day-length, is mediated by the phytochromes and it is not surprising that sensing and signalling mechanisms controlling developmental processes such as bud set, seasonal senescence, growth cessation and dormancy overlap with cold acclimation. This potential for overlap is consistent with the observation that cold acclimation can be modified by the red and far-red light (R/FR) ratio.  A decrease in R/FR ratio at the end of the day promotes cold acclimation, including increasing the expression of CBF genes; conversely, exposure to red pulses of light can undo this effect and a high R/FR reduces the accumulation of CBF-regulated gene expression.  Finally, it is clear that there are ICE/CBF-independent pathways that participate in cold acclimation (e.g. expressions of ZAT, HOS and ESK); however, evidence pointing to the identity of the components in these pathways is scarce. Furthermore, in field or natural conditions it is likely that the transcriptomic, proteomic and metabolomic changes in response to alterations in the plants thermal regime will be more complex than those revealed by controlled laboratory experiments. Responses to additional stressors such as light and drought will overlap and will introduce different signalling pathways, particularly those involving ABA, but also brassinosteriods and jasmonic acid. As result, constructing a spatiotemporal network linking these different components in order to understand how these factors come together to limiting plant growth, productivity and distribution, is going to be an enormous challenge.

14.5.3 - Cold-induced changes in membrane characteristics and metabolic profiles

One of the most characteristic changes associated with cold acclimation are decreases in the degree of saturation of membrane fatty acids, leading to greater membrane fluidity and an increase the functionality of membrane-bound substrate transporters and membrane-bound proteins at low temperatures. Moreover, cold-induced modifications in gene expression, subsequent changes in the abundance and activity of proteins, and alterations in other processes such as source-sink relationships and accumulation of metabolic intermediates, collectively lead to increases in the concentration of many metabolites. Thus, sustained exposure to cold leads to major modifications to the metabolome of plants.  Enhanced concentrations of soluble sugars are foremost amongst these, the most studied being the monosaccharides glucose and fructose, the disaccharide sucrose, and the trisaccharide raffinose; levels of each rise within a few hours of the onset of a cold treatment. Starch also accumulates in cold-exposed leaves.  The increase in sucrose is particularly rapid, despite the fact that cold often has strong inhibitory effect on one of the enzymes (sucrose phosphate synthase, SPS) responsible for its synthesis. Levels of sucrose continue to rise during the first few days of cold acclimation, aided by a long-term increase in the abundance and activity of SPS. Moreover, overall sugar levels generally remain elevated in plants exposed to sustained cold; this accumulation reflects shifts in source:sink relationships, underpinned by changes in the balance between carbon uptake by photosynthesis, carbon use by catabolic processes (e.g. respiration) and carbon export to other parts of the plant.  In some plants, increased concentrations of sugars may convey cryoprotective properties, reducing the incidence of membrane lesions and increasing survival during freezing (see Section 14.6). 

Cold treatment also leads to the accumulation of a range of other metabolites, including compatible solutes (i.e. small, highly soluble molecules that are non-toxic at high concentrations). The most studied of these is proline, which accumulates dramatically following cold exposure. Proline appears to act as a cryoprotectant, as evidenced by the fact that freezing tolerant mutants of Arabidopsis accumulate proline to very high levels, even in the absence of a cold stimulus.

14.5.4 - Cold responses of photosynthesis

Cold is known to markedly inhibit rates of photosynthesis, via both its kinetic effects on protein activity and membrane fluidity. Rapid increases in soluble sugars also contribute to an inhibition of photosynthesis through feedback inhibition and down-regulation of nuclear-encoded photosynthetic gene expression. Extended cold-treatment of pre-existing leaves can also result in photodamage; low temperature slows the consumption of ATP and NADPH by the Calvin cycle and the resulting over-reduction of the photosynthetic electron transport chain may cause oxidative damage to the light-harvesting machinery. A further (and important) limitation is the exhaustion of chloroplastic orthophosphate (Pi) required for ATP regeneration and maintenance of the thylakoid membrane proton gradient, which in turn drives the chloroplastic electron transport chain. Calvin cycle turnover also decreases (explaining the observed decline in carbon assimilation) as this relies on ATP to drive the regeneration of ribulose-1,5-bisphosphate (RuBP) reduction.

Recovery of photosynthesis occurs during cold acclimation via an increase in the export of chloroplastic triose phosphates across an antiporter that exchanges these Calvin cycle intermediates for cytosolic Pi. As Pi is produced in the cytosol during sucrose synthesis, the recovery of sucrose metabolism via increases in the abundance and activity of SPS and cytosolic fructose 1,6 bisphosphatase (cFBPase) is an important step in the restoration of photosynthetic function during cold acclimation, and has also been suggested to be partly responsible for the decrease in sensitivity to photoinhibition that occurs following cold acclimation.  Also contributing to the recovery of photosynthesis is the increase in the abundance and activity of several proteins directly involved in photosynthesis.

The photosynthetic phenotype of cold-developed leaves has been suggested to be distinct from that of pre-existing leaves. Cold-developed leaves exhibit marked physical changes compared to warm-grown leaves (Figure 14.23). Leaves developed in the cold tend to be thicker, with a higher leaf mass per area and higher nitrogen and protein concentrations than leaves developed at warmer temperatures.

Fig14.23.jpg

Figure 14.23. (A) Warm-grown (left), 10-day cold-treated (centre) and cold-developed (right) shoot phenotypes of Arabidopsis thaliana.  Warm-grown plants experienced 25/20°C day/night temperatures, whereas cold-treated and cold-developed plants were exposed to constant 5°C. (B) and (C) show transverse sections of representative warm-grown and cold-developed leaves, respectively (Source: Atkin et al. 2006). 

Cold developed leaves can accumulate soluble sugars without the suppression of carbon assimilation typically associated with an abundance of photosynthates, and the transcript and protein abundance of most of the Calvin cycle enzymes have been found to be greatly increased in these leaves. The abundance of ribulose-1,5-bisphosphate carboxylase oxygenase (Rubisco) increases, whereas the other Calvin cycle enzymes tend to decline with cold acclimation relative to Rubisco. Further recovery of sucrose synthesis in cold developed leaves assists in the recovery from cold stress and photoinhibition; SPS transcript abundance, protein and the activity of the enzyme increases relative to the Calvin cycle and starch synthesis during acclimation. Associated with the increase in photosynthetic capacity in cold developed leaves is a change in electron transport capacity relative to carboxylation capacity, and an alleviation of triose phosphate utilization (TPU) limitation. Alleviation of TPU limitation during acclimation to low temperatures has been ascribed to increasing activity and transcription of SPS and cFBPase, and the redistribution of inorganic phosphate between cellular compartments. The net result of these changes is an increase in photosynthetic capacity in newly developed, relative to pre-existing, leaves.  This phenomenon may therefore optimise the function of these new leaves to their environment.

14.5.5 - Increased respiratory capacity in cold acclimated plants

For over a century, it has been known that short-term exposure to cold in measurements lasting minutes to a few hours results in reduced rates of respiratory CO2 release and O2 uptake. When measured over a range of moderate temperatures (e.g. 15-25oC), the relationship between respiration and temperature is near exponential, with respiration exhibiting short-term Q10 values near 2.0 (i.e. respiration increases two-fold for every 10oC increase in temperature). However, when viewed over a wider range of temperatures, the shape of the temperature response tends to be more dynamic, reflecting the fact that the functional form of the short-term temperature response curve of respiration departs significantly from a simple exponential. As a result, short-term Q10 values typically increase with short-term decreases in measuring, commonly reaching values >3.0 at temperatures in the 0-10oC range. Theory and empirical evidence suggests that the increasing temperature-sensitivity of respiration as measurement temperatures decrease is linked to shifts in the control exerted by substrate limitations at moderate-high temperature to maximum enzyme activity at low temperature. This is either because of the inhibitor effect of cold on potential enzyme activity per se (both in soluble and membrane-bound compartments) and/or limitations on the function of enzymes embedded in membranes at temperatures below the Tm. At moderately high temperatures (e.g. 25oC), respiratory flux is less limited by enzymatic capacity because of increases in the Vmax [i.e. maximal flux through the respiratory system as a whole, or parts thereof, in the absence of other limiting factors (e.g. substrate supply and adenylates)] of enzymes in soluble and membrane-bound compartments; here, respiration is likely to be limited by substrate availability and/or adenylates (in particular the ratio of ATP to ADP and the concentration of ADP per se, which are in turn influenced by the demand for respiratory energy by growth and cellular maintenance processes). Increased leakiness of membranes at temperatures above the Tm (particularly at high temperatures) could further contribute to substrate limitations. Changes in growth temperature that last several days can also alter the short-term Q10, with Q10 values also varying seasonally in some ecosystems. 

A further factor that could contribute to variability in the sensitivity of respiration to low temperatures is the extent to which cold differentially suppresses activity by the two terminal pathways via which electrons are transferred to oxygen in the inner mitochondrial membrane [i.e. the phosphorylating cytochrome oxidase pathway (COP) versus the non-phosphorylating alternative oxidase pathway (AOP)]. To date, results from studies with intact tissues and isolated mitochondria from a range of plant species and organs have yielded conflicting conclusions, with some studies suggesting that the AOP might be less sensitive to cold that the COP, while others have reported the opposite or little difference between the temperature sensitivity of the two pathways. Thus, at this stage it is unclear to what extent differential temperature sensitivities of the AOP and COP play a role in influencing variations in the short-term Q10 of plant respiration.

Fig14.24.png

Figure 14.24. Theoretical examples of two types of respiratory thermal acclimation: (a) Type I and (b) Type II. (a) in Type I acclimation, changes in growth temperature result in changes in the Q10 of respiration with no change in the value of respiration at low temperatures (‘B’) (i.e. the intercept remains unchanged). Rather, changes in respiration are only observed at moderate to high temperatures (‘Ac’>’Aw’>’Ah’). Shifting to low growth temperatures for an extended period typically results in an increase in the Q10, whereas the Q10 decreases following shift to high growth temperatures. (b) Type II acclimation results in changes in respiration at both low and high temperatures (i.e. the overall elevation of the temperature response curve is affected). No changes in the Q10 of respiration are necessary for Type II acclimation. Type II acclimation will result in a greater degree of homeostasis of respiration than Type I acclimation. Source: Atkin and Tjoelker (2003)

With sustained exposure to cold, respiratory rates (when measured at a low temperature) start to recover quickly (within hours), and continue to increase as the plant acclimates. Often, the capacity for respiratory enhancement is relatively low in pre-existing tissues; here, acclimation is associated with a change in the rate of respiration primarily at moderate to high measuring temperatures, with little or no change in respiration at low measuring temperatures (i.e. Type I acclimation; Figure 14.24, reflecting a change in the availability of respiratory substrate and/or degree of adenylate restriction of respiration.  Changes in gene expression may also occur, but are not essential for the overall change in respiratory flux. In other cases, acclimation is associated with an increase in the rate of respiration over a wide range of measurement temperatures (‘Type II acclimation’; Figure 14.24). Type II acclimation is likely associated with temperature-mediated changes in respiratory capacity that can be maximally realized through growth of new tissues with altered morphology and biochemistry. Increases in respiratory capacity in the cold appears to be altered as a result of increases in the density of mitochondria mitochondrial number per unit volume of tissue and/or amount of total protein invested in the respiratory chain. The observation that mitochondrial density is higher in in situ alpine than lowland plants further supports the notion that an increase in mitochondrial number is a driving force behind increased respiratory rate in cold-acclimated leaves.  Intermediate cases of acclimation (i.e. between Types I and II) are likely, particularly in individual plants that experience long-term changes in temperature depending on the extent to which respiratory capacity is altered in pre-existing and newly formed leaves and roots.  Another characteristic of acclimation (particularly Type II acclimation) is that it can result in respiratory homeostasis [i.e. identical rates of R in plants grown and measured in contrasting temperatures (Figure 14.24).

Previous work examining the impact of sustained exposure to cold on respiration has suggested that the AOP might play a critical role in the cold acclimation response. In some studies, alternative oxidase transcript abundance, protein abundance, and capacity have all been shown to increase following growth in the cold. In addition, there are examples where in vivo partitioning of electrons to the AOP has been shown to increase following sustained exposure to cold. Such studies have led to the proposal that cold induced increases in AOP activity function to prevent the over-reduction of the mitochondrial electron transport chain, and thus the accumulation of ROS, at low temperatures. However, in reality the response of the AOP to cold may be more complex. For example, in some cases, the recovery of AOP activity in cold acclimated plants is transient (e.g. reaching a maximum after few days of sustained cold treatment), while others have reported that re-establishment of respiratory flux in the cold is associated not with an increase in AOP capacity, but rather with an increase in energy-conserving COP capacity. Such variability in the AOP response suggests that different plant species employ different strategies for coping with cold.  

Finally, consideration should be given to the fact that plant mitochondria possess two additional non-phosphorylating bypasses of the mitochondrial electron transport chain: the alternative NAD(P)H dehydrogenases (NDHs) and the uncoupling proteins (UCPs). Both of these proteins function to reduce the extent to which mitochondrial electron transport is coupled to the production of ATP. The NDHs oxidize matrix and cytosolic NAD(P)H, but do not contribute to proton pumping, while the UCPs facilitate proton flux back through the inner mitochondrial membrane, thereby partially dissipating the proton gradient across this membrane. Both the NDHs and the UCPs are thought to play a role in preventing oxidative stress, with sustained cold treatment increasing transcripts for both types of proteins.  Moreover, there is growing evidence that transcript levels of these alternative respiratory bypasses exhibit coordinated increases in abundance following sustained cold treatments. Collectively, the above suite of modifications in metabolic processes contribute to the ability of many plants to cope with sustained exposure to low temperatures.

14.5.6 - Further Reading

Armstrong AF, Badger MR, Day DA et al. (2008) Dynamic changes in the mitochondrial electron transport chain underpinning cold acclimation of leaf respiration. Plant Cell Env 31: 1156-1169

Atkin OK, Bruhn D, Hurry VM, Tjoelker MG (2005) The hot and the cold: unraveling the variable response of plant respiration to temperature. Funct Plant Biol 32: 87-105

Atkin OK, Tjoelker MG (2003) Thermal acclimation and the dynamic response of plant respiration to temperature. Trends Plant Sci 8: 343-351

Atkin OK, Loveys BR, Atkinson LJ, Pons TL (2006) Phenotypic plasticity and growth temperature: understanding inter-specific variability.  J Exp Bot 57: 267-281

Clifton R, Lister R, Parker KL et al. (2005) Stress-induced co-expression of alternative respiratory chain components in Arabidopsis thaliana. Plant Mol Biol 58: 193-212

Fowler SG, Cook D, Thomashow MF (2005) Low temperature induction of Arabidopsis CBF1, 2, and 3 is gated by the circadian clock. Plant Physiol 137: 961-968

Gorsuch PA, Pandey S, Atkin OK (2010) Temporal heterogeneity of cold acclimation phenotypes in Arabidopsis leaves. Plant Cell Env 33: 244-258

Goulas E, Schubert M, Kieselbach T et al. (2006) The chloroplast lumen and stromal proteomes of Arabidopsis thaliana show differential sensitivity to short- and long-term exposure to low temperature. Plant J 47: 720-734

Hurry V, Strand A, Furbank R, Stitt M (2000) The role of inorganic phosphate in the development of freezing tolerance and the acclimatization of photosynthesis to low temperature is revealed by the pho mutants of Arabidopsis thaliana. Plant J 24, 383-396

Kaplan F, Kopka J, Haskell DW et al. (2004) Exploring the temperature-stress metabolome of Arabidopsis. Plant Physiol 136: 4159-4168

Knight H, Knight MR (2000) Imaging spatial and cellular characteristics of low temperature calcium signature after cold acclimation in Arabidopsis. J Exp Bot 51: 1679-1686

Moller IM (2001) Plant mitochondria and oxidative stress: Electron transport, NADPH turnover, and metabolism of reactive oxygen species. Ann Rev Plant Biol 52: 561-591

McKemy DD, NeuhausserWM, Julius D (2002) Identification of a cold receptor reveals a general role for TRP channels in thermosensation. Nature 416: 52–58

Murata N, Los DA (1997) Membrane fluidity and temperature perception. Plant Physiol 115: 875-879

Penfield S (2008) Temperature perception and signal transduction in plants. New Phytol 179: 615-628

Ruelland E, Vaultier MN, Zachowski A, Hurry V (2009) Cold signalling and cold acclimation in plants. Adv Bot Res, 49: 35-150

Sage RF, Kubien DS (2007) The temperature response of C3 and C4 photosynthesis. Plant Cell Env 30: 1086-1106

Strand A, Hurry V, Gustafsson P, Gardestrom P (1997) Development of  Arabidopsis thaliana  leaves at low temperatures releases the suppression of photosynthesis and photosynthetic gene expression despite the accumulation of soluble carbohydrates. Plant J 12: 605-614

Thomashow MF (1998) Role of cold-responsive genes in plant freezing tolerance. Plant Physiol 118: 1-7

Vanlerberghe GC, McIntosh L (1992) Lower growth temperature increases alternative pathway capacity and alternative oxidase protein in tobacco. Plant Physiol 100: 115-119

Xin Z, Browse J (2000) Cold comfort farm: the acclimation of plants to freezing temperatures. Plant Cell Env 23: 893-902

14.6 - Frost and freezing injury

Fig14.25.png

Figure 14.25. A notional cooling curve for an aqueous solution. As heat is extracted steadily, solution temperature falls below 0 °C, and water molecules, now in an unstable state, supercool to around -5 °C. A nucleating event occurs at temperature TN, and heat is released as ice forms (latent heat of fusion), resulting in a sudden increase in temperature to TF. The extent of freezing-point depression (0 – TN °C) also serves as a measure of osmotic pressure. (Original sketch courtesy M.C. Ball)

EW Hewett, Massey University, New Zealand

Ice melts at 0 °C, and an equilibrium mixture of ice and water has traditionally provided a temperature reference for thermocouples. Ice thawing in pure water will maintain a temperature of 0 °C, but if instead of allowing ice to thaw, heat is extracted steadily from a body of water, then ice does not reform at 0 °C (Figure 14.25). Instead, the water will remain liquid, and will supercool until some nucleation event occurs. A tiny particle of ice, or even vibration in the presence of dust particles, is usually sufficient to trigger ice formation together with an abrupt release of heat (latent heat of fusion). In Figure 14.25, TFTN represents supercooling, and the degree to which TF is less than zero (freezing-point depression) relates to the amount of solute present in solution. Osmotic pressure, vapour-pressure depression and elevation of boiling point are similarly related to the amount of solute present (referred to collectively as colligative properties of solutions).

Highly purified water can be supercooled to about –40 °C, and ice will form spontaneously, but such conditions do not apply in plants because water is not absolutely pure. Instead tissue water is in contact with cell surfaces and invariably holds solutes in solution and colloids in suspension. This aids ice nucleation.

14.6.1 - Physics and physiology

During a frost episode in nature, plants experience a sequence of events similar to that summarised in Figure 14.25. Tissue water supercools, and cell sap freezing point is depressed by osmotically active material. Moreover, plants are also equipped with ice nucleating agents that can be of either plant or bacterial origin (e.g. Pseudomonas syringae). As with solutions, formation of ice in plants is accompanied by a release of heat. This exothermic response can be detected by sensitive infrared thermography, and has been used to trace ice propagation during a freezing event in leaves and shoots (Wisniewski et al. 1997).

When plants experience a frost, ice initially forms within intercellular spaces (apoplasm) where solute concentration is least. Water potential in that region is immediately lowered and water molecules migrate from symplasm to apoplasm across plasmalemma membranes and towards regions of ice crystallisation. Water potential in the apoplasm will decrease by about 1.2 MPa per degree below 0°C, so that an apoplasm at –4°C will have a water potential of around –4.8 MPa (i.e. equivalent to an osmotic pressure twice that of seawater), which will dehydrate the symplasm. As one positive trade-off of the high solute concentration, the symplasm is less likely to freeze. In addition, plasmalemma membranes discourage entry of ice crystals that might otherwise seed ice crystal formation within the symplasm. Nevertheless, partial dehydration does perturb cell biochemistry due to concentration of metabolites, and the accompanying shrinkage of cells and organelles generates structural tensions.

In frost-sensitive material, cell disruption follows the course outlined above, which unfolds over about 3°C on a cooling curve. Membrane integrity might be lost at around –4°C as apoplasm ice formation ruptures membranes. Intracellular freezing ensues at around –7°C and is inevitably lethal due to the combined effects of membrane injury, symplasm dehydration and protein denaturation.

Tissue damage following freezing can be demonstrated by a loss of membrane integrity, metabolite leakage and failure to achieve either plasmolysis or deplasmolysis. Solutions bathing frozen/thawed tissue thus show a sudden increase in electrical conductivity according to freezing damage, and that value then serves as a reliable assay for comparative frost tolerance. For example, population screening based on metabolite leakage has enabled breeding for improved frost tolerance in Eucalyptus nitens for plantation forestry (Raymond et al. 1992).

Leaves on temperate plants often need to accommodate ice formation, and Rhododendron provides such an example. Frozen leaves appear wilted, but regain their normal turgid appearance following thawing. Camellia leaves behave similarly. They take on a semi-transparent appearance when frozen, but recover without damage when thawed. In both cases, their altered physical appearance at low temperature is due to formation of a frostblaze, that is, a lens of ice crystals that forms between layers of tissue that are readily cleaved. Ice localised in this way is rendered harmless, and is lost easily on thawing.

Frost hardiness is a dynamic and composite property of plant cells involving cell size, wall thickness, osmotic pressure of cell sap and membrane properties, all of which can feature in either delaying onset or diminishing adverse consequences of ice formation (Steponkus et al. 1993). In any plant, organs that are growing rapidly are frost sensitive, and this is especially the case with early spring growth. Frost hardiness is thus least during the growing season, but increases during autumn and reaches a peak in winter with acclimation to low temperatures. This is an adaptive feature of perennial plants that is attuned to seasonal necessity. Moreover, the extent of this hardening process is heritable, and requires low temperature for onset and maintenance. Return to milder conditions can lead to dehardening with disastrous consequences for horticulture when an early spring temperature increase is followed by an unseasonal period of cold nights. Frost prevention then becomes crucial for reducing damage to buds, flowers or fruitlets. Susceptibility to low temperatures is dependent on stage of morphological development of plant organs. As spring temperatures increase, fruit develop into buds, flowers then fruitlets with a concomitant increase in susceptibility to cold temperatures. In many fruit trees, buds emerging from dormancy can tolerate temperatures as low as -16 to -17oC, while at full bloom critical temperatures for 10% kill of buds after 30 minutes of exposure -2 to -3oC are -1.5 to 3.0oC. To prevent frost damage, growers generally commence frost protection measures at least 10C above the 10% critical temperature

14.6.2 - Alleviating frost damage in horticulture

Fig14.26.jpg

Figure 14.26 Alleviation of frost damage with wind machines. During a temperature inversion, upper air layers are warmer than the air at tree level, and these huge fans can be used to drive the warmer air down into the trees and across the ground to counter radiative heat loss. A special variant has involved use of helicopters as mobile adjustable fans. Operating costs are much higher and maintaining a low-flying circuit in pre-dawn darkness can be hazardous! (Photograph courtesy E.W. Hewett)

Radiation frosts are common in some horticultural regions of Australasia caused by high radiation losses from earth to sky on still calm nights. The air at ground level becomes chilled by contact with radiating surfaces and drains downslope to low lying areas to form ‘frost pockets’ or ‘frost lakes’ that are commonly 5°C colder than the surrounding countryside. One related outcome, especially on calm mornings, is formation of a temperature inversion. Upper layers of air (30–50 m above ground) remain warmer (5–15°C) than the air at ground and tree level. Under these conditions, static wind machines (Figure 14.26) can be used to drive the warmer air down into the crop and over the soil surface, displacing the cold air and countering radiation heat losses. Given a consistent layer of warm air within reach of these fans, one wind machine every 5–7 ha will protect an orchard against temperatures down to about –3°C. A combination of clean burning oil heaters plus wind machines is even more effective. Helicopters are often used as mobile wind machines that move constantly to zones of low temperatures.

An alternative but remarkably effective method of alleviating frost damage relies upon the latent heat of freezing (see photograph below). Stored irrigation water, either from wells or ponds, is typically around 10°C, and as it cools on irrigated surfaces each gram of water will release about 10 calories of heat. On top of that, the latent heat of fusion adds a further 80 calories. In effect, a thousand litres of water supplies as much heat by this means as complete combustion of 12 L of oil.

The photograph shows both water and ice phases present on trees. While ice is continuing to form, plant tissues so encased will remain at 0°C, just above freezing point for plant tissues. This is above the threshold temperature for frost damage to sensitive buds, blossom and fruitlets. Overhead sprinklers are thus used with good effect to prevent frost damage, but application rate has to be closely controlled. Too little water and plants freeze, too much water and orchards become waterlogged, thereby exchanging one damaging condition for another. Application rates between 3 and 8 mm h–1 will generally suffice to prevent freezing damage to crops at air temperatures down to –6-8°C. Overhead sprinkling is not so effective in strong advective frost conditions, where cold winds cause evaporative cooling, thus reducing sprinkler efficacy.

Fig14.0.jpg

Alleviating frost damage in a New Zealand orchard with overhead sprinklers. Plant tissues encased in ice that is continuing to form will remain at 0 °C, that is, just above the threshold for injury. (Photograph courtesy E.W. Hewett)

References:

Raymond CA, Owen JV, Eldridge KG, Harwood CE (1992) Screening eucalpts for frost tolerance in breeding programs. Can J For Res 22: 1271-1277

Steponkus PI, Uemura M, Webb MS (1993) A contrast of the cryostability of the plasma membrane of winter rye and spring oat: two species that widely differ in their freezing tolerance and plasma membrane lipid composition. Adv Low-Temp Biol 2: 211-312

Wisniewski M, Lindow SE, Ashworth EN (1997) Observations of ice nucleation and propogation in plants using infrared thermograph. Plant Physiol 113: 327-334


Case Study 14.1 - Cold-induced photoinhibition and tree regeneration

Marilyn Ball, Research School of Biology, Australian National University

CS14.1.jpg

Figure 1. Snow gums (Eucalyptus pauciflora) in the Gudgenby Valley (sub-alpine region of southeastern Australia) are subject to frost for about 200 d each year. Exposed juvenile trees have to endure low temperature and the strong sunlight of early morning to survive. (Photograph courtesy C. Holly)

Re-establishment of eucalypts in open pastures of the New South Wales tablelands is problematic, with up to 80% of young trees failing to survive beyond three years. An urgent need for landscape restoration following deforestatation and overgrazing of these areas has become widely recognised, and a successful strategy for tree establishment is crucial to that process.

Photoinhibition of young trees at low temperature was soon recognised as a factor in those early losses (Ball et al. 1991). The first clue that sunlight × temperature was an issue came from two chance observations of unusual patterns in seedling establishment.

The first observation concerns mountain beech (Nothofagus solandri). This is a dominant canopy tree in subalpine forests of New Zealand, and patterns of seedling regeneration around isolated trees on the Waimakariri floodplain are highly characteristic. While 95% of young seedlings occur beneath the canopy of a parent tree, they are not distributed randomly. Rather, they tend to cluster on the western side, and 65% occur in a narrow sector between 165°S and 285°S (Figure 2). Wind effects on seed dispersal are not responsible because prevailing winds blow in the opposite direction; however, seedlings on the south to western sides of parent trees are protected from direct sunlight all day throughout winter, and from morning sun in spring and early summer.

The second observation concerns a similar asymmetric pattern of regenerating seedlings the occurs under isolated trees of snow gum (Eucalyptus pauciflora) growing along the Orroral Valley in southeastern Australia. In this case, tiny seedlings probably establish randomly around a parent tree during favourable seasons, but are subsequently culled by adverse conditions to produce this now familiar pattern of seedling regeneration.

In both cases, the combination of intense cold and strong sunlight seemed to be proving adverse to seedling survival because the asymmetry in seedling establishment roughly coincided with morning shadows cast by parent trees. Chris Holly tested this idea with artifical shelters on Eucalyptus polyanthemos seedlings in an open pasture (Holly et al. 1994). Seedlings were planted either on open ground or in individual shelters consisting of open-topped cylinders made from one of three types of shadecloth transmitting 30%, 50% or 70% sunlight. Air temperatures inside and outside of these shelters differed by less than 2°C so that irradiance was the major factor that differed between treatments. During winter, leaves became photoinhibited as indicated by a loss in variable fluorescence (Fv/Fm from in vivo chlorophyll a fluorescence measured in situ; Section 1.2.5). The extent of this loss in variable fluorescence (measured pre-dawn) was in direct proportion to treatment irradiance. Seedlings grew only slowly during winter, and most severely photoinhibited plants grew the slowest. Correlations between growth and photoinhibition as measured during winter persisted into spring even though pre-dawn Fv/Fm made a substantial recovery in all plants.

CS14.2.png

Figure 2. Relative distribution of seedlings in relation to geographical bearing around adult trees of mountain beech on the Waimakariri floodplain, New Zealand (Original observations courtesy Marilyn Ball (BSBS ANU), Jack Egerton and Matt McGlone (Landcare Research New Zealand))

Spring growth of Eucalyptus polyanthemos appears to be adversely affected by cold-induced photoinhibition over winter. A loss in photosynthetic effectiveness reduces carbon gain during spring, and recovery presumably extends over many weeks, hence a persistence of slower growth despite recovery in Fv/Fm.

In practical terms, establishment of eucalypt seedlings in frost-prone areas benefits from a reduction in irradiance over winter. By analogy, cold-induced photoinhibition could also be responsible for patterns of seedling establishment under parent trees as noted originally.

References

Ball MC, Hodges VC, Laughlin GP (1991) Cold-induced photoinhibition limits regeneration of snow gums at tree line. Funct Ecol 5: 663–668

Holly C, Laughlin GP, Ball MC (1994) Cold-induced photoinhibition and design of shelters for establishment of eucalypts in pasture..Aust J Bot 42: 139–147.


14.7 - High temperature stress

Aidan D Farrell, University of the West Indies, Trinidad

Exposure to excessive temperatures during development limits the yield of many of the world’s major crops, especially in the tropics. Increasing global temperatures over the last three decades have resulted in significantly reduced yields in many crops. In addition to the general warming, a predicted increase in the occurrence of heatwaves is likely to result in further yield losses (Long and Ort 2010). Increasing global temperatures and increasingly frequent heatwaves are likely to have similarly negative effects on natural systems in the tropics and subtropics.

In daylight hours leaf temperatures are often higher than that of the surrounding air, as the canopy absorbs incident solar radiation. Overheating occurs when heat dissipation from the canopy is unable to keep pace with the thermal energy absorbed (for plant energy budget see Section 14.1.3). This typically occurs when incident radiation is high and transpirational cooling is low. Even at temperate latitudes, such conditions often develop at midday when solar radiation peaks and soil water reserves are depleted. In warm, dry environments heat stress can persist for prolonged periods. As heat stress is frequently encountered in combination with water deficit and excess irradiance, it can be difficult to disentangle the effects of the three factors. Nonetheless, there is a distinct set of injuries and plant responses that are associated with heat stress. These are detailed in the following sections.

The effect of heat stress on staple crops like wheat can be severe. The impact varies depending on the developmental stage of the plants, with the most vulnerable stage being flowering. High temperatures shorten the duration of growth of both the leaves and the grains, accelerating their development and thus limiting the ability of the plant to accumulate the carbohydrate necessary for grain growth. In addidtion, heat stress before flowering can cause floret sterility, causing yield losses due to reduced grain number. This effect is most acute when heat occurs at or just after pollen meiosis, when carbohydrate supply to the developing pollen grains appears most critical. Grain size in heat stressed plants can be severely reduced, predominately from a reduction in starch, which makes up  most of the mass of the grain.

Wheat (a temperate C3 species) produces its most grain at temperatures below 26°C; and its yield is reduced at higher temperatures. Yet in most grain-growing areas in the southern hemisphere, and in Meditteranean climates in the northern hemisphere, temperatures increase steadily during the growing season, and brief periods above 30 °C often occur during the grain-filling period. In many arid countries mean day temperatures can easily exceed wheat’s high temperature threshold during much of the growing season and so heat stress can significantly reduce crop yield by accelerating plant senescence, diminishing seed number and final seed weight.

Where vegetation is sparse, maximum daytime temperatures occur at the soil surface where exposed soil absorbs solar radiation and quickly warms above ambient. Under such conditions soil temperatures can exceed 50oC. Exposed soil is a particular problem when planting crops in warm regions where the dark, moist soil surface can reach high temperatures and severely inhibit germination and seedling emergence (http://www.plantstress.com/Articles/heat_i/heat_i.htm). A similar phenomenon has been seen in temperate climates when plastic mulch is used to artificially insulate the soil surface during planting (Farrell and Gilliland 2011).

14.7.1 - Plant response to high temperature

Plants have developed a range of mechanisms to keep tissues from overheating (heat avoidance) or to prevent inhibition and injury where high temperatures occur (heat tolerance). A key aspect of tolerance to heat stress is the degree to which a tissue exposed to moderately high temperatures can acclimate in a way that improves its ability to function at higher temperatures (hardening or acquired thermotolerance).

Table 14.3 shows the optimum, maximum and lethal temperature for a range of processes in wheat and maize. Optimum temperatures for plant metabolism vary between species, reflecting the thermal range found in the environment in which they evolved or were selected (http://www.plantstress.com/Articles/heat_i/heat_i.htm). Metabolic processes in plants typically have an optimum below 30oC and temperatures above 40oC are considered a stress. The degree of damage from heat stress is mediated by the intensity, duration and rate of change in temperature as well as by the plant’s developmental stage and growing conditions prior to exposure (Larkindale et al. 2005; Allakhverdiev et al. 2008; Mittler et al. 2012). For most species, actively growing tissue is damaged by brief exposure to temperatures above 45oC, while prolonged exposure can result in fatal injury. Temperatures between 30-40oC can be termed moderately high temperatures and result in reversible inhibition of metabolism (moderate heat stress). Temperatures above 40oC can be termed very high temperatures as they result in irreversible or prolonged inhibition of metabolism (severe heat stress).

The effect of heat stress is often measured by exposing tissue to high temperatures for a short period (typically 0.5-1 hour) and measuring the response. This can be termed high temperature shock (heat shock). In addition to identifying the maximum threshold temperature above which metabolic activity ceases, heat shock experiments can determine the lethal temperature above which irreversible injury occurs (Table 14.3). Although lethal temperatures rarely occur when plants are grown within their native range, determining the lethal temperature is a useful method for assessing a species tolerance to high temperature in general. Species adapted and/or acclimated to high temperature environments can withstand temperatures well above 40oC. Extreme examples of tolerance to high temperature are found in the desert succulents, such as the prickly pear cacti (Opuntia spp.) which can survive short term exposure to 70oC (Nobel, 1988).

14.7.2 - Heat avoidance

Fig14.27.jpg

Figure 14.27. Thermal images showing midday leaf surface temperature of two savanna sedges, Lagenocarpus guianensis (left) and Lagenocarpus rigidus (right), growing in close proximity at a forest edge. The accompanying photograph indicates the areas used for the thermal images. The white areas in the thermal image represent dead leaves which are above the maximum temperature range. Replicated measurements showed the midday leaf surface temperatures were significantly different (P <0.001) between the two species. The greater potential for ‘canopy temperature depression’ allows L. rigidus to grow in the open savanna, while L. guianensis finds its range restricted to the shaded savanna edges where heat and light are less overbearing  (see John-Bejai et al. 2013 http://aobpla.oxfordjournals.org/content/5/plt051.full).

Plants can avoid overheating by regulating the components of their energy budget. The amount of solar radiation intercepted can be reduced using specialised leaf and canopy arrangements. The vertical leaves and canopy architecture of many eucalyptus trees are arranged to minimise the area of the canopy exposed to direct sun (as a consequence they cast a relatively small shadow). Other species, such as dragon trees (Dracaena spp.) and some acacia trees, adopt an umbrella-like form to raise the canopy above the warm ground and shade the trunk. Some species employ leaf movements, rolling their leaves or changing leaf orientation so that the surfaces are never parallel to the sun. Leaf movements are particularly common in legumes (Fabaceae).

The amount of incident radiation absorbed by a leaf can be reduced by increasing the reflectance of the leaf surface. Leaf hairs and scales scatter the incident radiation such that the leaf appears silvery white, e.g. the sagebrush (Artemisia tridentata) and the brittlebush (Encelia farinosa) common in many arid areas of North America. Pubescence is common in hot, dry environments, where as well as reflecting solar radiation, leaf hairs form a thick boundary layer reducing water loss (although this also reduces the potential for transpirational cooling). Such adaptations are so common among plants of warm arid and high altitude regions that these habitats can be seen to form a ‘silvery landscape’. Waxes deposited on the epidermis perform a similar function, preventing water loss and forming an irregular surface to increase reflectance.

The amount of heat lost can also be regulated by favouring small or divided leaves that reduce the boundary layer allowing for greater convective cooling as well as more effective transpiration. Tropical savanna plants with smaller leaves are better able to keep cool in the full glare of the equatorial sun, while species with larger leaves are restricted to areas shaded by tree canopies (Figure 14.27). Small leaves are also a distinguishing feature of desert shrubs and trees.

An increase in air temperature reduces the relative humidity (increases the vapour pressure deficit), which increases the evaporative demand and the transpiration rate. Where water supply is restricted the stomata will close causing transpiration rate to fall, resulting in an increase in leaf temperature. Where water supply is not limiting, transpirational cooling is an effective form of heat avoidance. Transpirational cooling often reduces leaf temperatures to 5oC below ambient, while temperatures can be reduced by 15oC in extreme cases. This contrasts with plants growing in arid conditions where leaf temperatures may be 15oC or more above ambient. In agricultural environments, where high temperatures are not necessarily combined with water deficit, cultivars showing high stomatal conductance have been shown to be more resistant to heat stress. In fact, stomatal conductance measurements along with direct measurements of ‘canopy temperature depression’ are among the most valuable parameters for selecting cultivars for growth in warm environments. The recent application of infrared thermometers to examine canopy temperatures has provided a valuable method for directly measuring heat avoidance (Figure 14.27); http://www.plantstress.com/Articles/heat_m/heat_m.htm; http://www.plantstress.com/methods/IRT_protocol.htm).

14.7.3 - Heat injury and inhibition

Heat stress affects plants through three principle mechanisms: excessive membrane fluidity; disruption of protein function and turnover; and metabolic imbalances. Metabolic imbalances can be due to differences in the activation energy of the component reactions, or to the effect of the other two mechanisms on the thermal response of each reaction.  The inhibition of metabolism from these three mechanisms also results in the accumulation of toxic compounds and reactive oxygen species (ROS), the removal of which is also inhibited by heat stress.

(a) Whole plant effects

Generally, inhibition of photosynthesis is seen as a critical factor in heat stress. Net photosynthesis is typically the first process to be inhibited at high temperatures (Berry and Bjorkman 1980; Allakhverdiev et al. 2008). As temperature rises above optimum, gross photosynthesis is inhibited while respiration and photorespiration increase. The combined effect of these three processes is a marked reduction in net photosynthesis during moderate heat stress (Figure 14.12).

C4 plants do not suffer from the increase in photorespiration and so can maintain a higher photosynthetic optimum; however, the maximum temperature does not vary to the same extent. The imbalance between photosynthesis and respiration is itself damaging, as carbohydrate reserves can become depleted. As temperature rises further, membrane transport and respiration become inhibited, eventually leading to cell death. Both the light reactions and the Calvin cycle are highly sensitive to moderate heat stress. Injury following severe heat stress is perhaps most acute for the light reactions, with even brief exposure resulting in long-term inhibition of photosystem II (PSII). As the activity of PSII is highly temperature sensitive it can be used as an indicator of heat stress and heat injury; measurements of chlorophyll fluorescence have been widely used for this purpose (http://prometheuswiki.publish.csiro.au/tiki-index.php?page=Chlorophyll+fluorescence).

For many years, the inhibition of gross photosynthesis was thought to occur at temperatures too low to be explained by the thermal deactivation of photosynthetic enzymes. Experiments comparing the thermal response of many steps in the photosynthetic apparatus, suggested the initial inhibition was due to the sensitivity of the thylakoid membrane to high temperatures (Berry and Bjorkman 1980). However, this view has been questioned recently with the observation that at moderately high temperatures photosynthetic inhibition coincides with a reversible reduction in the activity of certain Calvin cycle enzymes (Sharkey 2005). Severe heat stress is still thought to be due to injury of PSII, through direct cleavage of the D1 protein and a range of other mechanisms. Although the thermal sensitivity of PSII is not solely due to the thermal sensitivity of cell membranes, membrane properties are a major regulator of both inhibition and injury of PSII (Sharkey 2005; Allakhverdiev et al. 2008).

The thermal sensitivity of reproductive processes can be a limiting factor for plant productivity and it is often the critical factor for crop production in areas prone to heat stress (Table 14.3; http://www.plantstress.com/Articles/heat_i/heat_i.htm). Heat stress can reduce the duration of reproductive development and severely inhibits floral development, fertilization and post fertilization processes in many species. Pollen viability is particularly vulnerable to heat damage. Severe heat stress inhibits both the photosynthetic source and the reproductive sink, resulting in a significant reduction in the number and size of seeds and/or fruit. This is a particular problem in fruit and grain crops such as tomato, cowpea, wheat, and maize (http://www.plantstress.com/Articles/heat_i/heat_i.htm).

At high temperatures dry matter production is often more limited by photosynthesis than by cell expansion (while at low temperatures dry matter production is more limited by cell expansion than by photosynthesis). Generally, the inhibition of photosynthesis and other growth maintaining processes during moderate or short-term heat stress results in a comparatively small reduction in the rate of dry matter production (relative growth rate) (Chapter 6.2.2; http://www.plantstress.com/Articles/heat_i/heat_i.htm). As temperature increases within a plant’s thermal range, the duration of growth decreases but the rate of growth increases, as shown earlier in this chapter. As a consequence, organ size at maturity may change very little in response to temperature, despite variation in growth rate. As temperatures are raised further, an increased rate of growth is no longer able to compensate for a reduction in the duration of development, and the final mass of any given organ at maturity is reduced. This response can be seen in a range of tissues including leaves, stems and fruit. A smaller organ size at maturity due to high temperature is associated with smaller cells rather than a change in cell number. This implies that cell enlargement is more sensitive to temperature than is cell division. The reduced duration of development can also limit the number of organs that are produced, e.g. grain number in wheat is reduced when plants are grown at moderately high temperatures (Stone and Nicolas 1994). Under certain conditions plants grown under moderate heat stress accumulate sugars in their leaves, indicating that translocation can be more limiting than photosynthesis, but this is not thought to be a general limitation.

(b) Membrane properties

The structure and fluidity of lipid membranes is dependent on their composition and on temperature. An increase in temperature will result in an increase in the fluidity of lipid membranes as the hydrogen bonding between adjacent fatty acids become weak. This increase in fluidity is associated with an uncontrolled increase in membrane permeability as the activity of membrane bound proteins is disrupted. Indeed, this uncontrolled membrane permeability is used as an assay to test for damage due to heat stress (http://www.plantstress.com/Methods/CMS_method.htm).

Membrane-associated processes, such as photosynthesis and membrane transport, are typically the first to be inhibited during exposure to high temperature (Berry and Bjorkman 1980; Allakhverdiev et al. 2008). The high temperature sensitivity of PSII is thought to be due, at least in part, to its close association with the thylakoid membrane. In addition to these direct effects on metabolic function the changes in membrane fluidity during heat stress act as a signal to initiate other stress responses in the cell (Mittler et al. 2012).

(c) Protein function and turnover

For most metabolic reactions, the optimum and maximum temperatures are determined by the thermal response of key enzymes. Enzymes act to lower the activation energy and increase the rate of reactions at any given temperature. However, as temperature increases the catalytic properties of most enzymes are lost and they begin to denature (i.e. enzymes are thermolabile). The synthesis of replacement enzymes and other cell proteins is also impaired, resulting in an overall limitation due to reduced protein turnover. Under prolonged severe heat stress many enzymes will become denatured. This, combined with the loss of membrane function will result in cell death.

For some reactions, the thermal response of a particular enzyme can be rate limiting. The inhibition of photosynthesis during moderate heat stress has been associated with a reduction in the catalytic activity of Rubisco (Ribulose 1:5 bisphosphate carboxylase/oxygenase), due in part to the thermal sensitivity of Rubisco activase. In some species, production of heat stable forms of Rubisco activase has been shown to play role in acclimation to high temperature (Yamori et al. 2013). There have been attempts to engineer less temperature sensitive forms of Rubisco activase in order to increase the thermal range of crop species, but it remains to be seen if altering a single component of the photosynthetic system will improve overall heat tolerance (Sharkey 2005; Allakhverdiev et al. 2008).

(d) Metabolic imbalances

When a plant is grown outside of its optimum thermal range, metabolic imbalances occur. Imbalances may result in a short-fall of essential metabolites or intermediaries, or in a build-up of substances that becomes toxic (e.g. aggregated proteins). Such imbalances cause further inhibition of processes such as photosynthesis and respiration. The imbalances can be due to differences in the thermal response of particular reactions. For instance, the enzymes used in photosynthesis are deactivated at a lower temperature than those used in respiration. This has the result that as temperatures increase, the rate of carbon fixation falls while the rate of carbon use may rise. The point at which the plant is using more carbon than it is assimilating is termed the ‘temperature compensation point’. Beyond the temperature compensation point, the plant begins to use up carbohydrate reserves, e.g. in many legumes the net uptake of CO2 by the green pod is low due to the high rate of pod and seed respiration, at high temperatures net uptake can become negative. As plants acclimate to high temperatures the rate of respiration falls lessening the impact on net photosynthesis.

Imbalances can also occur due to the effect of temperature on physical processes, e.g. as temperature rises, the solubility of oxygen increases more than that of carbon dioxide, so oxygen becomes more concentrated in the cell solution compared to carbon dioxide. This imbalance contributes to the increase in the oxygenation of RuBP at high temperatures (i.e. an increased rate of photorespiration).

The high temperature sensitivity of reproductive development can be viewed as an imbalance. Detailed studies have found that the yield of certain cowpea varieties was limited at high temperatures due to reduced seed set. This limitation was mitigated by increasing sink demand through breeding with more heat tolerant varieties. The fact that seed set can be limited by the demand for assimilates at high temperature shows that the thermal sensitivity of the reproductive sink can be out of balance with than that of the photosynthetic source (http://www.plantstress.com/Articles/heat_m/heat_m.htm). A similar sink restriction is found in cereals grown at high temperatures, where grain development is restricted by its ability to convert the available assimilates into starch (Stone and Nicolas 1994).

14.7.4 - Heat tolerance

Where overheating cannot be avoided, plants have developed a range of mechanisms to tolerate high temperatures and to resist the stresses outlined above. Many of these mechanisms have been harnessed by plant breeders to develop more heat resistant crops (for review see: http://www.plantstress.com/Articles/heat_m/heat_m.htm). Each species has a different capacity to respond to heat stress. The degree of heat tolerance tends to follow the species’ native thermal range, with plants irreversibly damaged by temperatures between 30-40 oC termed ‘heat sensitive’ and those only damaged above 40 oC designated as ‘heat resistant’. A key aspect of tolerance to heat stress is the ability to acclimate and the mechanisms described below are typically up-regulated when plants are exposed to moderate heat stress (Figure 14.28).

Fig14.28.png

Figure 14.28. In heat tolerant plants, growth at warm temperatures results in acclimation of photosynthesis. Adjustments in membrane composition, protein synthesis, and metabolic regulation alleviate some of the effects of high temperature. Acclimation is mediated, in part, by an increase in expression of heat shock proteins. Based on Sage and Kubien (2007) and Yamori et al. (2014).

(a) Membrane state, structure and composition

In order to tolerate high temperatures, plants must maintain membrane fluidity within a biologically functional range (membrane thermostability). The degree to which membrane fluidity increases with temperature is dependent on membrane composition. Lipids that have unsaturated fatty acid chains, short fatty acid chains or a low sterol content generally form membranes that are more fluid and less stable at high temperatures. The sensitivity of membranes to heat stress can be reduced by increasing the proportion of saturated lipids or by altering the composition of specific lipids. Early work by Jim Lyons and John Raison at the CSIRO Division of Food Research highlighted the fact that tropical species tend to have a higher proportion of saturated lipids than temperate species, but found that the full role of lipid composition in regulating membrane fluidity was complex. Changes in lipid composition during acclimation to high temperature, including increases in the proportion of saturated lipids, have been described in cyanobacteria (Los and Murata 2004) and a number of plants from both warm and cool regions (Raison et al. 1982; Larkindale and Huang 2004). Some of the changes in the physical properties of membranes are regulated by the activity of heat shock proteins (see below), but others are not (Sharkey 2005).

Alteration of lipid composition through gene manipulation has been shown to increase heat tolerance in Arabidopsis, soybean and tobacco (Alfonso et al. 2001; Murakami et al. 2000). Murakami et al. (2000) produced transgenic tobacco plants with a reduced proportion of trienoic fatty acids (unsaturated lipids with three cis double bonds) in the chloroplast membranes. Exposure of the plants to 45oC for 5 minutes reduced photosynthesis by 50 % in the wildtype while the transgenic plants were unaffected (all plants showed complete inhibition of photosynthesis after exposure to 50oC for 5 minutes).

(b) Heat shock proteins

Within minutes of temperature rising above the optimum, the expression of most genes used for general metabolism is inhibited, however, a sub-set of specialised stress response genes are actively up-regulated. The best characterised of these genes are a multi-family group known as heat shock proteins (HSP). HSP occur in all organisms. In plants, they show differential expression in many tissues and many cell compartments. HSP utilise a novel transcription factor to respond directly to heat, and their levels have been shown to rise along with temperature until the lethal threshold temperature is reached. On exposure to high temperature HSP expression typically peaks after 1-2 hours and diminishes after 6-8 hours, after which the cell environment is modified enough for the transcription and translation of other genes to resume (Larkindale et al. 2005; Allakhverdiev et al. 2008).

Many HSP are thought to act as chaperone proteins, protecting other proteins from denaturation by reducing misfolding, unfolding, and aggregation. Chaperone activity also helps maintain the translocation of proteins across cell membranes. The up-regulation of HSP has been shown to improve tolerance to and recover from heat stress in several systems, e.g. addition of purified HSP of isolated tomato chloroplasts significantly improved their heat tolerance by protecting PSII electron transport (Allakhverdiev et al. 2008). This chaperone role can offer protection from stresses aside from heat, and HSP have been shown to be up-regulated by a variety of stresses that escalate protein denaturation. Larkindale et al. (2005), describe five classes of HSP the names indicating the molecular weight:

  • HSP60 and HSP70 have been shown to act as chaperone proteins in plants and other organisms, and some also function to stabilise membranes preventing the loss of permeability.
  • HSP90 are less well characterised in plants, they are thought to interact with signal transduction proteins that form part to the overall heat stress response.
  • HSP100 act as chaperone proteins in conjunction with HSP60 and HSP70 and may perform other roles. Plants lacking HSP 100 can grow normal at optimum temperatures but are unable to acclimate during heat stress.
  • Small HSP are particularly important in plants but are less well characterised than HSP60 and HSP70. Small HSP are a diverse group including several gene families that are targeted to different cellular compartments, including the cytosol, chloroplast and mitochondria. The function of many of the Small HSP is still unknown. Some may be involved in chaperone protein activity and some are involved in maintaining membrane stability including the protection of membranes essential for the functioning of PSII.

Certain HSP also act to clean up the cell, removing denatured proteins by increasing the proteolysis activity of ubiquitin.  The removal of potentially toxic protein aggregations is thought to be a key part of acclimation to heat stress. Indeed, heat stress also stimulates the up-regulation of ubiquitin itself (Larkindale et al. 2005).

(c) Reactive Oxygen Species (ROS)

The impairment of metabolic function during heat stress results in increased production of ROS, which in turn causes secondary damage to proteins and membranes. Accumulation of ROS during heat stress has been associated with both the light reactions and the Calvin cycle reactions. The reaction centre of PSII is particularly vulnerable, producing superoxide radicals, hydroxyl radicals and hydrogen peroxide under heat stress. Antioxidant enzymes and non-enzyme systems serve to limit the formation of the most damaging ROS, such as singlet oxygen, and to detoxify the cells through ROS-scavenging. Although some antioxidant systems are impaired at high temperatures, others are up-regulated and can be considered part of the heat stress response (Sharkey 2005; Larkindale et al. 2005; Allakhverdiev et al. 2008).

(d) Heat stress response: other mechanisms

Although HSP form a critical part of the heat stress response, they still account for a small minority of the transcripts that are up-regulated during heat acclimation. Several groups are currently working to elucidate the role of other changes in the transcriptome, proteome, metabolome and lipidome in regulating signal transduction and response to heat stress (for review see Mittler et al. 2012). Among the metabolites associated with heat acclimation perhaps the best characterised are the compatible solutes (which also play a crucial role during water stress and salinity stress (see Chapter 17). In the case of heat stress, their primary role is thought to be similar to that of the chaperone proteins, i.e. the protection of protein and membrane function (Larkindale et al. 2005; Allakhverdiev et al. 2008). There is also increasing interest in the role of isoprene in heat tolerance. Isoprene is a small hydrocarbon sometimes released from plants in large quantities. It is particularly associated with certain tree species, such as eucalyptus. Indeed, it is isoprene that is responsible for the distinctive blue haze that characterises Australia’s ‘blue mountains’. Although the full purpose of isoprene has not been established, there is good evidence that it is involved in the development of heat tolerance. In particular, the production of isoprene has been shown to reduce the inhibition of photosynthesis during moderate heat stress, perhaps by associating with the thylakoid membrane to increase hydrophobic interactions and protect membrane function (Sharkey 2005).

14.7.5 References

References:

Alfonso M, Yruela I, Almarcegui S et al. (2001) Unusual tolerance to high temperatures in a new herbicide-resistant D1 mutant from Glycine max (L.) Merr. cell cultures deficient in fatty acid desaturation. Planta 212: 573-582

Allakhverdiev SI, Kreslavski VD, Klimov VV et al. (2008) Heat stress: An overview of molecular responses in photosynthesis. Photosyn Res 98: 541-550

Berry J, Bjorkman O (1980) Photosynthetic response and adaptation to temperature in higher plants. Annu Rev Plant Physiol 31: 491-543

Bewley JD, Black M, Halmer P (2006) The encyclopedia of seeds: Science, technology and uses: CABI Publishing.

Farrell AD, Gilliland TJ (2011) Yield and quality of forage maize grown under marginal climatic conditions in Northern Ireland. Grass Forage Sci 66: 214-223

John-Bejai C, Farrell AD, Cooper FM, Oatham M (2013) Contrasting physiological responses to excess heat and irradiance in two tropical savanna sedges. AoB PLANTS 5: doi:10.1093/aobpla/plt051

Larcher W (2003) Physiological Plant Ecology: Ecophysiology and stress physiology of functional groups. Springer Verlag

Larkindale J, Mishkind M, Vierling E (2005) Plant responses to high temperature. In: Plant Abiotic Stress. Ed MA Jenks, PM Hasegawa, pp. 100-144. DOI:10.1002/9780470988503.ch5

Long SP, Ort DR (2010) More than taking the heat: Crops and global change. Curr Opin Plant Biol 13: 240-247

Mittler R, Finka A, Goloubinoff P (2012) How do plants feel the heat? Trends Biochem Sci 37: 118-125

Murakami Y, Tsuyama M, Kobayashi Y et al. (2000) Trienoic fatty acids and plant tolerance of high temperature. Science 287: 476-479

Nobel PS (1988).Principles underlying the prediction of temperature in plants, with special reference to desert succulents. In: Plants and Temperature, 42, 1-23. Ed, SP Long, FI Woodward. Symposia Soc Exp Biol

Porter JR, Gawith M (1999) Temperatures and the growth and development of wheat: A review. Eur J Agron 10: 23-36

Raison JK, Roberts JKM, Berry JA (1982) Correlations between the thermal stability of chloroplast (thylakoid) membranes and the composition and fluidity of their polar lipids upon acclimation of Nerium oleander to growth temperature. Biochim Biophys Acta (Biomem) 688: 218-228

Sage, RF, Kubien SD (2007) The temperature response of C3 and C4 photosynthesis. Plant Cell Env 30: 1086-1106

Sharkey TD (2005) Effects of moderate heat stress on photosynthesis: importance of thylakoid  eactions, rubisco deactivation, reactive oxygen species, and thermotolerance provided by isoprene. Plant Cell Environ 28: 269-277

Stone PJ, Nicolas ME  (1994) Wheat cultivars vary widely in their responses of grain yield and quality to short periods of post-anthesis heat stress. Aust J Plant Physiol 21:887-900

Yamori W, Hikosaka K, Way DA (2014) Temperature response of photosynthesis in C3, C4, and CAM plants: temperature acclimation and temperature adaptation. Photosyn Res 119: 101-117 doi: 10.1007/s11120-013-9874-6

Further reading

Hall AE. Heat stress and its impact. In: Plant Stress. Ed A Blum. http://www.plantstress.com/Articles/heat_i/heat_i.htm

Hall AE. The mitigation of heat stress. In: Plant Stress. Ed A Blum. http://www.plantstress.com/Articles/heat_m/heat_m.htm


14.8 - Concluding remarks

Integration of responses to temperature and other environmental factors

Considerable effort has gone into modelling relations between thermal environment and plant responses with a number of specific aims, namely to predict the likelihood of success of extending a particular crop into new regions, to predict phenology in a particular season and ensure the most effective application of fertiliser and agricultural chemicals, or to gain a better understanding of the basic processes that limit yield.

These models will often include data on maximum and minimum temperatures, solar radiation, photoperiod, rainfall, evaporative demand, soil water-holding capacity and nutrition. Temperature is thus one of several environmental factors that may influence plant growth and development and it is important to recognise the potential interaction between temperature and these other factors.

Light has an important role in regulating the effect of low temperature on the chlorophyll status of leaves of chilling-sensitive species and therefore on photosynthesis and growth. Interactions between temperature and light are complex and influence early stages of seedling establishment through to shoot number (branching), leaf shape and canopy development. In any crop, not all plant organs are at the same temperature, while direction, level and duration of incident radiation are also varying constantly. The combination of light and temperature vary from one location to another and although in a Mediterranean climate rising temperatures are often associated with increasing light, in the monsoonal regions of the tropics the high summer temperatures can be associated with high cloud cover and low light.

Temperature is also an important factor in plant water use. Low temperature can restrict the uptake of water by roots in some species, while high temperature, by lowering the relative humidity of the air (which increases the vapour pressure deficit), will increase the evaporative demand of the air and increase the rate of transpiration through the leaves. The latter will result in more rapid use of soil water and increase the possibility of drought. One of the main difficulties in assessing the interaction between temperature and water stress is because temperature influences both water use and the rate of plant development in parallel.

Uptake of mineral nutrients and their redistribution from one organ to another within plants are influenced by both nutrient availability and temperature. The optimum temperature for nutrient uptake varies between species and also from one mineral element to another. The importance of nutrition in relation to temperature then depends on whether the uptake and redistribution of nutrients can keep pace with the increased growth rates that are observed, for example, with increasing temperature. This would appear to be the case for phosphorus in wheat (even when the supply of phosphorus is low) where increasing temperature results in an increased concentration of leaf phosphorus, an increase that is also expressed in the grains at maturity. Thus in this example any deleterious effect of high temperature on yield would not appear to be mediated through plant phosphorus.

Summary

Vascular plants have come to occupy virtually every stable niche on earth during the course of their evolutionary history, regardless of thermal regime, and with remarkable adaptive capacity to acclimate to heat and cold. Plants may not necessarily thrive under extreme conditions, but they can survive, and are able to achieve a positive carbon balance and complete their life cycles due to physiological mechanisms and morphological features that lend thermal resilience.

Temperature extremes, especially in combination with other environmental stresses, impose an intense selection pressure. Cycles of vegetative growth and reproductive development have become closely attuned to such conditions, especially where growing seasons are brief and dormancy protracted. Such genotypes thus become highly specialised in their thermal responses.

Under more moderate conditions, survival mechanisms are of less importance and temperature assumes a different role in shaping genotypes by setting the biological tempo of ecosystems. Growth rate and reproductive effectiveness then become paramount, and again a genotype × environment interaction is apparent in the direction of biological responses due to temperature effects on carbon gain and reproductive development. An appreciation of processes underlying such responses lends a new dimension to our appreciation of natural ecosystems and our management options for communities of cultivated plants.