14.3 - Responses of enzymes, photosynthesis and assimilate transport

Enzyme activity is very responsive to temperature, as is enzyme synthesis, activation and stability. However the response of plant growth to temperature is the result of a number of complex processes involving many enzyme systems, and most likely governed by the response of the enzymes involved in CO2 fixation. The different temperature responses of C3 versus C4 photosynthesis are described next, along with temperature effects on assimilate transport and on the basic concepts of enzyme activity including the Q10: the increase in rate of respiration for a 10°C rise in temperature.

14.3.1 - Photosynthesis

Fig14.12.png

Figure 14.12. Plant species show characteristic variation in the way photosynthetic tissue responds to temperature. Maize (a subtropical C4 species) has a high maximum rate of CO2 assimilation with a high optimum temperature, while wheat (a temperate C3 species) has a lower maximum rate and a lower optimum temperature. (a) Absolute values; (b) shows those same data normalised to 100% at optimum temperature. Alpine plants (C3 species) have an even lower optimum temperature and may show CO2 assimilation below 0 °C, but their maximum rates of photosynthesis are often low compared with warmer climate species. Based on I F Wardlaw (1979).

CO2 assimilation underpins plant productivity and is therefore central to any analysis of the response of plants to a change in temperature. In photosynthetic terms, plants can be divided broadly into the groups discussed earlier.

Some C3 species such as snow tussocks have an optimum temperature for CO2 assimilation as low as 5°C, but it is important to note that absolute rates at this temperature may be relatively low (Figure 14.12). Most temperate grasses and cereals as well as many woody species have temperature optima in the range from 15°C to 25°C and within this range many C3 species show only small changes in CO2 uptake. In contrast to temperate C3 species, CO2 assimilation by C4 species increases considerably with a rise in temperature from 15°C to 30°C and optimum temperatures may be greater than this (Figure 14.12). Rice, a subtropical C3 species, has a higher temperature optimum for CO2 assimilation than temperate C3 species. Under high light, C4 species have a characteristically greater photosynthetic rate than the C3 species, but these differences disappear and may be reversed at low temperature. Growth temperatures may also influence the optimum temperature for net photosynthesis, which may therefore vary with season or location. However, modifications leading to an improvement in photosynthesis at high temperatures can result in decreased performance at low temperatures and vice versa.

A combination of at least two factors may be associated with the failure of C3 species to respond more favourably to high temperature in terms of CO2 assimilation. One is the limit placed on photosynthesis by ambient CO2 (Figure 14.13), and a second is the concurrent rise with increasing temperature of light-stimulated photorespiration, which is effectively absent from C4 species. Increased atmospheric CO2 inhibits photo-respiration and results in a much greater uptake of CO2 in response to increased temperature in C3 species.

Fig14.13.png

Figure 14.13. Maize (a subtropical C4 species) has a high optimum temperature (~30 °C) for CO2 assimilation, while barley (a temperate C3 species) has a lower, but less distinct optimum (~15 °C). Doubling CO2 has little effect on CO2 assimilation rate by maize (not shown here), but greatly increases the absolute rate and optimum temperature for barley by suppressing photorespiration. This O2-dependent loss of carbon increases with temperature and is largely responsible for the low optimum temperature of photosynthesis in many C3 species. Based on Labate, Adcock and Leegood (1990) Planta 188, 547-544.

While net photosynthesis is the resulting balance between gross photosynthesis and respiration, low or even negative net photosynthetic rates can have a significant effect on productivity. An example of this would be photosynthesis by the green pod of many legumes where the net uptake of CO2 is low because of a high rate of pod and seed respiration. A rise in temperature will result in greater respiratory losses from the pod and a reduction in net uptake of CO2, but this does not diminish the importance of pod photosynthesis.

Variation in stomatal resistance could be another factor associated with temperature effects on net assimilation of CO2. Adaptation to high temperature can be related to photosystem II electron transfer, the stability of chloroplast membrane-bound enzyme activities and the stability of the photosynthetic carbon metabolism enzymes that require light for activation. For example, enhanced assimilation of CO2 by rice at high temperature, in comparison with the more temperate C3 species, is associated with a greater response of ribulose-1,5-bisphosphate carboxylase in rice to increasing temperature.

In chilling-sensitive species such as maize, sorghum and mung bean, chlorophyll formation and chlorophyll destruction both occur in light at low temperatures. However, once greening has occurred quite low temperatures (but not usually freezing) can be tolerated as long as these occur during darkness. Low-temperature tolerance is also associated with a high level of strategic enzymes such as Rubisco, protein stability and membrane lipid composition.

Consideration must also be given to possible indirect effects of temperature on photosynthesis. For example, a change in root growth due to a change in temperature could alter the supply of nutrients or growth regulators, such as cytokinins, to the shoots. It is common to find a build up of non-structural carbohydrates in many parts of a plant under low-temperature conditions, a response indicating that growth is more sensitive to low temperature than photosynthesis. However, feedback inhibition of photosynthesis associated with this excess carbohydrate accumulation under low-temperature conditions occurs in a number of species. In summary, it is important to take into account the possibility of indirect effects of temperature on photosynthetic tissue when looking for genetic differences in photosynthetic responses to temperature.

14.3.2 - Assimilate transport

There are three components of nutrient and photosynthate transfer in plants that might respond to temperature in different ways: (1) transfer of metabolites across cell membranes, including the exchange between apoplasm (space external to cell membranes) and the symplasm (space contained by cell membranes); (2) cell to cell transfer (within the symplasm) via plasmodesmal connections, and (3) movement of metabolites over long distances through phloem sieve elements.

Selective transfer of metabolites across a membrane against a concentration gradient is an energy-requiring step involving respiratory activity and membrane-bound ATPase (see Figure 1 in Case study 2.1). This metabolically active process is responsive to temperature. Membrane transfer is associated with many physiological functions including movement of metabolites and photoassimilate loading within source leaves, exchange with storage tissues along the path of transport and photoassimilate loading into sinks. The response of long-distance photoassimilate translocation to low temperature varies widely between species. In many temperate Gramineae (including wheat) a drop in temperature along the path of transport to 1°C has no measurable effect on the translocation of photosynthate, but at this temperature in chilling-sensitive species such as bean and sorghum there is a marked reduction in the translocation of photosynthate. In some chilling-tolerant species such as sugar beet, there is an initial rapid decline in translocation following application of low temperature along the path of transport, but this inhibition is transient in nature, with translocation returning to normal in a number of hours. In species that are more sensitive to chilling such as squash there is some adjustment to low temperature, resulting in partial recovery. Such adjust-ments vary between ecotypes within the one species, for example in Canada thistle where behaviour is related to altitude and thus temperature in natural surroundings (Figure 14.14). Lowering the temperature of the transport pathway also reduces the lateral transfer of carbon into adjacent tissues, or alternatively the remobilisation of stored carbohydrate back into the transport system. By contrast, translocation can be relatively insensitive to temperatures up to 40°C, but will be inhibited by prolonged periods of temperature >40°C. Prolonging a high-temperature treatment, unlike the low end of the scale, does not result in recovery; rather, blockage intensifies.

Fig14.14.png

Figure 14.14. Effects of low temperature on translocation of photoassimilate through phloem has frequently been measured by changing pathway temperature between a source and a sink and following variation in the rate of movement of radioactively labelled photosynthate. (a) Translocation in some species such as wheat is especially tolerant of low temperature, but greatly reduced in others such as bean. Again, in other species such as Nymphoides and sugar beet there is an initial retardation of translocation immediately after a low-temperature block is imposed, but translocation subsequently improves even though the low-temperature is retained. (b) Canada thistle has both attributes with the northern (colder) ecotype showing rapid recovery of translocation at low temperature and the southern (warmer) ecotype showing very little recovery over the first 3 h. Based on I.F. Wardlaw (1979).

The exact nature of the inhibition of long-distance transport at temperature extremes is still uncertain. Inhibition appears not to be energy related in a metabolic sense, but low-temperature effects may be due to a displacement of proteinacious material. This would lead to transient responses that reverse in time. More sustained responses under either low- or high-temperature treatments are likely to be due to a build up of callose (a β-1,3 glucan) in sieve-plate pores.

 Whether reduced translocation is the cause of poor growth at extreme temperatures is often difficult to assess. This is partly because of the transient nature of the temperature response in many species and partly because the response of the transport system to temperature has been examined in isolation from other processes. In sorghum, where temperatures below 20°C effectively reduce translocation, this reduction is minor in comparison with the direct effect of the same temperature on growth. Current findings suggest that long-distance transport in the phloem does not have a direct role in regulating whole-plant responses to temperature.   

14.3.3 - Biochemistry and basic concepts

Fig14.15.png

Figure 14.15. Molecules must collide for a chemical reaction to occur, but from the expected number of collisions in a given solution it is clear that only a small number of these collisions actually result in a reaction. For a reaction to occur not only must molecules collide but they must do so above a critical velocity or minimum energy (activation energy).This explains an apparent anomoly where kinetic theory predicts that a 10 K (Kelvin) increase in absolute temperature (K = °C + 273) would be expected to increase the number of collisions by about 2%. However, above a critical value the rate of a reaction can increase two- to three-fold (200-300%) per 10°C rise because the number of collisions increases considerably more than average behaviour would predict. This change in the rate of a reaction with a rise in temperature of 10°C is known as the Q10 value and is around 2 to 3 for many chemical (enzyme) reactions which are operating within their dynamic range (Based on various sources, courtesy I.F. Wardlaw)

Enzymes play a major role in regulating the way in which plants respond to temperature. The effect of temperature on enzyme activity is expressed through the maximum rate (Vmax) and the enzyme–substrate affinity (Km) and this in turn is related to the effect of temperature on enzyme synthesis, activation and stability.

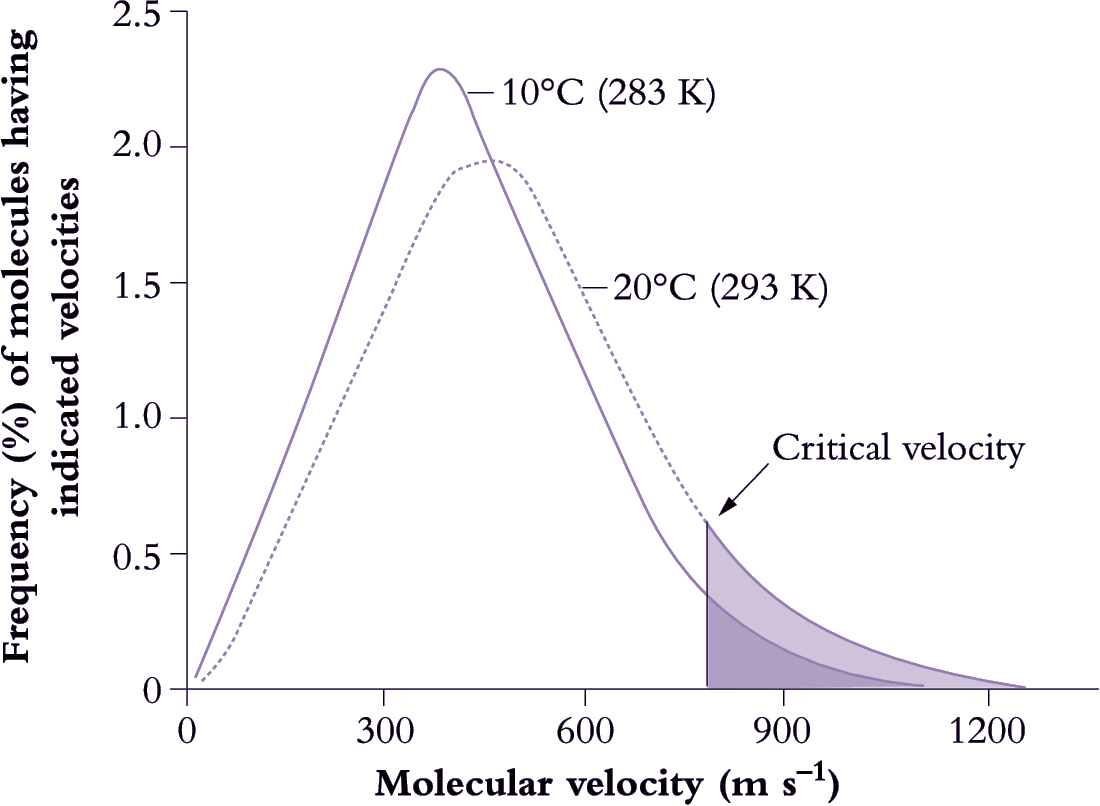
Basic metabolic rates tend to increase exponentially within their dynamic range (10–30°C) so that a rise in temperature of 10°C will at least double reaction rate, that is, ‘Q10’ = 2 (Figure 14.15). Q10 represents the net outcome of increased activity of an enzyme system with increased temperature, offset by any deactivation of the enzyme associated with this increase. Q10 values for metabolic processes are generally in the range of 2–3 and values below this imply that the reaction is at least partly governed by physical rather than metabolic processes. Q10 values for physical processes are commonly around 1.3. Physical limitation occurs when there are barriers to the transfer of substrate to reaction sites in a cell. Reaction rates of whole organisms or even organs often increase approximately linearly with temperature. Respiration is a case in point. This departure from an exponential increase results from a progressive shift in the reaction rates of component processes which first increase exponentially with temperature but then become modified by physical constraints such as substrate availability.

Enzymes can adjust to changes in the temperature environment, such that rates in acclimated plants are not as divergent as would be anticipated from the immediate response to temperature change. Acclimation can take a number of forms which may involve changes in isozymes or enzyme concentration, modification of an enzyme by substrate and effectors, or changes in metabolic regulation.

The concept of Q10 values has been extended to complex cellular and even whole-plant functions and has been used to provide some insight into the nature of the factors limiting the response of plants to temperature.

The ‘thermal kinetic window’ is a concept that relates enzyme activity and optimal plant metabolism to the temperature characteristics of the Michaelis–Menten constant (Km) of substrates and cofactors. Thermal kinetic windows define the temperature range outside which plants experience thermal stress. Many enzymes operate under non-saturating substrate concentrations and substrate binding (Km) may at times be of greater importance than maximum velocity (Vmax) for the characterisation of enzyme function under physiological conditions. The thermal kinetic window for a specific enzyme in a particular species (often spanning 8–15°C) is generally narrower than the plant temperatures experienced on a seasonal or daily basis, and temperature extremes that induce heat shock and chilling injury are not required for plants to experience some degree of thermal stress.

In the event of a sustained change in temperature conditions of plant growth, temperature:Km relationships for key enzyme reactions can adjust towards a temperature optimisation for metabolism and hence growth under those conditions, an out-come referred to above as acclimation and amenable to analysis via an Arrhenius plot to reveal underlying bioenergetics.

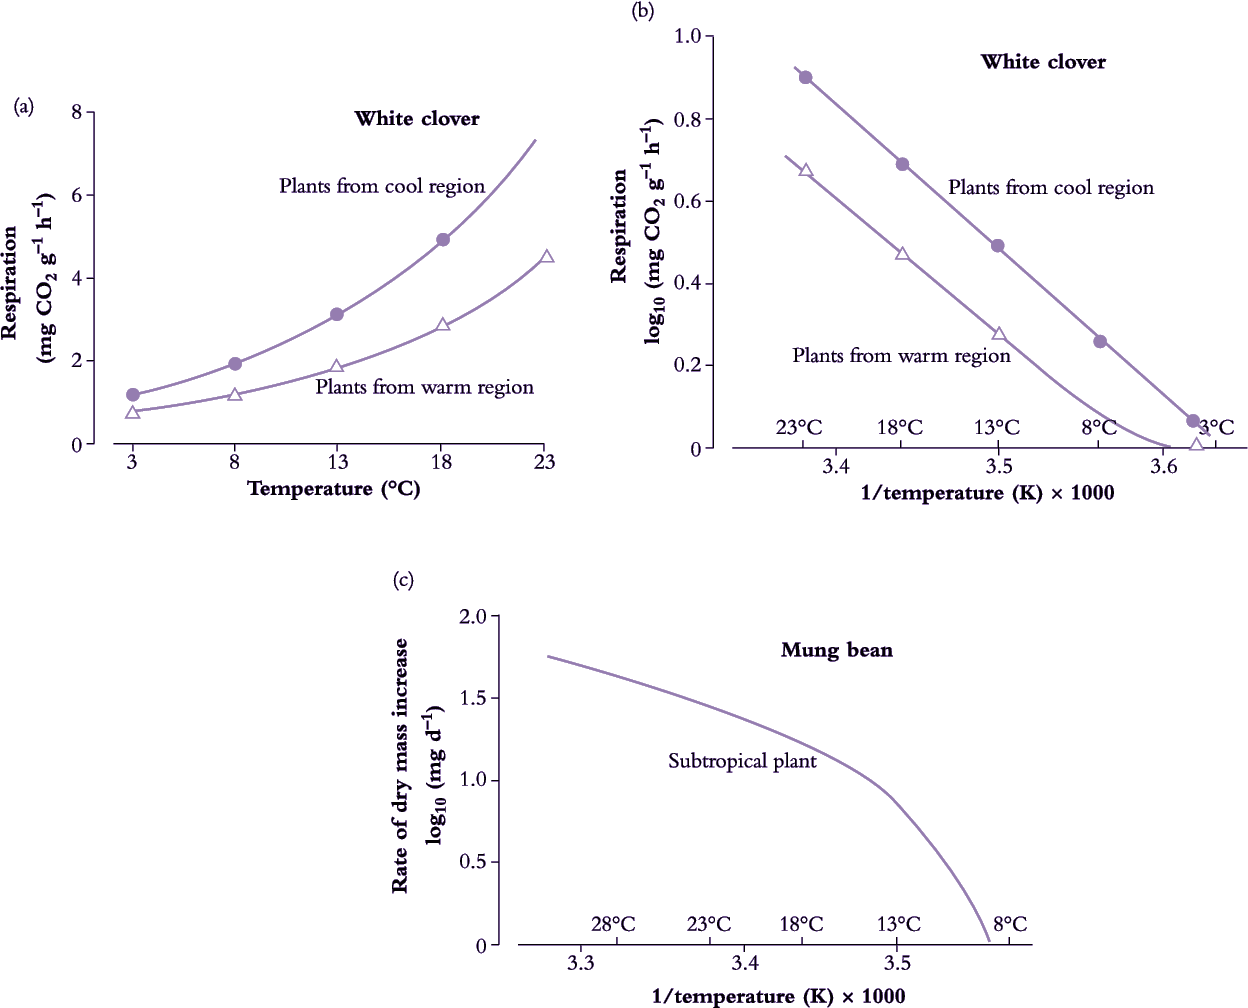
By analogy with graphs used to illustrate Michaelis–Menten kinetics, the natural logarithm of a physiological reaction rate (k) plotted against the reciprocal of absolute temperature (1/T) yields a straight line (Figure 14.7). This procedure in effect linearises an exponential response of reaction rate to temperature, and can be summarised in general terms as:

\[k=Ae^{\frac{E_a}{RT}}\tag{14.6}\]

where k is the rate constant of the reaction; A is a constant (exponential or frequency factor); Ea is the activation energy; R is the universal gas constant; T is absolute temperature in degrees Kelvin (K).

This equation can be rearranged to facilitate comparisons of reaction rate at two temperatures, T1 and T2:

\[\frac{\text{ln }k_2}{\text{ln }k_1} = A \frac{T_2-T_1}{T_1/T_2}\tag{14.7}\]

This relates enzyme activity to temperature where k1 and k2 are the reaction rates at absolute temperatures T1 and T2.

Plotting log k as a function of 1/T yields a linear relationship in the dynamic temperature range where the organism shows readily reversible responses to temperature, and can live indefinitely. Slope indicates the ‘energy of activation’ (Ea) which is the minimal energy required for the reaction to occur. A change in slope of this line indicates a change in sensitivity. A steeper slope at low temperature indicates that the energy of activation has increased and has therefore become more limiting to maximum velocity (Vmax) of the overall reaction (Figure 14.16).

Fig14.16.png

Figure 14.16. (a) Dark respiration of white clover leaves (dry mass basis) increases with temperature. However, respiration rate depends on the conditions under which plants have grown and is greater for leaves grown under cool conditions. (b) An Arrhenius plot provides a useful basis for comparing the temperature response of two sets of leaves. Respiration (reaction) rate (log transformed) is plotted as a function of the reciprocal of absolute (Kelvin) temperature (1/temperature (K)). An Arrhenius plot (see Equation 14.1) is also used in analysing many chemical transformations and processes in which absolute rates are exponentially related to temperature and thus yield a straight-line relationship as illustrated here. Arrhenius equations have been applied to a whole range of plant functions from photosynthesis to changes in dry mass. Slope is characteristic of a particular reaction and varies between species, but in this example using clover there is little difference between warm and cool region leaves, indicating that the basic activation energies are similar. (c) Many subtropical species, such as mung bean, are chilling sensitive, growing poorly at temperatures well above freezing. An Arrhenius plot of growth (or a more specific biochemical reaction) is no longer linear throughout the whole temperature range. A steeper slope at low temperature implies that the energy of activation has increased and has become more limiting to plant function compared with values above that chilling threshold. At high temperatures the slope of the line is again reversed as enzymes are inactivated. Actual values will vary from one reaction to another and between species. (a) Based on Woledge and Dennis (1982) Ann Bot 50, 25-35. (c) Based on Bagnall and Wolfe (1978) J Exp Bot 29, 1231-1242.

Considerable use has been made of Arrhenius plots in attempts to determine critical temperatures for key enzymatic reactions in plant cells. Membrane lipids may undergo a phase change from the mobile to the solid state with a fall in temperature and this will vary with the nature of the lipids in the membrane, particularly the degree of unsaturation (double bonds). Any change in lipid properties would be expected to modify the activity of membrane-bound enzymes. Because of the complex nature of membranes, such change will often be a gradual rather than an abrupt change at a precise temperature.

Arrhenius plots have also been used to analyse the response to temperature of individual organs and whole plants in order to determine critical temperatures for growth. In chilling-sensitive species, the slope of the Arrhenius plot becomes steeper at low temperature, indicating a change in enzyme–temperature relationships. Plant taxa which experience broader ranges of temperature during growth in their native habitats can have smaller Arrhenius temperature coefficients.

Membranes and their associated enzymes are likely to provide a key to many temperature responses in plants and this can be extended to frost damage where membrane destabilisation resulting from freeze-induced dehydration is a major factor in freezing injury (Section 14.6).