Susanne von Caemmerer, Research School of Biology, Australian National University
CO2 assimilation rate at a whole-leaf level can be analysed in terms of the underlying biochemistry. Traditionally, photosynthesis has been divided into light and dark reactions. The light reactions describe photosynthetic electron flow which generates reducing power (NADPH) and the formation of ATP. The dark reactions consist of the photosynthetic carbon reduction and oxidation cycles which start with Rubisco as the primary catalyst.
In this essay A:Ci refers to CO2 assimilation rate (A) as a function of intercellular CO2 (Ci) which can either be expressed in terms of concentration (µL of CO2 per litre of gas, µL L–1, or ppm) or partial pressure (µbar, or Pa). Multiplying concentration by atmospheric pressure converts it to partial pressure (e.g. 400 µL L–1 x 0.95 bar = 380 µbar). Partial pressures are preferred as this is the form that relates best to Rubisco performance and takes into account the altitude where the measurement was made. At sea level where atmospheric pressure averages one bar, the values for concentration and partial pressure are the same. A:Ci curves are created by measuring A in various atmospheric CO2 concentrations.
Physical concepts of leaf gas exchange
Penman and Schofield (1951) put diffusion of CO2 and water vapour through stomata on a firm physical basis. Their ideas were taken up at Wageningen by Pieter Gaastra in the 1950s and modern analytical gas exchange is often attributed to this seminal work (Gaastra 1959) where he even constructed his own infrared gas analyser and other equipment necessary to make measurements of CO2 and water vapour exchange. His work was a landmark because it examined CO2 assimilation and water vapour exchange rates of individual leaves under different environmental conditions, and he distinguished between stomatal and internal resistances. Gaastra calculated resistances to water vapour and CO2 diffusion from two equations (here in our simplified notation) which are based on Fick’s Law for the diffusion of gases.
\[ E=\frac{w_i-w_a}{r_{sw}} \text{ and } A=\frac{C_a-C_i}{r_{sc}} \tag{1} \]
where E and A are the fluxes of water vapour and CO2 and \(w_i\) and \(c_i\) and \(w_a\) and \(c_a\) are the mole fractions of water vapour and CO2 in intercellular air spaces and ambient air respectively. The denominator terms, \(r_{sw}\) and \(r_{sc}\), represent stomatal resistances to H2O and CO2 diffusion respectively. Gaastra assumed that \(w_i\) was equivalent to the saturated vapour pressure at the measured leaf temperature. By rearranging equation 1, \(r_{sw}\) could be calculated:
\[ r_sw=\frac{w_i-w_a}{E} \tag{2} \]
Knowing that resistances to CO2 and water vapour are related by the ratio of their diffusivities, he calculated stomatal resistance to CO2 diffusion, \(r_{sc}\). Gaastra realised that the diffusion path for CO2 is longer than that of water vapour, as CO2 had to diffuse from the intercellular airspaces through the cell wall across membranes to the chloroplast stroma where CO2 fixation by Rubisco takes place. He therefore extended the equation for CO2 assimilation to:
\[ A=\frac{C_a-C_c}{r_{sc}+r_m} \tag{3} \]
where Cc represented CO2 concentration in the chloroplasts.
Gaastra analysed the dependence of CO2 assimilation rate on light, CO2 and temperature, and observed that at low CO2 concentrations the rate of CO2 assimilation was independent of temperature whereas it was strongly influenced by temperature at higher CO2 concentrations. This led him to conclude that the rate of CO2 uptake was completely limited by CO2 diffusion processes at low CO2 and that biochemical processes became limiting only at high CO2. The belief that CO2 diffusion was limiting gave rise to the assumption that chloroplastic CO2 concentration was close to zero. This led to the erroneous simplification of the above equation such that the total resistance to CO2 diffusion could be calculated from CO2 assimilation rate and the ambient CO2 concentration alone. Since stomatal resistances could be calculated from measurements of water vapour diffusion, it was also possible to calculate mesophyll resistance to CO2 diffusion. In Australia particularly, there was great interest in determining the relative importance of stomatal versus mesophyll resistance in limiting CO2 assimilation rates under adverse conditions of high temperature and water stresses. In global terms, much of the pioneering work was undertaken in this country (see, for example, Bierhuizen and Slatyer 1964).
Calculation of intercellular CO2, Ci and the first A versus Ci curves
Although CO2 concentration in intercellular airspaces, Ci, was explicit in Gaastra’s equations, this term was first specifically calculated by Moss and Rawlings in 1963, and the first extensive use of the parameter was made by Whiteman and Koller in 1967, who examined stomatal responses to CO2 and irradiance, concluding that stomata were more likely to respond to Ci rather than Ca. The first bona fide response curves of CO2 assimilation rate to Ci rather than Ca were those of Troughton and Slatyer (1969) (Figure 1). In Figure 1(a), Ci was derived from measurements of CO2 uptake in an assimilation chamber where air passed through a leaf, rather than over both surfaces concurrently (as became commonplace in subsequent designs), and such estimates would differ slightly. More importantly, those measurements were made at different temperatures and confirmed that CO2 assimilation was not greatly affected by temperature at low Ci. Later, this lack of temperature dependence was explained by the kinetics of Rubisco (von Caemmerer and Farquhar 1981). Figure 1(b) shows the initial slope of CO2 response curves measured at different stages of water stress. In this case, water stress has affected stomatal resistance (as the Ci obtained at air levels of CO2 occur at progressively lower Ci) but not the relationship between CO2 assimilation rate and Ci. A versus Ci response curves thus provided an unambiguous distinction between stomatal and non-stomatal effects on CO2 assimilation and, provided stomata respond uniformly across both leaf surfaces, that distinction can be made quantitative.
Before we head further into a discussion of our understanding and interpretation of more comprehensive CO2 response curves, we must take an important digression into development of mathematical models of C3 photosynthesis.
Biochemistry of photosynthesis and leaf models
Gas exchange studies focused initially on physical limitations to diffusion, but it was not long before persuasive arguments were being brought forward to show that leaf biochemistry must influence the rate of CO2 fixation even at low CO2 concentrations. Björkman and Holmgren (1963) made careful gas exchange measurements of sun and shade ecotypes of Solidago growing in Sweden, and noted strong correlations between photosynthetic rate measured at high irradiance and ambient CO2 and the nitrogen content of leaves, and later also related it to different concentrations of Rubisco (then called carboxydismutase). Anatomical studies implied that thin shade leaves would have less internal diffusion resistance to CO2 than thicker sun leaves where cells were more densely packed, but the opposite was observed. Furthermore, following earlier discoveries that CO2 assimilation rate was enhanced under low-O2, Gauhl and Björkman (1969), then at Stanford, showed very elegantly that O2 concentration affected CO2 assimilation rate but not water vapour exchange (i.e. stomata did not respond to a change in O2). Clearly, the increase in CO2 assimilation rates seen with a decrease in O2 concentration could not be explained via a limitation on CO2 diffusion.
Central importance of Rubisco
Early mathematical models of leaf photosynthesis were extensions of Gaastra’s resistance equation, and could not accommodate the O2 sensitivity of CO2 assimilation. They were quickly followed by development of more biochemical models in the early 1970s and the discoveries by Bowes et al. (1971) that Rubisco was responsible for both carboxylation and oxygenation of RuBP (a five-carbon phosphorylated sugar, regenerated by the photosynthetic carbon reduction (PCR) cycle of chloroplasts). This crucial observation of dual function put Rubisco at centre stage. Laing et al. (1974) were first to compare the gas exchange of soybean leaves with the in vitro kinetics of Rubisco and suggested the following equation for the net CO2 assimilation rate:
\[ A=V_c \left(1-0.5\frac{V_o}{V_c} \right) \tag{4} \]
where \(V_c\) and \(V_o\) are the rates of Rubisco carboxylation and oxygenation (later on a term for mitochondrial respiration was added to most models). Laing et al. related a ratio of the rates of carboxylation to oxygenation of RuBP to the concentration of its substrates, CO2, \(C\), and O2, \(O\), and showed that:
\[ \frac{V_o}{V_c} = \frac{V_{omax} K_c}{V_{cmax} K_o} \frac{O}{C} = \frac{2 \Gamma_{*}}{C} \tag{5} \]
where \(K_c\), \(K_o\), \(V_{cmax}\), \(V_{omax}\) are the corresponding Michaelis Menten constants and maximal activities of carboxylase and oxygenase functions respectively and \(\Gamma_{*}\)is the CO2 compensation point in the absence of mitochondrial respiration.
A note on \(\Gamma\): illuminated leaves held in a closed circuit of recirculating air will reduce CO2 to a ‘compensation point’ where uptake and generation of CO2 are balanced; this is commonly 50–100 ppm for C3 plants and referred to as \(\Gamma\). A CO2 response curve for leaf photosynthesis will show a similar value as an intercept on the abscissa. \(\Gamma\) can thus be measured empirically, and will be an outcome of interactions between photosynthesis, photorespiration and dark (mitochondrial) respiration (R). If allowance is made for R, the CO2 compensation point would then be slightly lower, and is termed \(\Gamma_{*}\). As with measured \(\Gamma\), this inferred CO2 compensation point, \(\Gamma_{*}\) , is linearly related to O2, an observation that intrigued earlier observers but was easily reconciled with the dual function of Rubisco. Laing et al. (1974) used Equations 4 and 5 to predict this linear dependence of \(\Gamma_{*}\) on O2, and with subsequent confirmation Rubisco became a key player in photosynthetic models. (Equation 4 assumes that for each oxygenation, 0.5 CO2 are evolved in the subsequent photorespiratory cycle, although there has been some debate over this stoichiometry.) If the enzyme reaction is ordered with RuBP binding first, the rate of carboxylation in the presence of the competitive inhibition by O2 at saturating RuBP concentration can be given by
\[ V_c=\frac{CV_{cmax}}{C+K_c \left( 1+O⁄K_o \right)} \tag{6} \]
When combined with Equation 4 this gave a simple expression of net CO2 fixation rate:
\[ A = \frac{\left(C_i - \Gamma_{*} \right) V_{cmax}}{C_i + K_c \left( 1 + O / K_o \right)} \tag{7} \]
which depends on the maximal Rubisco activity and provided the quantitative framework for comparing rates of CO2 assimilations with the amount of Rubisco present in leaves (von Caemmerer and Farquhar 1981). Difference in CO2 assimilation rates observed under different growth conditions could then be explained according to variations in the amount of Rubisco present in leaves. In Figure 2 the dotted line shows a CO2 response curve modelled by Equation 7. Chloroplast CO2 partial pressure was then assumed to be similar to that in the intercellular airspaces. Using on-line discrimination between 13CO2 and 12CO2, and deriving an estimate of CO2 partial pressure at fixation sites within chloroplasts, we subsequently learned that a further draw down can occur, but the general applicability of Equation 7 was not compromised. As an aside, these equations became basic to most photosynthetic models long before the order of the reaction mechanism of Rubisco had been unequivocally established. Had CO2 and O2 bound to Rubisco before RuBP, or the reaction not been ordered, our equations would have been much more complex with both Km(CO2) and Km(O2) dependent upon RuBP concentration.
Regeneration of RuBP and electron transport rate
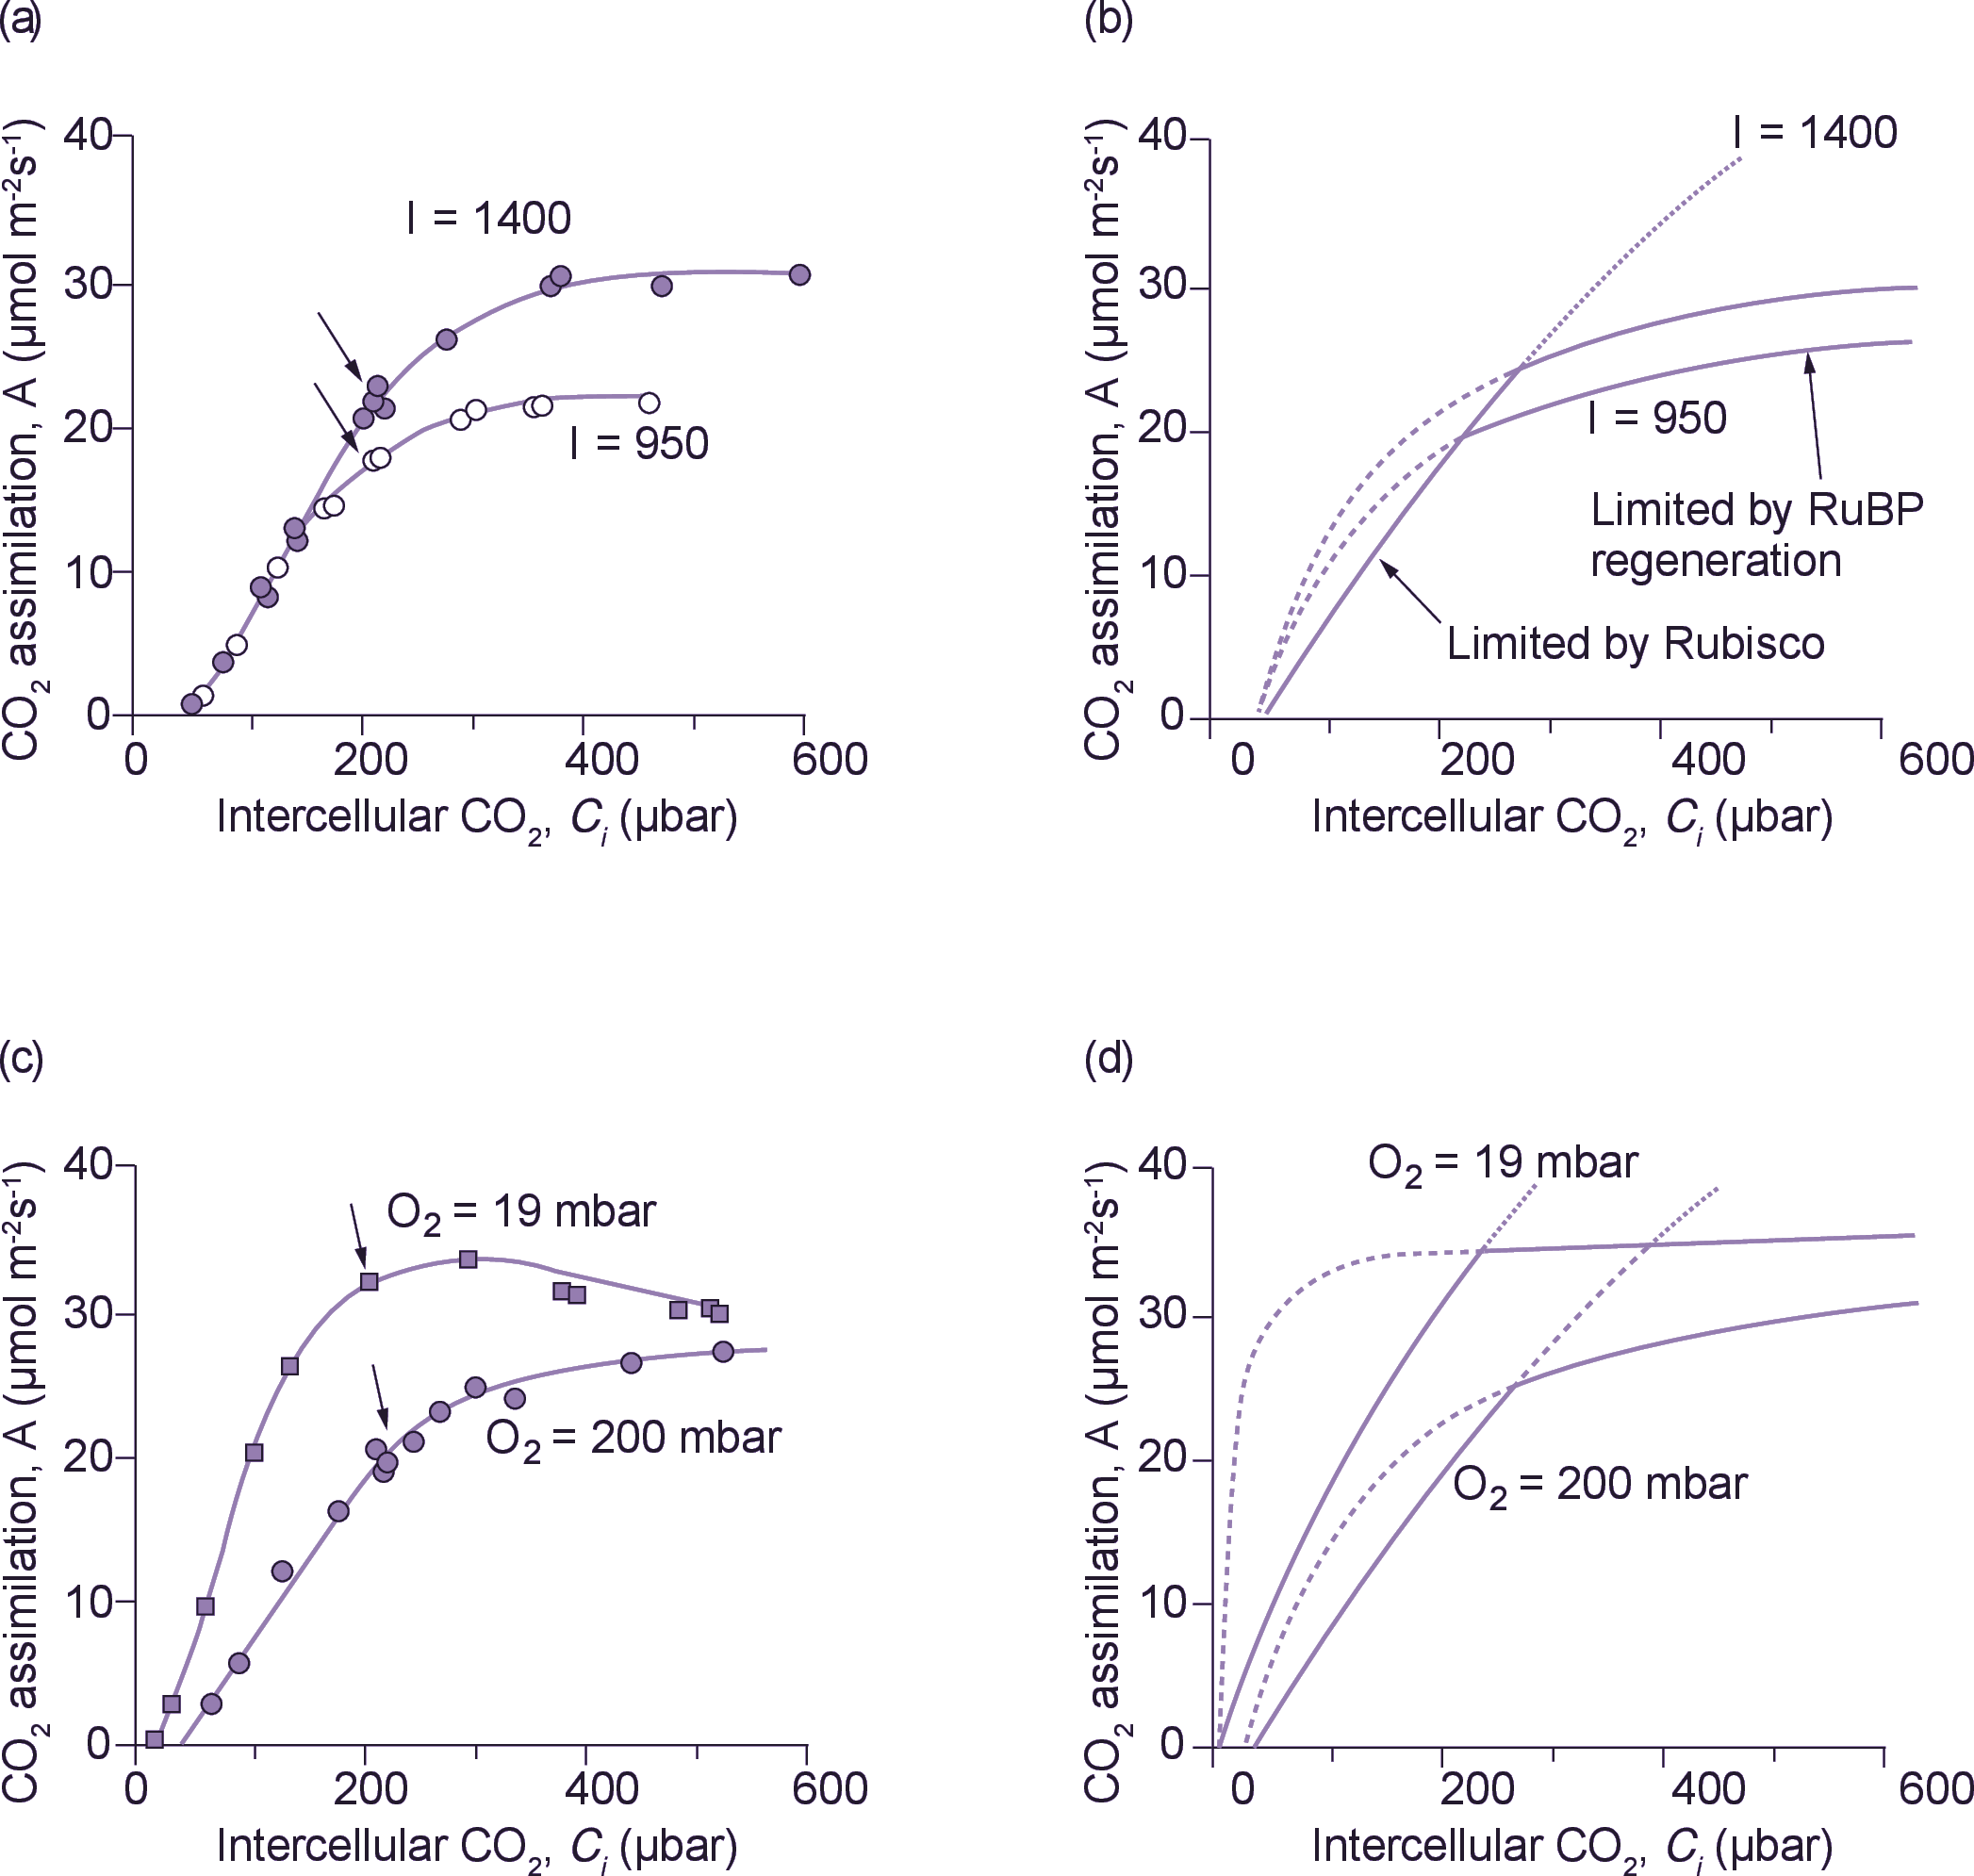
Equation 7 could mimic CO2 assimilation rate at low Ci , as well as O2 effects on CO2 uptake, but measured rates of CO2 assimilation saturated much more abruptly at high CO2 concentrations than could be predicted from Rubisco kinetics (Figure 2). Using a novel approach in Estonia, Laisk and Oja (1974) proposed that CO2 assimilation was limited by RuBP regeneration rate at high Ci. They had fed brief pulses of CO2 to leaves that had been previously exposed to low CO2 (conditions under which RuBP concentrations were presumably high), and obtained rates up to 10 times higher than the steady-state rates of CO2 assimilation! Lilley and Walker (1975) at Sheffield reached a similar conclusion after comparing the CO2 responses of illuminated isolated chloroplasts with those obtained upon lysing chloroplasts in a medium containing saturating RuBP.
In our model of C3 photosynthesis (Farquhar et al. 1980), the way we handled rate limitation by RuBP regeneration was probably the most important decision made in that context. Both ATP and NADPH were required for RuBP regeneration, and this fundamental need formed a connection with light in our model. From a mathematical perspective there were two options: (1) RuBP and CO2 could always colimit the rate of carboxylation, and this we would express in a double Michaelis Menten equation, or (2) carboxylation rate could be limited by either RuBP or else be saturated and thus independent of RuBP. The in vivo kinetics of Rubisco suggest the second option.
Peisker (1974) and Farquhar (1979) pointed out that Rubisco was unusual in that it was present in the chloroplast at very high concentrations. Given such a low Km(RuBP), this meant that the in vivo kinetics with respect to chloroplastic RuBP were those of a tight binding substrate. That is, the rate of Rubisco would depend linearly on RuBP concentration when chloroplastic RuBP concentration was below Rubisco catalytic site concentration, and once RuBP exceeded Rubisco site concentration carboxylase would be RuBP saturated. We also knew that irradiance affected CO2 assimilation rate mainly at high intercellular CO2. This supported option 2 (see Figure 2a, b). Given these insights, the more complex link between chloroplastic electron transport rate and RuBP pools used by Farquhar et al. (1980) was quickly simplified to a description of CO2 assimilation that was limited by RuBP regeneration, and utilisation of ATP and NADPH for photosynthetic carbon reduction or oxygenation. RuBP regeneration was in turn driven by the electron transport rate, J (dependent on irradiance and its own maximal capacity), and stoichiometry of ATP or NADPH use by the photosynthetic carbon reduction and oxygenation cycle. For example, when electron transport rate, \(J\), was limiting (in view of ATP use) carboxylation rate could proceed at:
\[ V_c = \frac{J}{4.5 + 10.5 \Gamma_{*} / C} \tag{8} \]
Dashed lines in Figure 2 give modelled electron-transport-limited rates of CO2 fixation according to:
\[ A = \frac{J \left( C_i - \Gamma_{*} \right)}{4.5C_i + 10.5 \Gamma} \tag{9} \]
This simplified formulation of C3 photosynthesis (Equations 7 and 9) now provides a meaningful framework for analysis of leaf photosynthesis, and has focused our interpretation of CO2 response curves on leaf biochemistry. For example, von Caemmerer and Farquhar (1981) related the initial slopes of CO2 response curves to in vitro Rubisco activity, and the CO2-saturated rates of A:Ci curves to in vitro measurements of electron transport rates. Such studies validate Equations 7 and 9, demonstrating that CO2 response curves could be used as a meaningful and non-invasive tool to quantify these biochemical components under a wide variety of conditions. Subsequent comparisons between wild-type tobacco and transgenic tobacco with a reduced amount of Rubisco have confirmed our concepts. When Rubisco alone is reduced in transgenic plants, RuBP regeneration capacity remains unchanged and no longer limits the rate of CO2 assimilation at high CO2. Rubisco then constitutes the sole limitation (Figure 3).
Colimitation
Both Rubisco and electron transport components are expensive in terms of leaf nitrogen. For example, Rubisco represents up to 25% of a leaf’s protein nitrogen, with energy transduction components a further 25%. At a Ci where the transition from a Rubisco limitation to RuBP regeneration limitation occurs, both capacities are used efficiently and colimit net CO2 assimilation. That is, assimilation can only be increased if both sets of component processes are increased. Where then should the balance lie if a plant is to use nitrogen-based resources to best effect? The transition obviously varies with irradiance and temperature so that an optimal balance will vary with habitat. However, surprisingly little variation has been observed and plants appear unable to shift this point of balance. As an example, important in the context of rising atmospheric CO2 concentrations, plants grown in a high CO2 environment should manage with less Rubisco and thus put more nitrogen into the capacity of RuBP regeneration. Surprisingly, such adjustments have not been observed experimentally, but given prospects of global change, our need for understanding gains urgency.
References
Bierhuizen JF, Slatyer RO (1964) Photosynthesis of cotton leaves under a range of environmental conditions in relation to internal and external diffusive resistances. Aust J Biol Sci 17: 348–359
Björkman O, Holmgren P (1963) Adaptability of the photosynthetic apparatus to light intensity in ecotypes from exposed and shaded habitats. Physiol Plant 16: 889–914
Bowes G, Ogren WL, Hageman RH (1971) Phosphoglycolate production catalysed by ribulose diphosphate carboxylase. Biochem Biophys Res Com 45 716–722
Evans JR, von Caemmerer S (1996) CO2 diffusion inside leaves. Plant Physiol 110: 339–346
Farquhar GD (1979) Models describing the kinetics of ribulose bisphoshate carboxylase–oxygenase. Archiv Biochem Biophys 193: 456–468
Farquhar GD, von Caemmerer S, Berry JA (1980) A biochemical model of photosynthetic CO2 assimilation in leaves of C3 species. Planta 149: 78–90
Gaastra P (1959) Photosynthesis of crop plants as influenced by light, carbon dioxide, temperature and stomatal diffusion resistance. Mededel Landbouwhogeschool Wageningen 59: 1–68
Gauhl E, Björkman O (1969) Simultaneous measurements on the effect of oxygen concentration on water vapor and carbon dioxide exchange. Planta 88: 187–191
Hudson GS, Evans JR, von Caemmerer S, Arvidsson YBC, Andrews TJ (1992) Reduction of ribulose-1,5-bisphosphate carboxylase/oxygenase content by antisense RNA reduced photosynthesis in tobacco plants. Plant Physiol 98: 294–302
Laing WA, Ogren W, Hageman R (1974) Regulation of soybean net photosynthetic CO2 fixation by the interaction of CO2, O2 and ribulose-1,5-diphosphate carboxylase. Plant Physiol 54: 678–685
Laisk A, Oja VM (1974) Photosynthesis of leaves subjected to brief impulses of CO2. Soviet J Plant Physiol 21: 928–935
Lilley RM, Walker DA (1975) Carbon dioxide assimilation by leaves, isolated chloroplasts and ribulose bisphosphate carboxylase from spinach. Plant Physiol 55: 1087–1092
Moss DN, Rawlings SL (1963) Concentration of carbon dioxide inside leaves. Nature 197: 1320–1321
Peisker M (1974) A model describing the influence of oxygen on photosynthetic carboxylation. Photosynthetica 8: 47–50
Penman HJ, Schofield RK (1951) Some physical aspects of assimilation and transpiration. Symp Soc Exp Biol 5: 115–129
Sharkey TD, Bernacchi CJ, Farquhar GD, Singsaas EL (2007) Fitting photosynthetic carbon dioxide response curves for C3 leaves. Plant Cell Environ 30: 1035-1040
Troughton JH, Slatyer RO (1969) Plant water status, leaf temperature and the calculated mesophyll resistance to carbon dioxide of cotton. Aust J Biol Sci 22: 815–827
von Caemmerer S (2000) Biochemical models of photosynthesis. Techniques in Plant Sciences No.2. CSIRO Publishing, Australia. http://biology.anu.edu.au/CMS/FileUploads/file/vonCaemmerer/von%20Caemme...
Whiteman PC, Koller D (1967) Interactions of carbon dioxide concentration, light intensity and temperature on plant resistance to water vapour and carbon dioxide diffusion. New Phytol 66: 463–473