
Highly productive multiple cropping in a CO2-enriched greenhouse at CSIRO Merbein (Original photograph courtesy E.A. Lawton)
Chapter editors: Charles Price1 and Rana Munns1,2
1School of Plant Biology, University of Western Australia, 2 CSIRO Plant Industry, Canberra
This chapter is updated from the original by PE Kriedemann, JM Virgona and OK Atkin (1st Edition)
Growth is an irreversible increase in plant size accompanied by a quantitative change in biomass (weight). Development is more subtle and implies an additional qualitative change in plant form or function such as a phase change from vegetative to reproductive growth.
Growth analysis is a conceptual framework for resolving the nature of genotype x environment interactions on plant growth and development.
In natural environments, growth and development cycles have to be completed within a time frame dictated by environmental conditions where light, moisture and nutrients often limit expression of genetic potential. Adaptive features that counter such constraints and help sustain relative growth rate can be revealed via growth analysis under contrasting conditions.
In managed environments, crop plants commonly experience similar restrictions, but in addition their economic yield is often only a small portion of total biomass at harvest and subject to genetic control. Crop scientists need to explore plant growth and reproductive development in quantitative terms. Sources of variation in productivity can then be resolved into those processes responsible for converting external resources into biomass and those responsible for partitioning biomass into usable sinks such as cereal ears or pumpkins. Both aspects are addressed here.
The most useful and widely used analysis is the concept of relative growth rate (RGR) and the simple RGR equation, which derives from the growth of cell populations with unrestricted resources – that is where light, space and nutrient supply are not limiting.
Growth models developed from populations of single cells can be extended mathematically to cover complex multicellular organisms where whole-plant growth is expressed in terms of leaf area and nutrient resources. Such growth indices are not intrinsic properties of plants, but rather mathematical constructs with functional significance. These concepts can be traced to the early 1900s and have proved increasingly useful for studies of growth and developmental responses in natural and managed environments.
A small population of unicellular organisms presented with abundant resources and ample space will increase exponentially (Figure 6.1a). Population doubling time Td (hours or days) is a function of an inherent capacity for cell division and enlargement which is expressed according to environmental conditions. In Figure 6.1(a) doubling times for these two populations are 1 and 2 d for fast and slow strains respectively.
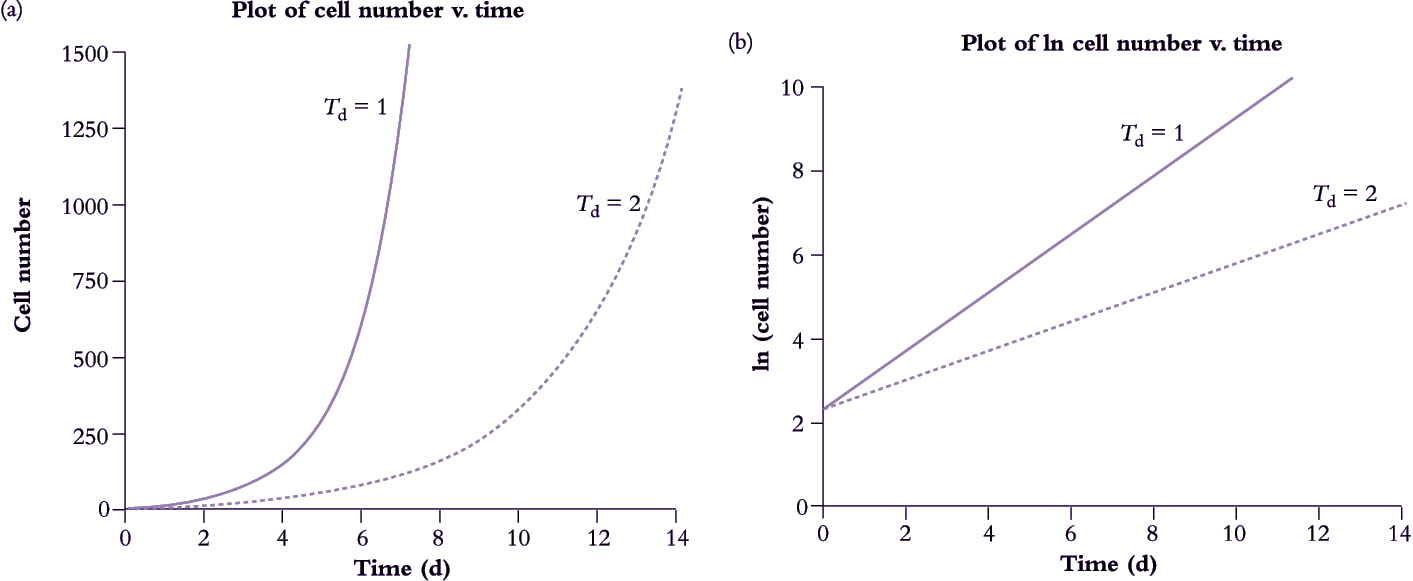
Figure 6.1. A population of cells unrestricted by space or substrate supply will grow exponentially. In this hypothetical case, a fast-growing strain of a single-celled organism with a doubling time of 1 d starts on day 0 with a population of n cells which increases to 120·n by day 7. In this example, n=10. The slow-growing strain with a doubling time of 2 d takes twice as long to reach that same size. When data for cell numbers are ln transformed, exponential curves (a) become straight lines (b) where slope = r.
Exponential curves such as those in Figure 6.1(a) are described mathematically as
\[N(t)=N_0e^{rt} \tag{6.1}\]
where N(t) is the number of cells present at time t, N0 is the population at time 0, r determines the rate at which the population grows, and e is the base of the natural logarithm. By derivation from Equation 6.1
\[r=\frac{1}{N}\frac{\text{d}N(t)}{\text{d}t} \tag{6.2}\]
and is called relative growth rate with units of 1/time. The doubling time is Td = (ln 2)/r.
If a population or an organism has a constant relative growth rate then doubling time is also constant, and that population must be growing at an exponential rate given by Equation 6.1. The ‘fast’ strain in Figure 6.1(a) is doubling every day whereas the ‘slow’ strain doubles every 2 d, thus r is 0.69 d–1 and 0.35 d–1, respectively.
If cell growth data in Figure 6.1(a) are converted to natural logarithms (i.e. ln transformed), two straight lines with contrasting slopes will result (Figure 6.1b). For strict exponential growth where N(t) is given by Equation 6.1,
\[\text{ln }N(t)=\text{ln }N_0+rt\tag{6.3}\]
which is the familiar slope-intercept form of a linear equation, so that a plot of ln N(t) as a function of time t is a straight line whose slope is relative growth rate r, and intercept is ln N0
In practice, r is inferred by assessing cell numbers N1 and N2 on two occasions, t1 and t2 (separated by hours or days depending on doubling time — most commonly days in plant cell cultures), and substituting those values into the expression
\[r=\frac{\text{ln }N_2-\text{ln }N_1}{t_2-t_1}\tag{6.4}\]
which expresses r in terms of population numbers N1 and N2 at times t1 and t2, respectively.
If growth is exponential, Eq. 6.3 will be linear and any two time points and the natural logarithm of their corresponding population sizes will give an estimate of the growth rate, r. However, if relative growth rate r is not constant, then growth is not exponential but the concept of relative growth rate is still useful for analysis of growth dynamics in populations or organisms. Equation 6.3 is then used to compute average relative growth rate between times t1 and t2 even though population growth might not follow Equation 6.1 in strict terms. In that case plots analogous to Figure 6.1(b) will not be straight lines.
In whole plants, cell number is an impractical measure of growth. Instead, fresh or oven-dried biomass (W) is generally taken as a surrogate for cell growth and referenced to the number of days elapsed between successive observations. Relative growth rate is now known as RGR rather than r and measured in days or weeks rather than hours.
Relative growth rate, RGR (d–1), can be expressed in terms of differential calculus as \(RGR=\frac{1}{W}\frac{\text{d}W}{\text{d}t}\) (compare Equation 6.2.) so that RGR is increment in dry mass (dW) per increment in time (dt) divided by existing biomass (W). Averaged over a time interval t1 to t2 during which time biomass increases from W1 to W2, RGR (d–1) can be calculated from
\[\text{RGR}=\frac{\text{ln }W_2-\text{ln } W_1}{t_2-t_1} \tag{6.5} \]
which is analogous to Eq, 6.4. Net gain in biomass (W) is the outcome of CO2 assimilation by leaves minus respiratory loss by the entire plant. Leaf area can therefore be viewed as a driving variable, and biomass increment (dW) per unit time (dt) can then be divided by leaf area (A) to yield the net assimilation rate, NAR (g m–2 d–1), where
\[\text{NAR}=\frac{1}{A}\frac{\text{d}W}{\text{d}T} \tag{6.6}\]
Averaged over a short time interval (t1 to t2 days) and provided whole-plant biomass and leaf area are linearly related (see Radford 1967),
\[\text{NAR}=\left(\frac{W_2-W_1}{t_2-t_1}\right)\left(\frac{\text{ln }A_2-\text{ln }A_1}{A_2-A_1}\right) \tag{6.7}\]
NAR thus represents a plant’s net photosynthetic effectiveness in capturing light, assimilating CO2 and storing photoassimilate. Variation in NAR can derive from differences in canopy architecture and light interception, photosynthetic activity of leaves, respiration, transport of photoassimilate and storage capacity of sinks, or even the chemical nature of stored products.
The following treatment assumes for simplicity that photosynthesis and the assimilation of CO2 occurs only in leaves, even though for many herbaceous or succulent species it occurs to a lesser degree also in stems. Since leaf area is a driving variable for whole-plant growth, the proportion of plant biomass invested in leaf area will have an important bearing on RGR, and can be conveniently defined as leaf area ratio, LAR (m2 g–1), where
\[\text{LAR}=\frac{A}{W}\tag{6.8}\]
LAR can be factored into two components: specific leaf area (SLA) and leaf weight ratio (LWR). SLA is the ratio of leaf area (A) to leaf mass (WL) (m2 g–1) and LWR is the ratio of leaf mass (WL) to total plant mass (W) (dimensionless). Thus,
\[\begin{align} \text{LAR} &= \frac{A}{W_L}\frac{W_L}{W} \\
&= \text{SLA} \times \text{LWR} \end{align} \tag{6.9} \]
As an aside, average LAR over the growth interval t1 to t2 is
\[\text{LAR}=\frac{1}{2} \left( \frac{A_1}{W_1}+\frac{A_2}{W_2} \right) \tag{6.10}\]
Expressed this way, LAR becomes a more meaningful growth index than A/W (Equation 6.8) and can help resolve sources of variation in RGR.
If both A and W are increasing exponentially so that W is proportional to A, it follows that
\[\frac{1}{W}\frac{\text{d}W}{\text{d}t}=\frac{1}{A}\frac{\text{d}W}{\text{d}t}\times\frac{A}{W}\tag{6.11}\]
0r (substituting Equations 6.5, 6.6 and 6.8)
\[\text{RGR}=\text{NAR}\times \text{LAR} \tag{6.12}\]
As LAR can be broken into SLA and LWR (Equation 6.9) then
\[\text{RGR}=\text{NAR}\times \text{LWR} \times \text{SLA} \tag{6.13}\]
Sources of variation in RGR partitioned this way provide useful insights on driving variables in process physiology and ecology. For an expanded discussion on methodological issues associated with the determination of RGR in experimental populations see Poorter and Lewis (1986).
Increases in leaf area over time can be a more useful basis for measuring plant growth rates than biomass increases, particularly as non-destructive techniques for measuring leaf area are now available. Plant growth rate can be measured as the relative increase in leaf area over time, by substituting total plant leaf area for total biomass in the conventional RGR equation.
\[\text{RGR}_\text{A} =\frac{\text{ln } LA_2 - \text{ln } LA_1}{t_2-t_1} \tag{6.14} \]
where RGRA is relative leaf area expansion rate, LA is total plant leaf area and t is time at two time intervals, t1 and t2, preferably 2-3 days apart.
Five key indices are commonly derived as an aid to understanding growth responses. Mathematical and functional definitions of those terms are summarised below.
|
Growth index |
Mathematical definition |
Units |
Functional definition |
|
Relative growth rate RGR |
\(\frac{1}{W}\frac{\text{d}W}{\text{d}t}\) |
d-1 |
Rate of mass increase per unit mass present (efficiency of growth with respect to biomass) |
|
Net assimilation rate NAR |
\(\frac{1}{A}\frac{\text{d}W}{\text{d}t}\) |
g m-2 d-1 |
Rate of mass increase per unit leaf area (efficiency of leaves in generating biomass) |
|
Leaf area ratio LAR |
\(\frac{A}{W}\) |
m2 g-1 |
Ratio of leaf area to total plant mass (a measure of ‘leafiness’ or photosynthetic area relative to respiratory mass) |
|
Specific leaf area SLA |
\(\frac{A}{W_L}\) |
m2 g-1 |
Ratio of leaf area to leaf mass (a measure of thickness of leaves relative to area) |
|
Leaf weight ratio LWR |
\(\frac{W_L}{W}\) |
dimension-less |
Ratio of leaf mass to total plant mass (a measure of biomass allocation to leaves) |
Light, CO2, temperature, water and nutrients are key driving variables or limiting factors for growth responses in a wide range of species. Growth indices serve as an indicator of plant response, and of interactions between environmental factors where they occur. Variation in whole-plant RGR can be resolved into contributions from NAR (net assimilation rate) and LAR (ratio of leaf area to total plant mass). LAR in turn can be separated into SLA (ratio of leaf area to leaf mass) and LWR (ratio of leaf mass to total plant mass).
Ecological and agronomic implications for managed and natural communities are considered in this section in the context of growth responses to light, temperature and CO2 concentration. The same principles apply to the analysis of effects of nutrients on growth, and to interactions between environmental variables.
Light impacts both photosynthetic activity and morphology of individual leaves and of plant canopies. Leaves are larger at higher light. Leaf area increases because of more cells per leaf rather than by cells having a larger surface area. Cells volume, however, increases and gives rise to substantial increases in leaf thickness. This is usually achieved by a greater depth of palisade cells, either greater in depth or an extra layer of cells.
In the example shown for cucumber in Table 6.1, high light caused a three-fold increase in area, but the cell cross-section was the same, indicating that the leaves had three times the number of cells. The cell volume more than doubled under high light (3.11 × 10⁻⁵ mm3 at 3.2 MJ m–2 s–1 cf. 1.46 × 10⁻⁵ mm3 at 0.5 MJ m–2 d–1), and because cross-sectional area was virtually unchanged, cell depth was responsible. This greater depth of palisade cells in strong light confers a greater photosynthetic capacity (per unit leaf area) and translates into larger values for NAR and a potentially higher RGR. At lower irradiance (Table 6.1) leaves are thinner and SLA will thus increase with shading. Because LAR = SLA × LWR (Equation 6.9) a smaller leaf area at lower irradiance is offset to some extent by a higher SLA for maximum light capture with the most efficient use of resources.
The significance of LAR × NAR interaction for whole-plant growth was appreciated early by G.E. Blackman (Agriculture Dept, Oxford University), who in a series of papers analysed shade-driven growth responses for many species. RGR response to growing conditions in low light, and the degree to which upward adjustment in LAR could offset reduced NAR, was a recurring theme. In a series of 20 pot experiments, Blackman and Wilson (1951a) established a close relationship between NAR and daily irradiance where shade-dependent reduction in NAR was similar for 10 species. NAR was linearly related to log irradiance, and extrapolation to zero NAR corresponded to a light-compensation point of 6–9% full sun for eight species, and 14–18% full sun for two others. Significantly, neither slope nor intercept differentiated sun-adapted plants such as barley, tomato, peas and sunflower from two shade-adapted species (Geum urbanum and Solanum dulcamara). LAR proved especially responsive to light and accounted for contrasts between sun plants and shade plants in their growth response to daily irradiance.
Concentrating on sunflower seedlings, Blackman and Wilson (1951b) confirmed that NAR increased with daily irradiance (Figure 6.2) and that LAR was greatly decreased (Figure 6.2). Response in RGR reflected LAR and especially in young seedlings which also showed highest RGR and were most sensitive to shading. LAR appeared sensitive to both daily maxima as well as daily total irradiance.
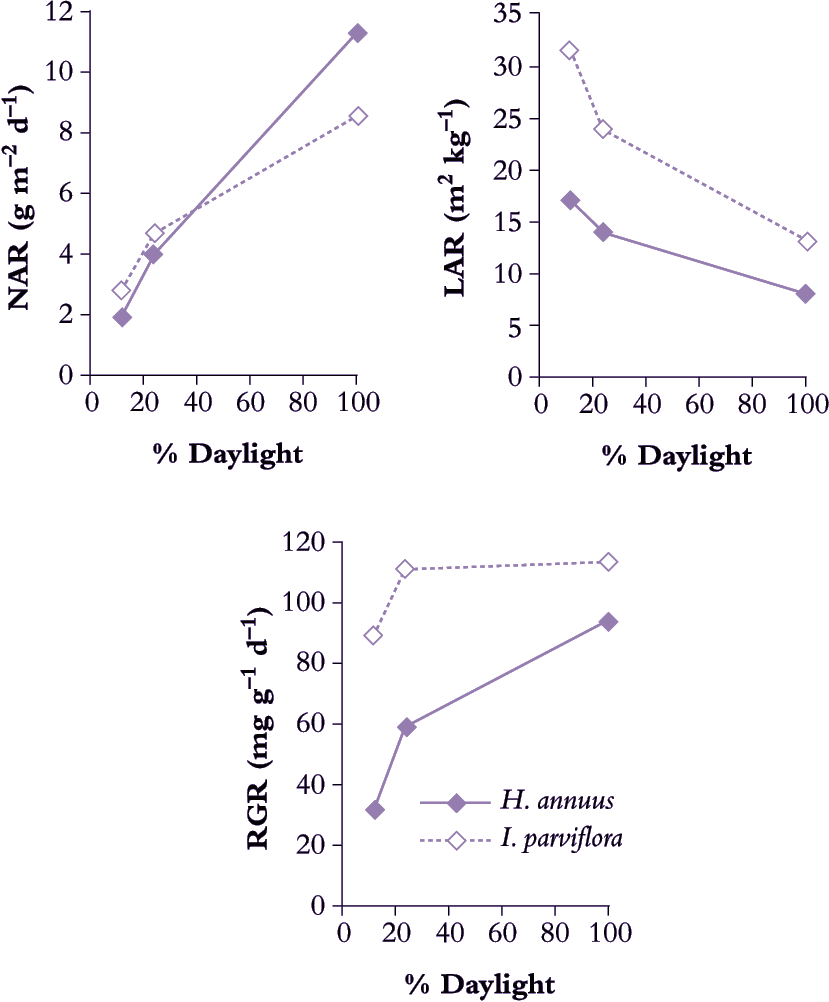
Figure 6.2 A sun-adapted plant such as Helianthus annuus adjusts LAR to some extent in response to lower daily irradiance but not enough to maintain RGR. By contrast, a shade-adapted plant such as Impatiens parviflora with somewhat higher LAR and RGR in full sun makes further adjustment in LAR so that RGR does not diminish to the same extent in moderate or deep shade as does that of H. annuus (Based on Blackman and Wilson 1951b; Evans and Hughes 1961)
A comparison between sunflower (Blackman and Wilson 1951b) and the woodland shade plant Impatiens parviflora (Evans and Hughes 1961) confirms this principle of LAR responsiveness to irradiance (Figure 6.2). Sunflower achieved noticeably higher NAR in full sun than did I. parviflora, but LAR was considerably lower, and translated into a somewhat slower RGR for sunflower. This species contrast was much stronger in deep shade (12% full sun) where RGR for I. parviflora had fallen to 0.090 d–1 whereas sunflower was only 0.033 d–1. Clearly, I. parviflora is more shade tolerant, and retention of a faster RGR in deep shade is due both to greater plasticity in LAR as well as a more sustained NAR. Adjustments in both photosynthesis and respiration of leaves contribute to maintenance of higher NAR in shade-adapted plants growing at low irradiance.
Within a moderate temperature range readily tolerated by vascular plants (10–35°C, see Chapter 14) processes sustaining carbon gain show broad temperature optima. By contrast, developmental changes are rather more sensitive to temperature, and provided a plant’s combined responses to environmental conditions do not exceed physiologically elastic limits, temperature effects on RGR are generally attributable to rate of canopy expansion rather than rate of carbon assimilation. In the early days of growth analysis, Blackman et al. (1955) inferred from a multi-factor analysis of growth response to environmental conditions that NAR was relatively insensitive to temperature, but whole plant growth was obviously affected, so that photosynthetic area (LAR) rather than performance per unit surface area (NAR) was responsible. Such inferences were subsequently validated.
Using day/night temperature as a driving variable, Potter and Jones (1977) provided a detailed analysis of response in key growth indices for a number of species (Table 6.2). Data for maize, cotton, soybean, cocklebur, Johnson grass and pigweed confirmed that 32/21°C was optimum for whole-plant relative growth rate (RGR) as well as relative rate of canopy area increase (RGRA). Both indices were lowest at 21/10°C. This was true for C4 as well as C3 species.
C4 species had a higher RGR and RGRA than C3 species, especially under warm conditions (Table 6.2)
All populations described in Potter and Jones (1977) maintained strict exponential growth. NAR could then be derived validly and temperature effects on NAR could then be compared with temperature effects on RGR and RGRA (Figure 6.3). With day/night temperature as a driving variable, most values for NAR fell between 10 and 20 g m–2 d–1. Correlation between NAR and RGR was poor (Figure 6.3). By contrast, variation in both RGR and RGRA was of a similar order and these two indices were closely correlated (Figure 6.3).
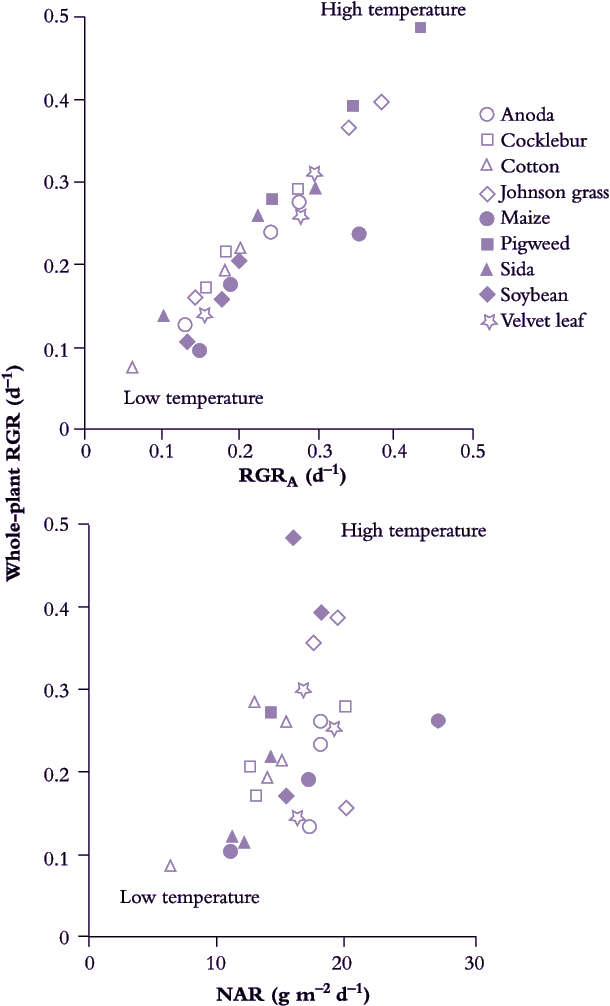
Figure 6.3 Variation in whole-plant RGR is linked to relative rate of canopy expansion (RGRA). Nine species (including C3 and C4 plants) grown under three temperature regimes (21/10 °C, 32/21 °C and 21/27 °C day/night) expressed wide variation in RGR that showed a strong correlation with RGRA but was poorly correlated with variation in NAR. Extent rather than activity of leaves appears to be more important for RGR response to temperature. (Based on Potter and Jones 1977)
A later chapter in this book, Chapter 14, explains the effect of temperature on growth of different plant species, with particular focus on adaptation to very low and very high temperatures.
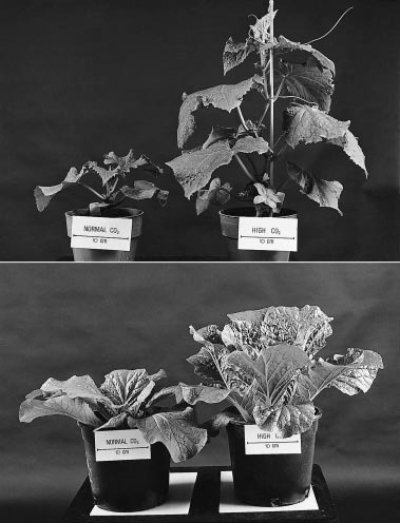
Figure 6.4 Early growth of cucumber (Cucumis sativus, top panel) and wong bok (Brassica pekinensis, bottom panel) is greatly enhanced in elevated CO2 (1350 ppm) compared with ambient controls (330-350 ppm). As shown here, that initial effect is still apparent after 52 d of greenhouse culture in nutrient rich potting mix. Scale bar = 10 cm. (Further details in Kriedemann and Wong (1984) and Table 6.3) (Photographs courtesy M. Whittaker)
Growth responses to elevated CO2 can be spectacular, especially during early exponential growth (Figure 6.4) and derive largely from direct effects of increased CO2 partial pressure on photosynthesis. C3 plants will be most affected, and especially at high temperature where photorespiratory loss of carbon has the greatest impact on biomass accumulation.
Global atmospheric CO2 partial pressure is expected to reach 60–70 Pa (600–700 ppm) by about 2050 so that growth response to a CO2 doubling compared with 1990s levels has received wide attention. Instantaneous rates of CO2 assimilation by C3 leaves can increase two- to three-fold in response to such elevated levels of CO2, but the short-term response is rarely translated into biomass gain by whole plants where growth and reproductive development can be limited by low nutrients, low light, low temperature, physical restriction on root growth (especially pot experiments) or strength of sinks for photoassimilate. Given such constraints, photosynthetic acclimation commonly ensues. Rates of CO2 assimilation (leaf area basis) by CO2-enriched plants, grown and measured under high CO2, will match rates measured on control plants at normal ambient levels.
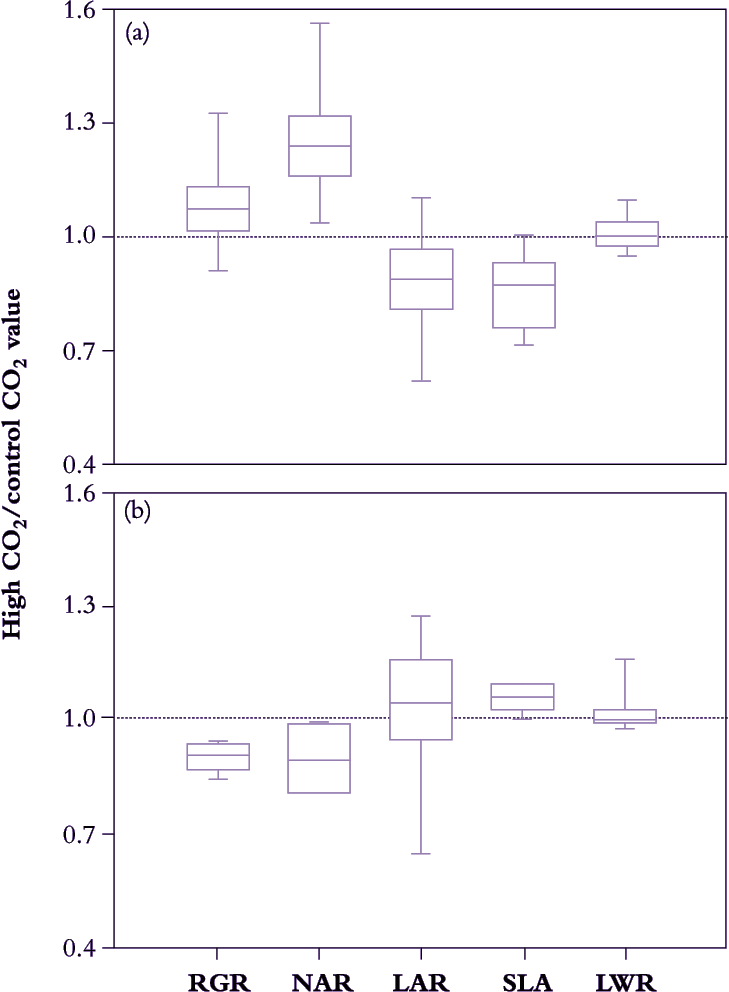
Figure 6.5. A survey of growth response to elevated CO2 (ratio of growth indices in 600-800 cf. 300-400 ppm CO2) in 63 different C3 species (a) and eight C4 species (b) reveals systematic differences in median values for growth indices that relate to photosynthetic mode. C3 plants show a positive response in NAR that results in slightly faster RGR despite some reduction in LAR. C4 plants reduce RGR under elevated CO2 due to diminished NAR. SLA of C3 plants is generally lower under elevated CO2, but increased somewhat in C4. LWR is essentially unchanged in either group (Based on Poorter et al. 1996)
Acclimation takes only days to set in, and because plant growth analysis commonly extends over a few weeks, CO2-driven responses in growth indices tend to be more conservative compared with instantaneous responses during leaf gas exchange. C4 plants will be less affected than C3 plants (see Chapter 2) so that broad surveys need to distinguish between photosynthetic mode. For example, in Figure 6.5, average NAR for 63 different cases of C3 plants increased by 25–30% under 600–800 ppm CO2 compared with corresponding values under 300–400 ppm CO2. However, NAR increase was not matched by a commensurate response in RGR, and decreased LAR appears responsible. CO2-enriched plants were less leafy than controls (i.e. lower LAR), but not because less dry matter was allocated to foliage (LWR was on average unaltered). Rather, specific leaf area (SLA in Figure 6.5) decreased under high CO2 so that a given mass of foliage was presenting a smaller assimilatory surface for light interception and gas exchange. Accumulation of non-structural carbohydrate (mainly starch; Wong 1990) is commonly responsible for lower SLA in these cases, and in addition generally correlates with down-regulation of leaf photosynthesis.
By contrast, in C4 plants LWR was little affected by elevated CO2, but in this case SLA did show slight increase with some positive response in LAR. However, photosynthetic acclimation may have been more telling because NAR eased and RGR even diminished somewhat under elevated CO2.
Global change, with attendant increase in atmospheric CO2 over coming decades, thus carries implications for growth and development in present-day genotypes and especially the comparative abundance of C3 and C4 plants. Elevated CO2 also has immediate relevance to greenhouse cropping. In production horticulture, both absolute yield and duration of cropping cycles are factors in profitability. Accordingly, CO2 effects on rate of growth as well as onset of subsequent development are of interest.
Young seedlings in their early exponential growth phase are typically most responsive to elevated CO2, so that production of leafy vegetables can be greatly enhanced. This response is widely exploited in northern hemisphere greenhouse culture. In commercial operations, ambient CO2is often raised three- to four-fold so that growth responses can be spectacular (Figure 6.4) but they tend to be short lived (Table 6.3), as accelerated early growth gives way to lower RGR. During each cycle of growth and development, annual plants show a sigmoidal increase in biomass where an initial exponential phase gives way to a linear phase, eventually approaching an asymptote as reproductive structures mature. If CO2 enrichment hastens this progression, a stage is soon reached where RGR is lower under elevated CO2 due to accelerated ontogeny.
The fall in RGR with time of exposure to high CO2 is illustrated for wong bok (Brassica pekinensis) in Table 6.3. Wong bok is a highly productive autumn and winter vegetable that serves as ‘spring greens’ and is especially responsive to CO2 during early growth. RGRA at c. 330 ppm CO2 was initially 0.230 d–1 compared with 0.960 d–1 at c. 1350 ppm CO2, but by 40–52 d, RGRA had fallen to 0.061 and 0.020 d–1 for control and CO2 enriched, respectively (Table 6.3). CO2-driven response in NAR and RGR also diminished with age, and especially where these larger individuals failed to sustain higher RGR past 18 d (Table 6.3). Nevertheless, a response in NAR was maintained for a further two intervals so that a CO2 effect on plant size was maintained (Figure 6.4).
Component analyses of RGR as exemplified above are also useful for analysing whole plant responses to the supply of various nutrients and to interactions between nutrient supply and light, temperature or CO2. There are also strong interactions between these ambient conditions and abiotic stresses such as drought and salinity that can be quantitatively analysed.
The following two sections consider the developmental stages of leaf, shoot and reproductive organ formation, and how this information contributes to different types of quantitative growth analyses.
Growth is an irreversible increase in plant size accompanied by a quantitative change in biomass. Development is more subtle and implies an additional qualitative change in plant form or function. Development thus lends ‘direction’ to growth and can apply equally well to a progressive change in gross morphology as to a subtle change in organ function, or to a major phase change from vegetative to reproductive development.
Increases in leaf area over time can be a useful basis for measuring plant growth rates than biomass increases, particularly as non-destructive and automated techniques for measuring leaf area are now available. Plant growth rate can be assessed as the relative increase in leaf area over time, by substituting total plant leaf area for total biomass in the conventional RGR equation.
\[\text{RGR}_\text{A} =\frac{\text{ln } LA_2 - \text{ln } LA_1}{t_2-t_1} \tag{6.14}\]
where RGRA is relative leaf expansion rate, LA is total leaf area and t is time at two time intervals, t1 and t2, preferably 2-3 days apart. This can be done by image analysis. This information can be extrapolated to whole plant growth rates as leaves, stems and roots generally maintain a balance in biomass that can be described by an allometric relationship.
In the first part of this section, growth of individual leaves is described at the cellular level of organisation, how this is influenced by light, and how much the photosynthetic activity of leaves changes with development.
The second part shows how root:shoot ratios change with availability of resources and the third part how these change with ontogeny (allometry).
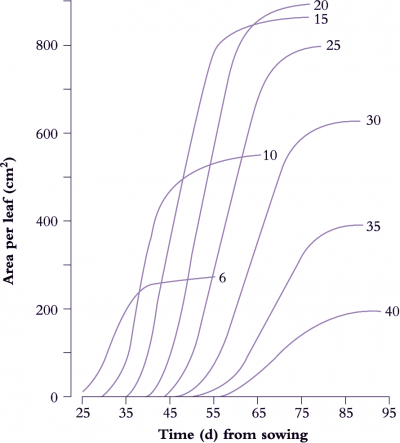
Figure 6.6. Leaf expansion in sunflower shows a sigmoidal increase in lamina area with time where rate of area increase and final size both vary with nodal position, reaching a maximum around node 20. The curves were drawn by hand through all data points (two measurements of leaf length (L) and leaf breadth (B) per week with area A estimated from the relationship A = 0.73 (L × B). Based on Rawson and Turner (1982) Aust J Plant Physiol 9, 449-460
Growth rate of individual leaves provides much useful information on plant growth, especially in response to changes in environment, as leaf growth can be measured over hours or even minutes. Rates of leaf elongation or individual leaf area expansion cannot be used to calculate whole plant relative growth rates, but they can be used to assess current rates of individual leaf growth and effects of a treatment on the rate of leaf emergence (“phyllocron”). Leaf elongation (increase in length of a given leaf per hour or per day) is a sensitive measure of leaf growth and can be accomplished electronically with a transducer, over minutes, manually with a ruler over 4-24 hours, or automatically with a digital photographic technique over intervals of days. Linear measurements with a transducer or ruler are particularly sensitive for monocots whose growth is largely one-dimensional.
Differences in canopy development result from the frequency of new leaf initiation and the time-course of lamina expansion. These can be inferred from comprehensive measurement of lamina expansion on successive leaves. Lamina expansion in both monocotyledons and dicotyledons is approximately sigmoidal in time and asymmetric about a point of inflexion which coincides with maximum rate of area increase. However there is a period of several days over which expansion rates are constant.
A determinate plant with large leaves such as sunflower (Figure 6.6) provides a typical example. Leaf area is shown as a function of time for eight nodes selected between node 6 and node 40. Final leaf area was greatest at node 20, but daily rates of expansion were uniform for leaves between nodes 10 and 25. Thus at any time between days 35 to 65, the daily rate of expansion of any leaf was the same. Slowest growth and smallest final size was recorded for node 40, adjacent to the terminal inflorescence.
Growth curves for monocots leaves are very similar, in that there is a period of several days during which the leaf has a constant rate of area expansion. Increases in leaf areas of cereals and other monocots are easier to measure than dicots as they grow only in length and not width, for the reason explained below.
Frequency of leaf initiation can be inferred from a more comprehensive family of such curves where early exponential growth in area for each successive leaf is recorded and plotted as log10 area versus time. This results in a near-parallel set of lines which intersect an arbitrary abscissa (Figure 6.7). Each time interval between successive points of intersection on this abscissa is a ‘phyllochron’ and denotes the time interval between comparable stages in the development of successive leaves. This index is easily inferred from the time elapsed between successive lines on a semi-log plot (Figure 6.7). Cumulative phyllochrons serve as an indicator of a plant’s physiological age in the same way as days after germination represent chronological age.
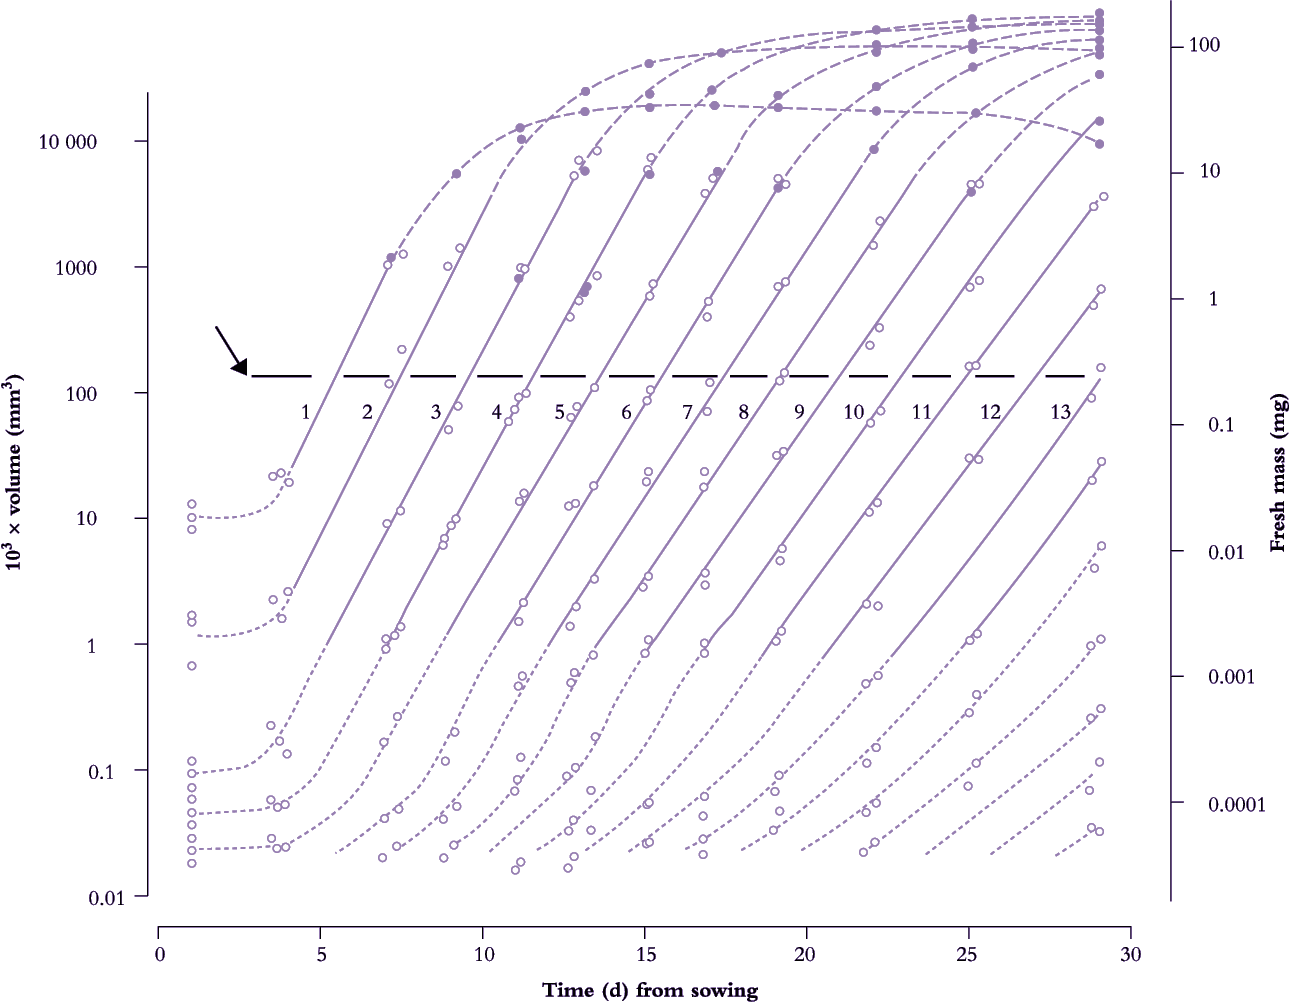
Figure 6.7. Leaves of subterranean clover achieve a 10-million-fold increase in size from primordium to final area (volume of primordia shown as dotted lines; leaf fresh mass shown as solid lines). Successive leaves are initiated and enlarge in a beautifully coordinated fashion revealed here as a family of straight lines on a semi-log plot. Intervals along an arbitrary abscissa (arrow at 100 × 10-3 mm3) that intersects theses lines represent time elapsed (about 1.8 d) between attainment of a given development status by successive leaves (phyllochron). Full-sized leaves exceed about 100 mm3 in volume. Based on Williams (1975) J Aust Inst Agric Sci 41, 18-26
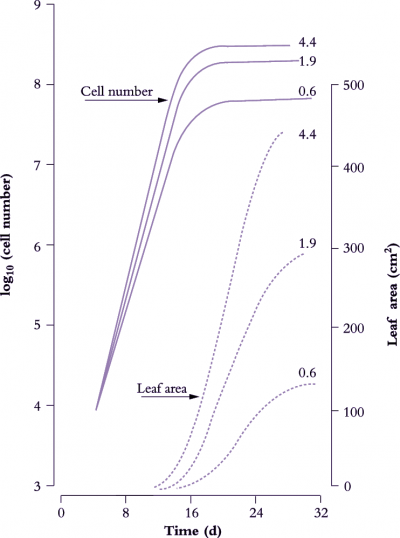
Figure 6.8. Leaves of cucumber (node 2 on plants in growth cabinets) show an approximately sigmoidal increase in area with time (broken lines) where final size and cell number vary with daily irradiance (0.6, 1.9 or 4.4 MJ m-2 d-1). During an initial exponential phase in area growth, cell number per leaf (solid lines) also increases exponentially. The slope of a semi-log plot (hence relative rate of cell division) is higher under stronger irradiance. Cell number per leaf approaches asymptote as the rate of leaf area increase becomes linear. Based on Milthorpe and Newton (1963) J Exp Bot 14, 483-495
Leaves are first discernible as tiny primordia which are initiated by meristems in accord with a genetically programmed developmental morphology. They undergo extensive cycles of cell division (peak doubling time about 0.5 d). Leaf growth is anatomically different in grasses (monocotyledonous species) and broad-leafed (dicotyledonous) plants.
Primordia of broad-leafed plants undergo extensive cycles of cell division and enlargement to form recognisable leaves with petioles that elongate and lamina that unfold and expand. Lamina expansion follows a coordinated pattern of further cell division and cell enlargement that is under genetic control but modified by the environment, particularly light. Early growth of the leaf is driven primarily by cell division, and cell number per leaf increases exponentially prior to unfolding. Cell division can continue well into the expansion phase of leaf growth, so that up to 90% of cells in a mature dicot leaf can have originated after unfolding. Cell division finishes about the time the leaf enters its period of linear rate of area expansion, so this period of maximum leaf expansion rate is due to expansion of pre-formed cells.
Primordia of grasses and other monocotyledonous species are hidden from view. All phases of cell growth occur at the base of the leaves which are usually not exposed to the environment. Cell division is confined to basal meristems which give rise to files of cells and a linear zone of cell expansion and differentiation. The emerging blade therefore is composed of cells that are fully expanded, and the elongation of that leaf takes place by addition of fully expanded cells from below.
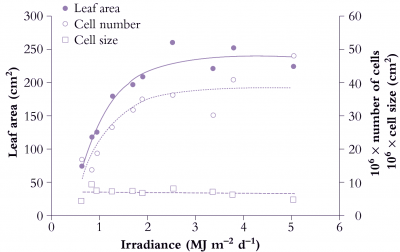
Figure 6.9. Area of individual leaves on cucumber (Cucumis sativus) responds to daily irradiance and reaches a maximum above about 2.5 MJ m-2 d-1. Area increase (node 2 in this example) is due to greater cell number under stronger irradiance. Mean size of mesophyll cells is little affected and has no influence on area of individual leaves. Based on Newton (1963) J Exp Bot 14, 458-482
Light is the main variable affecting leaf growth rate, both the rate of leaf area expansion, final size, as well as cell shape as mentioned in the previous section.
Figure 6.8 shows the effect of light level on the rate of leaf area expansion in a cucumber leaf. As in all dicot leaves, the rate of lamina expansion is determined largely by the number of cells produced, with final cell area being unaffected (Figure 6.9). Rate of cell division during this early phase is increased by irradiance, so that potential size of these cucumber leaves at maturity is also enhanced. The upper curves in Figure 6.8 (highest irradiance), cell number per lamina reaches a plateau around 20 d, but area continues to increase to at least 30 d. Expansion of existing cells is largely responsible for lamina expansion between 20 and 30 d after sowing.
Figure 6.9 shows the effect of a range of light levels on final leaf area, and shows that area is strongly dependent on light level up to 2 MJ m-2 d-1, and that the increased area has been achieved by more cells rather than larger cells.
A similar light response curve would be shown by monocot leaves, and with similar contributions from cell number versus cell size. The difference between monocots and dicots is that the cell number is determined in the basal meristematic zone, before the lamina emerges. This zone is not exposed to the light environment, so cell division activity in monocots is controlled by substrates or signals arising in the older expanded leaves.
When dicotyledonous leaves are very young and first unfold they have low rates of net photosynthesis (expressed per unit area) so have to import carbon from other leaves to support their growth. But as they expand their rates increase rapidly such that within a few days they can assimilate all their own carbon requirements and export excess (Figure 6.10).
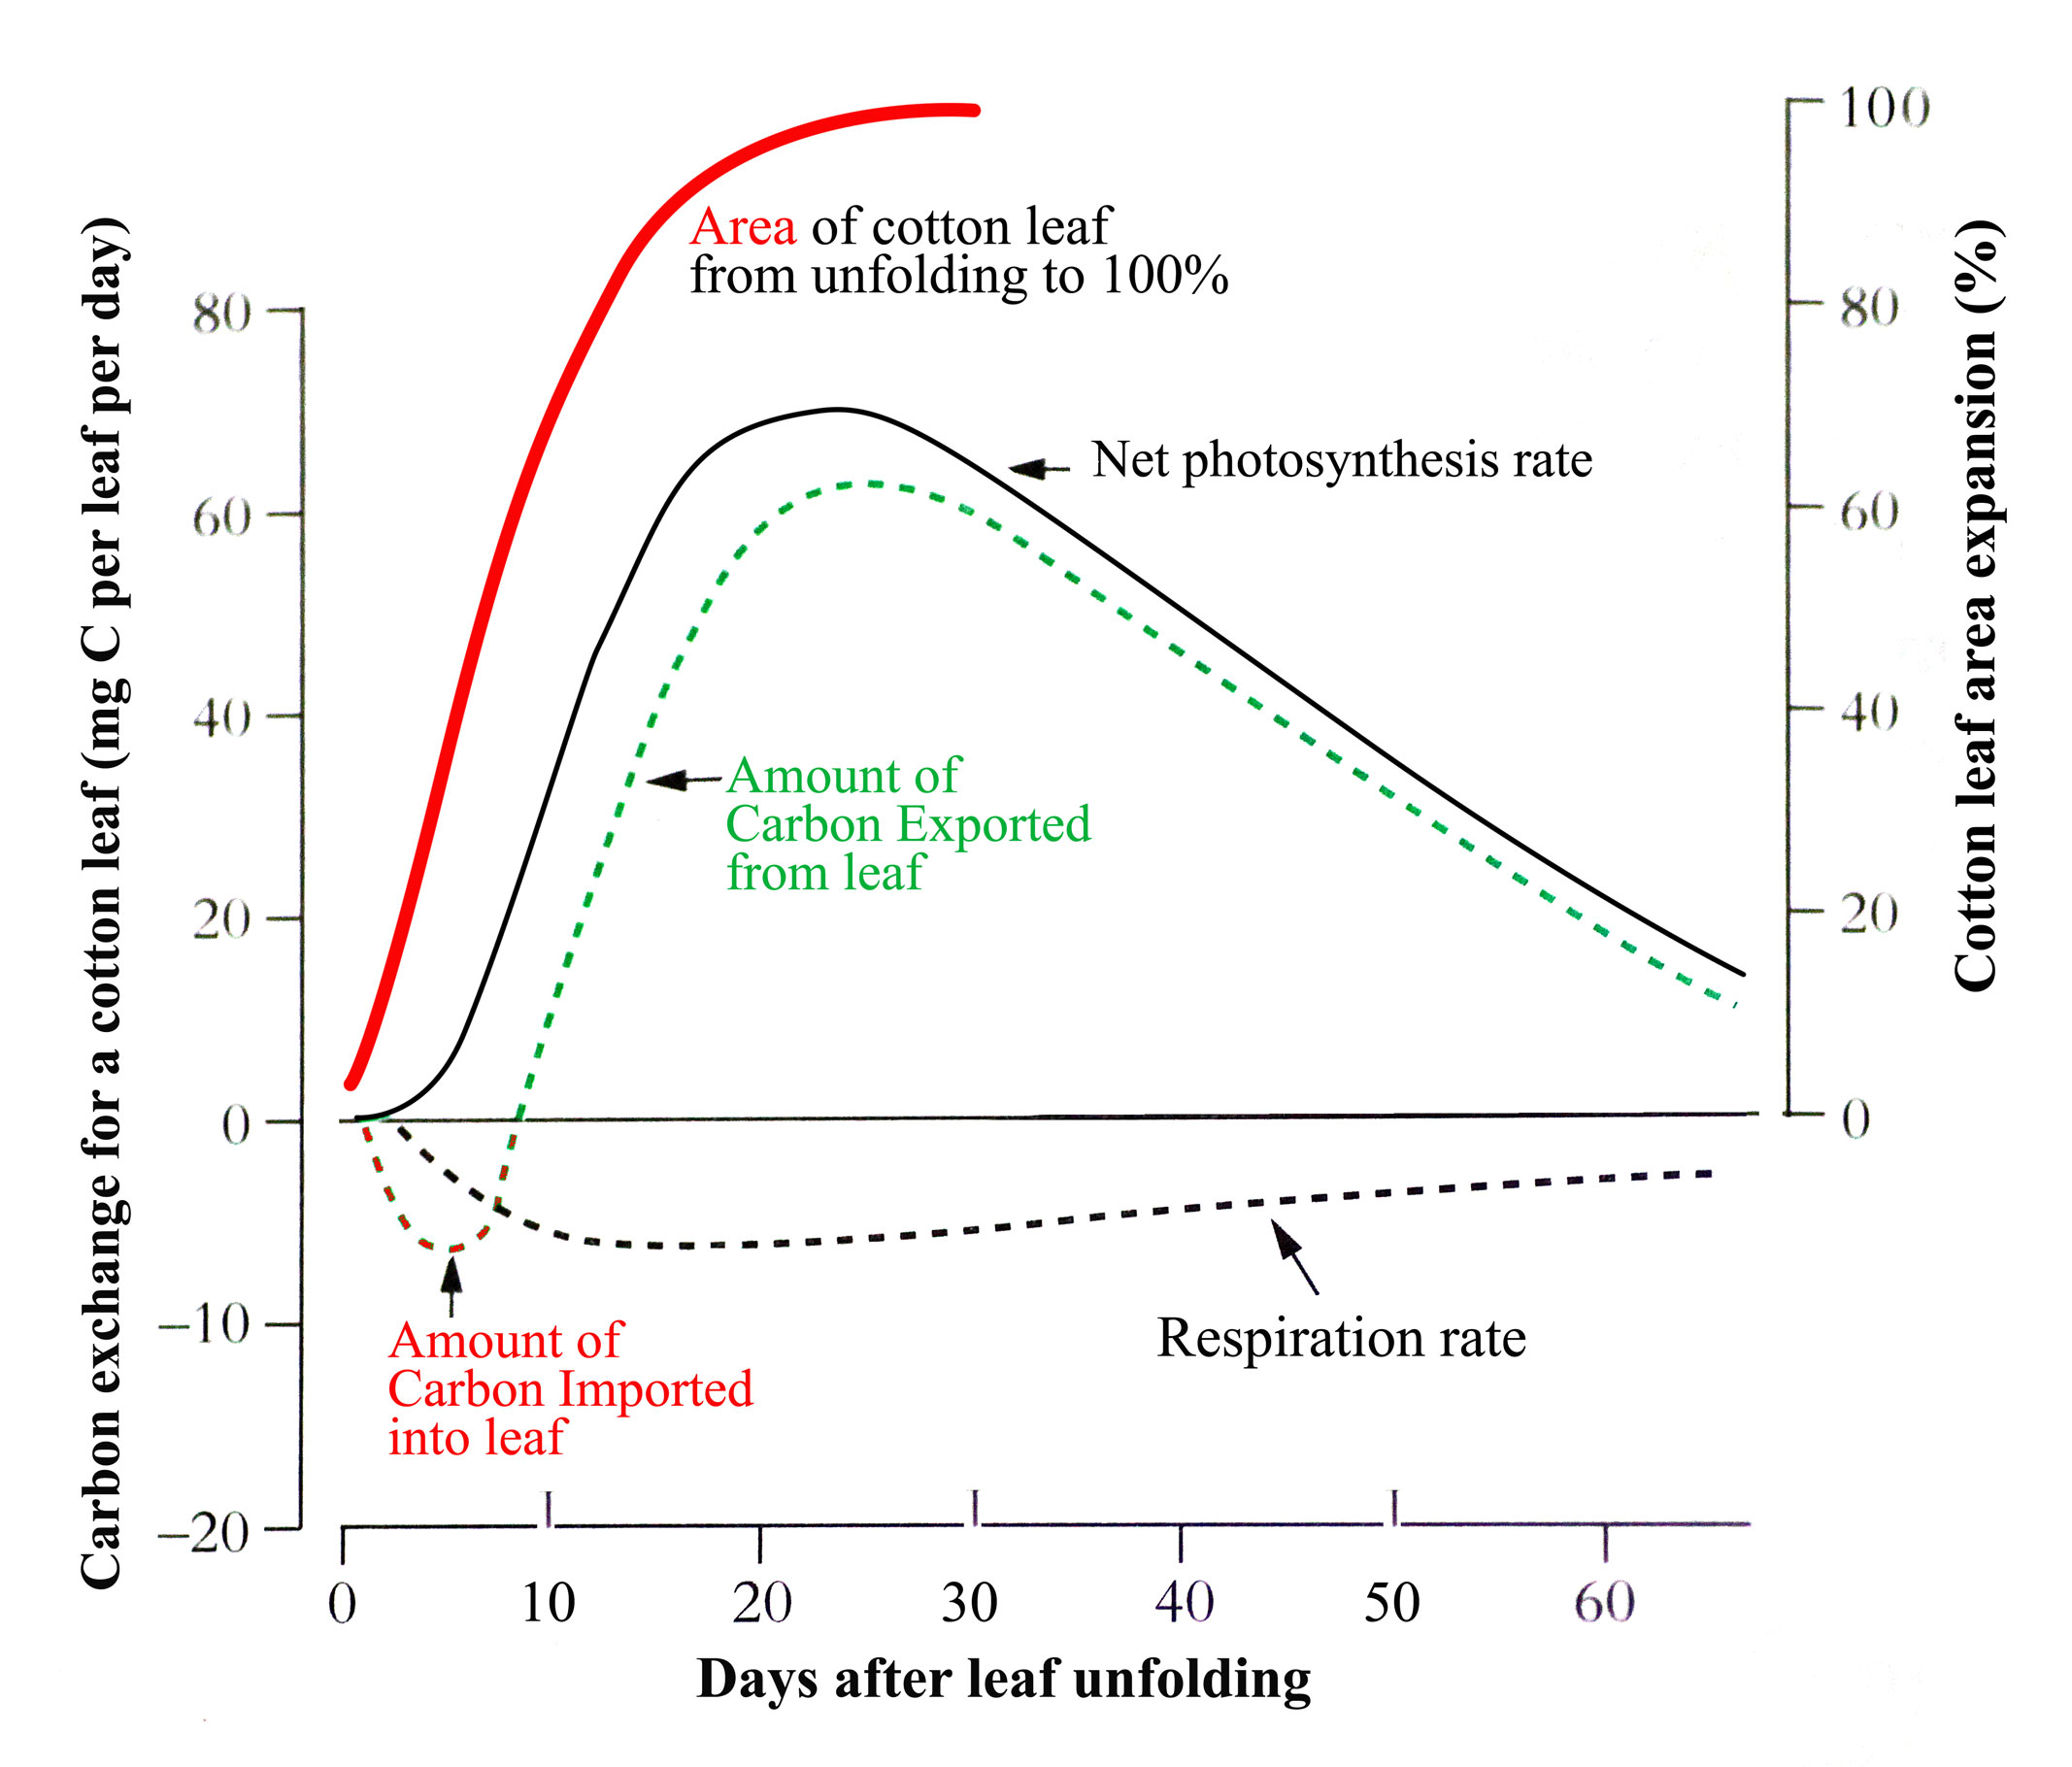
Figure 6.10. Change in net photosynthesis rate as a cotton leaf unfolds, expands, reaches maximum area and ages. An initial phase of carbon import helps sustain early expansion but by the time the leaf is 70% of its final area it is self sufficient for carbon and exporting excess. From Constable and Rawson (1980) Aust J Plant Physiol 7, 89-100 and 539-553
In the example for cotton in the figure, this self-sufficiency occurs when the leaf is about 70% of its final area. Typically, net photosynthesis rate will reach a maximum before the leaf has fully expanded though this can range from 25 to 100% of final area across species. Photosynthesis rate will then remain at that maximum or start to decline with further leaf expansion before leaf aging, lessening requirement for the carbon produced, and environmental factors accelerate the decline. Because the amount of carbon produced by a leaf is the product of two largely independent variables, its photosynthesis rate x its area, leaf carbon production can continue to increase while photosynthesis rate is stable or even declining.
Monocotyledonous leaves grow from their base where the very young expanding parts of the leaf are fully enclosed inside a sheath created by the surrounding leaf bases. The emerged parts of the leaf blade are already approaching full expansion as they emerge from the sheath and unroll. Photosynthesis rates of those exposed parts are already close to their maximum. Once the whole blade is exposed, photosynthesis rate and leaf carbon production follow plateau and declining patterns similar to those described for dicots though magnitude and duration differ amongst species and environments.
When doing experiments that investigate the effects of environmental treatments on photosynthesis, it is important bear in mind the continuous progression in photosynthesis rate between growing, recently fully expanded and aging leaves. Leaves should be compared that are of equivalent age and stage of development, particularly if single leaves are being measured to represent a whole plant or a breeding line. If the eventual aim of the experiment is to compare or select for carbon production, the area of the leaf must also be known since photosynthesis rate and fully expanded area of a leaf are not linked. Leaves of some dicotyledonous species take a few days to reach full expansion while others take weeks.
Roots, stems and leaves are functionally interdependent and these three systems maintain a dynamic balance in biomass which reflects relative abundance of above-ground resources (light and CO2) compared with root-zone resources (water and nutrients) (Poorter et al. 2012). Whole-plant growth rate and summary measures such as root:shoot ratio are thus an outcome of developmental stage and of environmental influences.
Change in root:shoot ratio during a plant’s life cycle is part of an intrinsic ontogeny, but growth rates of roots and shoots continually adjust to resource availability with photoassimilate (hence biomass). In herbaceous plants, root:shoot ratios typically decrease with age (size) due to sustained investment of carbon in above-ground structures (root crops would be a notable exception). Developmental morphology is inherent, but expression of a given genotype will vary in response to growing conditions (hence phenotypic plasticity).
Irradiance is a case in point where shoot growth takes priority in low light, whereas root growth can be favoured under strong light. For example, Evans and Hughes (1961) grew Impatiens parviflora at five light levels and demonstrated a steady increase in root mass relative to whole-plant mass (root mass ratio) from 7% to 100% full sun. Stem mass ratio showed the opposite sequence. Leaf mass ratio increased somewhat at low light, but increased SLA was far more important for maintenance of whole-plant RGR in this shade-adapted species.
If light effects on root:shoot ratio are translated via photosynthesis, then CO2 should interact with irradiance on root:shoot ratio because carbon assimilation would be maintained by a more modest investment in shoots exposed to elevated CO2. Chrysanthemum morifolium behaved this way for Hughes and Cockshull (1971), returning a higher NAR due to CO2 enrichment under growth cabinet conditions despite lower LAR which was in turn due to smaller leaf weight ratio. Adjustment in SLA exceeded that of leaf weight ratio, and so carried more significance for growth responses to irradiance × CO2.
Consistent with shoot response to above-ground conditions, root biomass is influenced by below-ground conditions where low availability of either water or nutrients commonly leads to greater root:shoot ratio. For example, white clover (Trifolium repens) growing on a phosphorus-rich medium increased root:shoot ratio from 0.39 to 0.47 in response to moisture stress; and from 0.31 to 0.52 when moisture stress was imposed in combination with lower phosphorus (see Table 1 in Davidson 1969b). A positive interaction between low phosphorus and low water on root:shoot ratio was also evident in perennial ryegrass (Lolium perenne) grown on high nitrogen. In that case, root:shoot ratio increased from 0.82 to 3.44 in response to moisture stress when plants were grown on low phosphorus in combination with high nitrogen.
Adding to this nutrient × drought interaction, a genotype × phosphorus effect on root:shoot ratio has been demonstrated by Chapin et al. (1989) for wild and cultivated species of Hordeum. Weedy barleygrass (H. leporinum and H. glaucum) was especially responsive, root : shoot ratio increasing from about 0.75 to 1.5 over 21 d on low phosphorus. By contrast, cultivated barley (H. vulgare) remained between 0.5 and 0.75 over this same period. Held on high phosphorus, all species expressed comparable root:shoot ratios which declined from around 0.55 to about 0.35 over 21 d. High root:shoot ratios on low phosphorus in weedy accessions would have conferred a selective advantage for whole-plant growth under those conditions, thus contributing to their success as weeds.
Even stronger responses to phosphorus nutrition have been reported for soybean (Fredeen et al. 1989) where plants on low phosphorus (10 µM KH2PO4) invested biomass almost equally between roots and shoots, whereas plants on high phosphorus (200 µM KH2PO4) invested almost five times more biomass in shoots than in roots (daily irradiance was about 30 mol quanta m–2 d–1 and would have been conducive to rapid growth).
Root:shoot ratios are thus indicative of plant response to growing conditions, but ratios are not a definitive measure because values change as plants grow. Trees in a plantation forest would show a progressive reduction in root:shoot ratio, and especially after canopy closure where a steady increase in stem biomass contrasts with biomass turnover of canopy and roots and thus predominates in determining root:shoot ratio.
Broad generalisations are that root:shoot ratio increases with nutrient deficiency and moisture stress or under elevated CO2, but decreases in strong light. Too often, however, reports of treatment effects on root:shoot ratio have can overlooked differences in developmental ontogeny or size, and real responses may be obscured. Allometry then becomes a preferred alternative where repeated measurements of size or mass provide an unambiguous picture of carbon allocation.
During whole-plant growth in a stable environment, roots and shoots maintain a dynamic balance such that
\[y=bx^k \tag{6.17}\]
Where y is root biomass and x is shoot biomass. More generally, x and y can be any two parts of the same organism that are growing differentially with respect to each other, but root–shoot relations are the most common candidate in such analyses of plant growth.
The allometric equation \(y=bx^k\) (Equation 6.17) was formalised by Huxley (1924) and can be ln transformed to become
\[\text{ln } y= \text{ln }b + k\text{ln }x \tag{6.18}\]
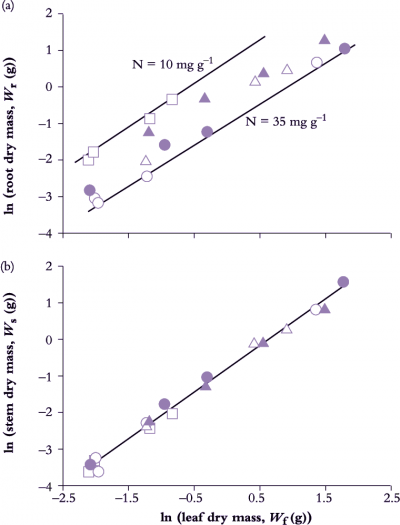
Figure 6.11. Seedlings of Eucalyptus grandis growing in aeroponic culture on five different nitrogen treatments show a strict allometry between root (Wr) and leaf growth (Wf) (a) as well as between stem (Ws) and leaf growth (b). With all other nutrient elements non-limiting, nitrogen was supplied at five relative addition rates (d-1), namely 0.12 (open circles), 0.10 (solid circles), 0.08 (open triangles), 0.06 (solid triangles) and 0.04 (open square). Root:leaf allometry in seedlings on the lowest relative addition rate (plant [N] 10 mg g-1) shows a similar slope but a higher intercept compared with plants maintained continuously on the highest rate (plant [N] 35.5 mg g-1). Stem:leaf allometry (b) was highly conserved regardless of N addition rate with a slope (k) of 1.261 reflecting a steady commitment to stem growth over leaf growth in these tree seedlings. Based on Cromer and Jarvis (1990) Aust J Plant Physiol 20, 83-98
This formulation enables a straight-line plot of ln y as a function of ln x with slope k (i.e. the allometric coefficient) and intercept ln b. This empirical model does not explain the nature of growth controls between roots and shoots but does offer a simple description which is not confounded by plant size. Moreover, any departure from a particular root : shoot relationship is immediately obvious, and sources of variation in root : shoot ratio can be resolved into starting conditions (differences in intercept, ln b) versus biomass partitioning during growth (differences in slope, k).
Leaf, stem and root growth under controlled conditions in Eucalyptus grandis seedlings demonstrate such application (Figure 6.11). Nitrogen input in nutrient spray chambers was used as a driving variable for growth where five relative addition rates generated a wide range in whole-plant RGR (from 0.039 d–1 0n lowest to 0.111 d–1 on highest rate).
Data from all treatments and harvests were pooled to reveal a strict allometric relationship between root and leaf growth (Figure 6.11) with a nitrogen effect on intercept but not slope. Nitrogen nutrition had influenced biomass allocation to the extent that low addition rate had initially promoted root growth relative to leaves (hence higher intercept), but subsequent to this early adjustment, and once growth had stabilised, biomass allocation to roots and leaves maintained a constant relationship irrespective of addition rate. In this case k = 0.982, indicating a net bias towards leaf growth over root growth — a ‘net bias’ because carbon loss via excretion, root renewal and respiration was not measured so that more photoassimilate would have been allocated to roots than was fixed in biomass.
Stem and leaf biomass also maintained a strict allometric relationship (Figure 6.11) where k = 1.261. A value for k greater than unity implies a consistent bias towards stem growth relative to canopy growth, as would be expected in a eucalypt with a high rate of stem growth (and favoured in plantation forestry). Significantly, nitrogen treatment was without effect on either intercept or slope (Figure 6.11) and emphasises the highly conserved relationship between leaves and stem in these seedlings.
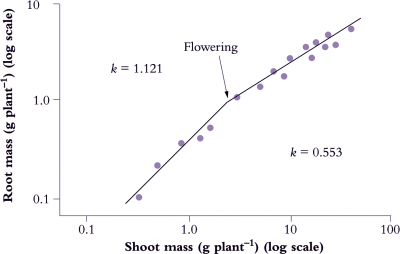
Figure 6.12. Root:shoot allometry in Italian reygrass (Lolium multiflorum) shows an abrupt change with flowering (log-log plot). A change in allometric coefficient (k) for this species from 1.121 to 0.553 indicates a shift in biomass allocation from root growth towards shoot growth following emergence of inflorescences. Mean values for k during vegetative cf. Reproductive phase from several accompanying species were 1.145 and 0.627 respectively. Based on Troughton (1956) J Brit Grassland Soc 11, 56-65
Developmental events also influence allometry and Italian ryegrass (Lolium multiflorum) provides a nice example (Figure 6.12) where a log–log plot of root mass as a function of shoot mass showed an abrupt change in slope when flowering occurred. In that case, k decreased from 1.121 to 0.553, and although shoot dry mass was about 10 times root biomass, a change in allometry was clearly evident.
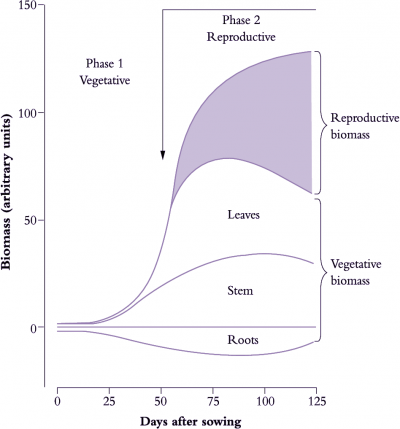
Figure 6.13. A notional distribution of biomass during the vegetative growth and reproductive development in an idealised annual plant such as a cereal or grain legume over c. 125 d. Whole-plant biomass follows a sigmoidal pattern with a near-exponential increase during vegetative growth and an asymptotic increase during subsequent maturation. Reproductive structures have by then become dominants sinks for photoassimilate, drawing 90-95% of their carbon from current photosynthesis but also mobilising stored assimilate from leaves, stems and roots, which lose biomass during that process (Original drawing P.E. Kriedemann; based on various sources)
Annual plants show a sigmoidal increase in total biomass during each life cycle (Figure 6.13) where a near-exponential vegetative phase (Phase 1) gives way to a reproductive phase (Phase 2) starting with flower initiation. In effect, Phase 1 sets a potential for reproductive yield whereas events during Phase 2 determine realisation of that potential because nearly all of the photoassimilate stored in reproductive structures (90–95% in cereal grains, for example) comes from carbon fixed subsequent to initiation. Reproductive organs then become dominant sinks for current photoassimilate as well as carbon-based resources previously stored in leaves and stems.
The carbon content of shoot components changes dramatically following onset of reproductive development. As shown for lupin in Figure 6.14, the dynamic balance between leaves and stem that had been previously maintained during vegetative growth is now replaced by an accelerated senescence of leaves and loss of non-structural carbohydrates from leaves plus stems to provide assimilates for the developing pods. At full maturity, reproductive structures in lupin account for about 50% of above-ground biomass, with seeds accounting for about two-thirds of that investment (Figure 6.14). In most grain or seed crops, the mature reproductive structure accounts for 50% of the above-ground biomass (Table 6.4).
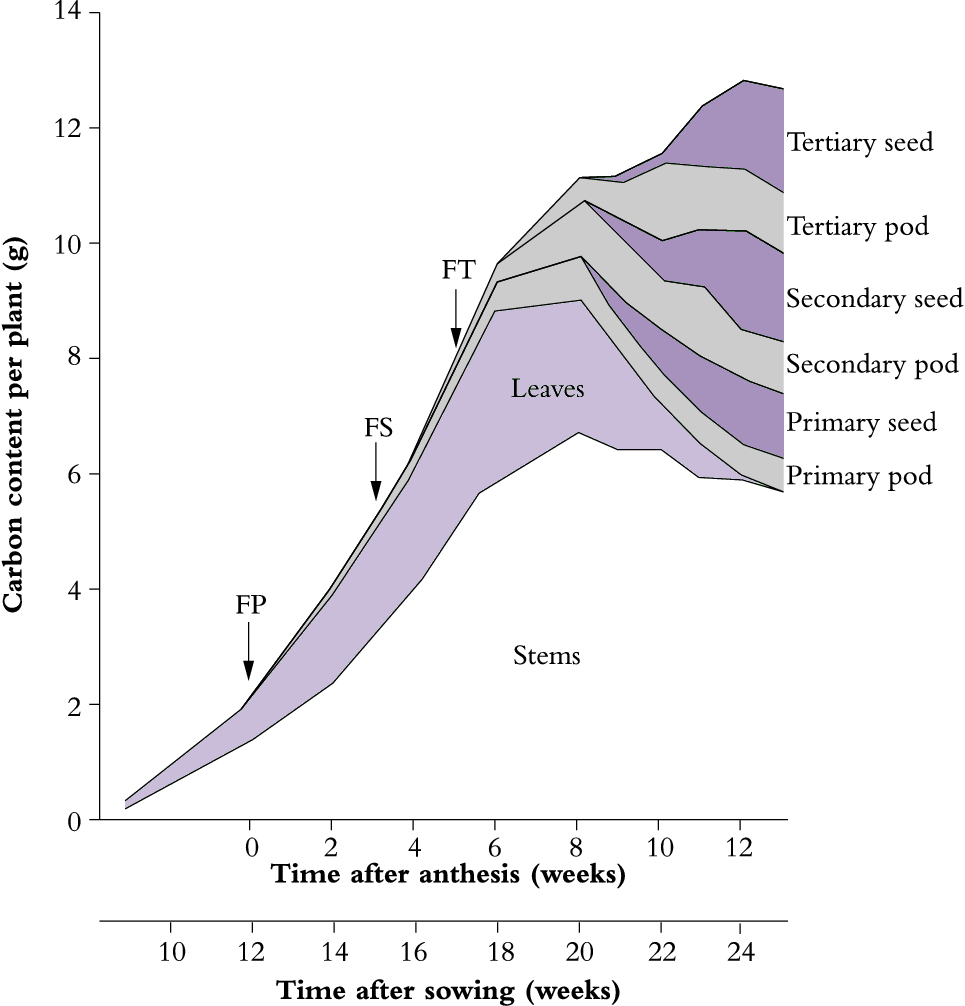
Figure 6.14. An unirrigated crop of lupin (Lupinus angustifolius cv. Unicrop) shows major redistribution of plant carbon from vegetative to reproductive structures during grain filling. This cultivar is indeterminate with successive cycles of reproductive development. FP, FS and FT indicate commencement of flowering on primary, secondary and tertiary shoots respectively. Seed carbon increased exponentially over the period 8-12 weeks after anthesis coinciding with leaf loss and some reduction in stem carbon. Nearby irrigated lupins retained leaves much longer. Based on Pate et al. (1980) Aust J Plant Physiol 7, 283-297
In wheat, also, assimilates are redistributed from stems to grains, more so when photosynthesis is limited (Rawson and Evans 1971). Remobilisation of stem reserves into grain is particularly important in a terminal drought. In wheat, stem reserves might contribute a high proportion to grain weight, and account for 80% of the carbon source rather than 10% as in well-watered conditions. But because grains are much smaller after drought, the absolute amount of carbon transported from the stem may be similar to that moved in good conditions. Percentages can be misleading.
In nature, a combination of ecological factors and life cycle options has led to wide variation in reproductive effort by vascular plants so that dry matter invested in reproductive structures relative to vegetative biomass will vary accordingly. For example, late successional rainforest species which combine shade adaptation with longevity are characterised by large propagules where massive seed reserves buffer young seedlings against shortfalls in carbon supply due to deep shade or dry spells. By contrast, early successional (pioneer) species on disturbed sites benefit by producing a large number of widely disseminated seeds. Their reproductive effort is best invested in number rather than size, and carries an added advantage that at least some viable seed will be produced even under stressful conditions. Weedy barleygrass is a case in point where Chapin et al. (1989) report that these species produce 4.5-fold more grains, but they are only one-sixth the size of cultivated barley. Ripening patterns also differed where grains matured synchronously in cultivated barley, but matured and dehisced progressively from tip to base in ears of barleygrass.
The term “harvest index” is used in agriculture to quantify the yield of a crop species versus the total amount of biomass that has been produced. The commercial yield can be grain, tuber or fruit. Harvest index can apply equally well to the ratio of yield to total plant biomass (shoots plus roots) but above-ground biomass is more common because root mass is so difficult to obtain.
The harvest index of the lupin plants shown in Figure 6.14 was about 0.33. Potential values for the harvest index of various crop and horticultural species are shown in Table 6.4.
Domesticated plants have been subjected to sustained selection pressures on reproductive development by humans (Table 6.4) and now reflect wide variation from tuber-forming species such as potato, where over 80% of plant biomass is harvested as storage organs, to high-value flower crops such as tulip where blooms might represent only 20% of the final biomass of whole plants. Mid-range are legumes, cereals and other grain crops where human selection for yield has led to a notable increase in HI. Wheat, for example (Figure 6.15), increased from between 0.30 and 0.35 to almost 0.55 over a century, while barley and rice have shown similar trends.
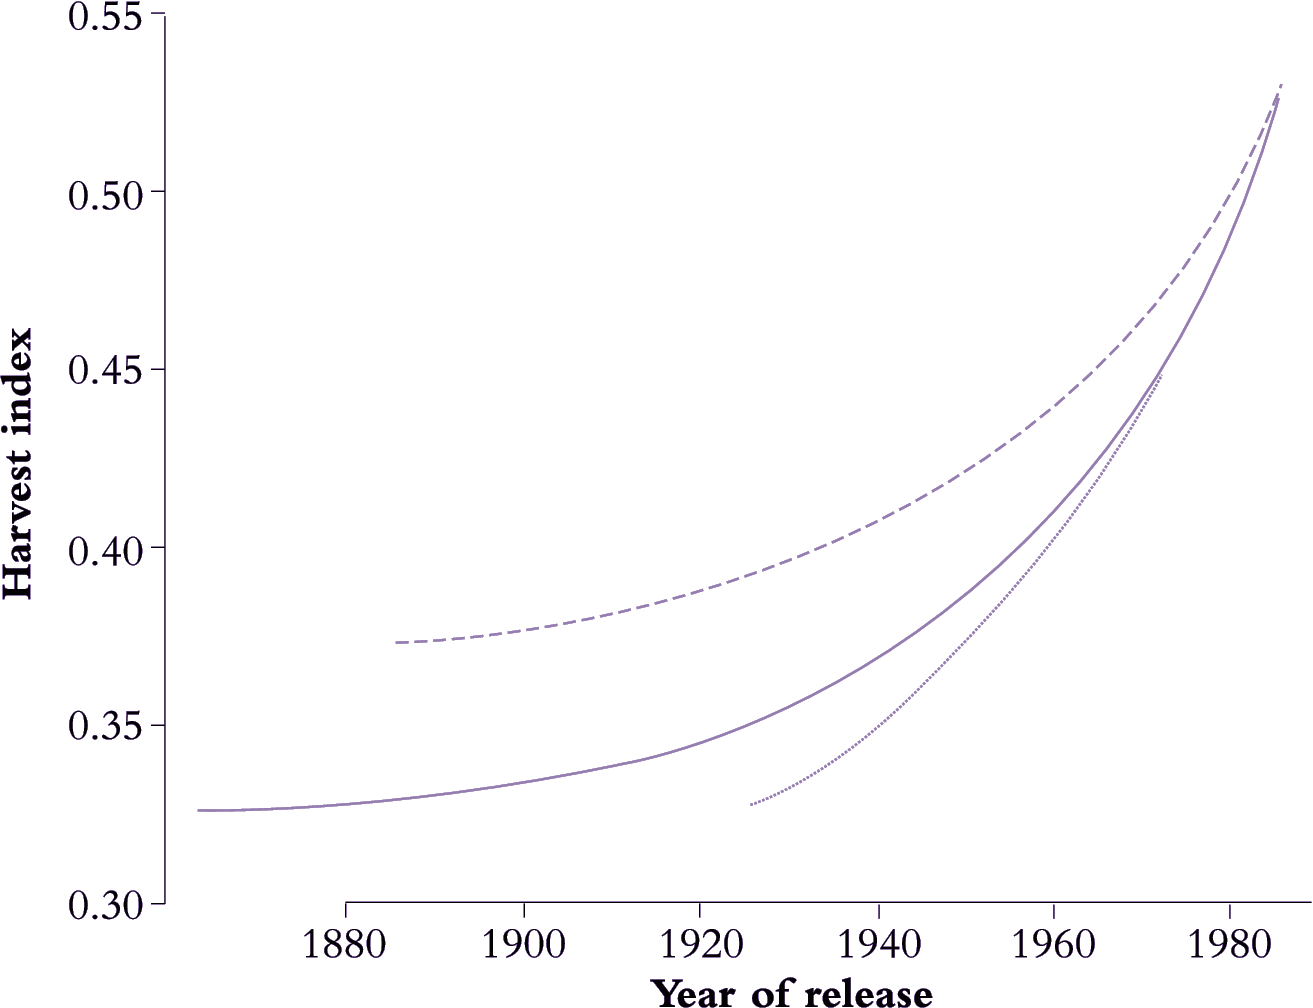
Figure 6.15. A century of breeding and selection has produced some solid gains in harvest index (HI) (ratio of grain to whole shoot biomass) for crop species including barley (dashed line), wheat (solid line) and rice (dotted line) as shown here. Introduction of dwarfing genes to reduce lodging under high-nutrient cultivation was a major factor in this achievement. Cereal architecture necessitates some trade off between stout stems to support heavy ears and a retention of leaf area to generate photoassimilate. HI will eventually reach a ceiling set by those constraints. Based on Evans (1993)
Yield improvement in cereals, cotton, peanuts and soybean which is similarly due to substantial increase in HI, emphasising (Gifford et al. 1984) that partitioning of photoassimilate rather than generation of whole-plant biomass was responsible for such yield improvement.
Yield of a cereal crop such as wheat or rice depends on the numbers of seeds that mature on a plant, and their size. Carbon partitioning during vegetative development and before flowering influences the number of flowers that are formed on a plant, as the reproductive sink competes with growing tissue in leaves, stems and roots for carbon supply. Carbon partitioning after flowering influences the rate of seed growth and the final size of the seed.
Major sources of variation in yield can be identified via a simple yield component model. Taking cereals as an example, final grain yield (g m–2) is a product of grains per square metre and mass per grain.
Planting density and fertilizer can further influence yield components, as shown in the example in Table 6.5. In cereals, lateral shoots are called “tillers”, and the mature inflorescence that forms on a mature tiller an “ear”. Ears m–2 is in turn an outcome of planting density (plants m–2), tillers per plant and ears per tiller. Not all tillers produce an ear, especially if the density is high and the plants then limited by light as well as possibly by fertilizer or water.
Some yield components such as mass per grain are especially stable, others such as ears m–2 and grains per ear vary widely with seasonal conditions or according to original planting density (Table 6.5). In that case (Insignia wheat at Glen Osmond, South Australia), mass per grain was highly conserved (33–35 mg) whereas tillers per plant varied from 41 at lowest planting density to only three at highest density. Significantly, yield variation was buffered by compensatory responses in yield components. For example, effects of low planting density were offset by production of more tillers per plant and more ears per tiller. Grains per ear then determine potential yield so that growing conditions would have become crucial for realising such potential via grain retention and filling
Genotype × environment interactions lead to huge variation in cereal grain yield and have been exploited for yield improvement. Universally, high grain number per square metre is a prerequisite for high yield and can be achieved via more ears per square metre and/or more grains per ear. In wheat and barley, grain number per ear has been primarily responsible for gains in yield; ears m–2 and mass per grain have not shown consistent increase (see Evans 1993 and literature cited).
For a commercial crop, mass per grain is the most important single component, and determines its use. The size (and sometimes shape) of the harvested product determines the value of the crop to the grower. A small or “pinched” wheat grain is of little value as it cannot be milled for flour and is fed to animals.
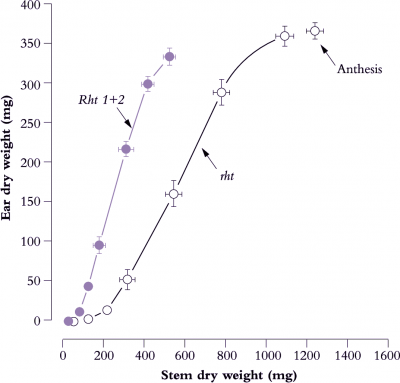
Figure 6.16. Early growth of reproductive tissues relative to stem mass in dwarf genotypes foreshadows faster ear development and higher HI. The tall and productive Mexican spring wheat (Yaqui 50, designated rht) eventually produces heavier ears, but returns a lower HI at maturity. Introduction of two major dwarfing genes (Rht 1 + Rht 2) resulted in shorter stems. Consequently developing ears were subject to less competition for photoassimilate during early differentiation and for grain filling subsequent to anthesis. Bars represent standard errors. Based on Bush and Evans (1988) Field Crops Res 18, 243-270
A major impetus to improve HI in cereals came from the introduction of dwarfing genes. In primitive wheats, and tall plants generally, reproductive structures have to compete with rapidly extending stems for photoassimilate, but dwarf cultivars alleviate such competition and enable a shift in carbon partitioning to ears. Early growth of ears and stems in two lines of a Mexican spring wheat (Figure 6.16) illustrate this principle. A steeper slope in the dwarf line (designated Rht 1+2) compared with the tall line (rht) implies greater allocation of photoassimilate to ear growth relative to stem growth. The two dominant dwarfing genes (Rht 1 plus Rht 2) which are insensitive to gibberellic acid result in short stems and enhanced yield. Such genotypes formed the basis of the Green Revolution.
Tall wheat commonly “lodges” (falls over) in nitrogen-rich conditions, and dwarf wheats were originally developed to overcome this problem. Crop physiologists and breeders subsequently recognised the yield advantage from improved partitioning of photoassimilate. Continuing selection for yield within the semidwarf background, which became common after the 1970s in both spring and winter wheats, has seen further yield progress with little change in plant height. Yield has improved further in spring wheats (Sayre et al 1997; Sadras and Lawson 2011) and in winter wheats (Shearman et al 2005) but yield progress in more recent varieties is associated with notable increases in total biomass. This has occurred in both spring wheats (Sadras and Lawson 2011) and winter wheats (Shearman et al 2005; Zheng et al 2011). Also whereas past yield progress in wheat has always been associated with more grains m-2 and unchanged or smaller grains, yield gain in recent varieties in some cases has been linked to heavier grains (e.g. Zheng et al 2011). The switch from higher harvest index to greater biomass may reflect limits to harvest index, now around 0.5 for the best varieties about 80-100 cm in stature, while the appearance of newer varieties with heavier grains may reflect pressure from grain processors. Either way the changes point to the power of empirical selection.
Some room still exists for further improvement in shoot HI compared with 1980s values (Figure 6.15) but there is a corollary. If shoot biomass remains unchanged, further improvement in HI implies further reduction in leaf and stem mass. Considering leaves, specific leaf area (area:mass ratio or SLA) will have a finite limit for structural reasons so that the area of CO2-assimilating tissue servicing those enlarged sinks must also reduce as mass is reduced. Net assimilation per unit area (NAR) will therefore need to increase even further if potentially higher yields are to be realised. This could be achieved by either increases in photosynthetic potential or in more efficiency use of the energy produced.
The following section deals with respiratory efficiency and plant growth.
A significant amount of the CO2 fixed by photosynthesis is respired to produce the energy needed for production of new organs and maintenance of old ones. This is often termed a “cost”.
Costs associated with growth and maintenance of vascular plants can be represented as biomass equivalents. Calculations for dry matter utilisation during growth and development (Table 6.6) show that respiratory loss is substantial and can range from about 20-40% of the dry matter produced.
During growth and development (Table 6.6) a fall in structural growth rate has been accompanied by a fall in whole-plant respiration, while the amount of photosynthate allocated to storage has risen. Overall, respiration accounts for a significant fraction of photoassimilate. Commonly one-third and, under stressful conditions as much as two-thirds, of a plant’s daily fixed CO2 can be respired.
According to the estimates in Table 6.6, a germinating seedling with starting biomass of 1 g has in one day gained a further 0.2 g in structural growth plus 0.05 g in storage, with respiratory costs equivalent to 0.10 g g–1 d–1, or 40% of the dry matter formed. Using similar logic, the young vegetative plant has produced structural growth and storage at a respiratory cost equivalent to 0.08 g g–1 d–1, also 40% of the dry matter formed. In a maturing plant with less structural growth and with storage organs that are importing photoassimilate, the respiratory cost has fallen to 0.04 g g–1 d–1 or 27%, as the production of storage compounds requires less energy than does structural growth.
The physiological and biochemical processes involved in energy production, respiration, and utilization of energy have been described in detail in Chapter 2, but for convenience a summary is presented in the next section.
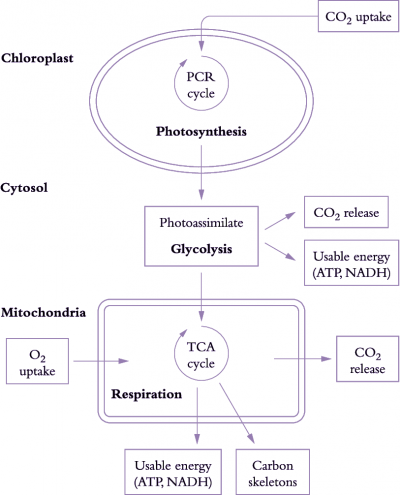
Figure 6.17. Simplified view of processes involved in carbon gain and generation of respiratory energy. The figure represents a mesophyll cell in a leaf. CO2 assimilated by chloroplasts produces carbon-rich compounds (photoassimilates) that are exported to the cytosol and mitochondria. CO2 is then produced during breakdown of these carbon-rich compounds by glycolysis and by mitochondrial respiration. Release of CO2 and uptake of O2 by mitochondria are coupled to production of usable energy (ATP, NADH). Carbon skeletons (necessary for protein synthesis) are also produced during mitochondrial respiration (Original drawing courtesy Owen Atkin)
Photoassimilate is used to generate respiratory products needed for plant growth (Figure 6.17). Carbohydrate compounds produced from photosynthesis are exported from chloroplasts to the cytosol and mitochondria, and used to generate ATP, redox equivalents (in particular NADH) and carbon skeletons via glycolysis, mitochondrial tricarboxylic acid (TCA) activity and mitochondrial electron transport. Generation of these respiratory products results in CO2 loss during glycolysis and passage of metabolites around the TCA cycle.
Energy (ATP and NADH) and carbon skeletons produced by mitochondrial respiration are used for various processes essential to growth, maintenance, nutrient uptake and transport within the plant.
Maintenance respiration represents the portion of respiratory CO2 release that is coupled to production of energy (ATP and reducing power) necessary for maintenance of chemical and electrochemical gradients across membranes, turnover of cellular constituents such as proteins, and processes involved in physiological acclimation to changing or harsh environments (Penning de Vries 1975). Energy needed for maintenance is determined by the specific costs of processes taking place and is generally regarded as proportional to tissue mass.
Protein turnover is an energy-intensive process accounting for 60–80% of maintenance respiration (Penning de Vries 1975). Demand for respiratory energy associated with protein turnover will depend on turnover rate, respiratory costs associated with turnover, as well as the total amount of proteins undergoing turnover. Enzymes such as nitrate reductase (a key enzyme involved in nitrogen assimilation) have a very high turnover rate (Amthor 1984). As a result, plants assimilating nitrate have higher maintenance requirements than ammonium-grown plants (Hansen 1979).
Translocation of photoassimilate is also a potentially expensive process that accounts for approximately 30% of total dark respiration in several starch-storing plant species and would represent a substantial drain on photo-assimilate that could otherwise go into storage organs (Table 6.6). Phloem loading and unloading is largely responsible for this high cost because transport of sugars between symplasm and apoplasm depends on cotransport of H+. Movement of H+ is in turn dependent on ATP being consumed in the symplasm (Chapter 5). Traffic in photoassimilate thus increases demand for maintenance respiration
Energy costs associated with nutrient aquisition are often very high because ions have to be transported across root cell membranes using active transport systems that require substantial amounts of ATP. Energy requirement for ion uptake will depend on several factors, including the degree to which absorbed nutrients are released back to the soil and the degree to which protons and anions are cotransported into roots.
Growth respiration covers synthesis of new biomass from photosynthate and mineral nutrients and is regarded as proportional to the rate at which new material is being formed. Specific respiratory costs associated with growth (i.e. construction cost) will depend to a large extent on the chemical composition of plant material and by implication the amount of energy embedded in these molecules (Table 6.7). Compounds with a high carbon concentration require more ATP and reducing power for their synthesis (Lambers and Poorter 1992). For example, biomass stored as lipid represents an investment of almost three times as much energy as would be required for storage of the same mass of non-structural carbohydrate. Plant growth analysis based on dry mass accumulation takes no account of such differences in chemical composition of end-products, so that comparisons of growth efficiencies based solely on RGR of biomass must be viewed circumspectly.
Construction cost, and thus growth respiration, also varies according to the chemical form of available nitrogen (e.g. N2, NO3– and/or NH4+) and sites of assimilation. Nitrogen reduction is an energetically expensive process, requiring considerable input of respiratory energy (e.g. ATP + reductant) and TCA cycle intermediates. Plants fixing atmospheric N2 in their roots demand much ATP, namely 12.5–26.5 mol ATP per mol of NH4+ produced, and a further 2.5–3.0 mol ATP for subsequent assimilation into nitrogen-based metabolites such as amino acids and proteins. NO3– reduction to NH4+ is cheaper, costing around 12 mol ATP per mol NH4+ produced.
Respiratory costs associated with NO3– assimilation can be substantially reduced if reduction of NO3– to NH4+ and subsequent assimilation of NH4+ into amino acids takes place in leaves. Reduction and assimilation of NO3– can then used excess photosynthetic reductant and ATP. Growth respiration associated with synthesis of nitrogen-based resources is thus greatly reduced by shoot assimilation of NO3–.
Plants vary in their intrinsic growth rate, and may under the same environment differ three-fold in the relative growth rate. Some species are inherently fast-growing, and some inherently slow-growing. This section investigates the reason for this, and in particular the energy efficiency of the various species.
Fast-growing species tend to have higher rates of photosynthesis, but also use respiratory energy more efficiently for maintenance, growth and ion uptake. Variations in efficiency of energy use reflect differences in the proportion of whole-plant respiration that is allocated to these three processes and/or the specific costs of each process.
Fast-growing species achieve a higher RGR under optimum conditions than do slow-growing species under similar conditions. Carbon loss via respiration is considerable with genetic differences in generation and utilisation of respiratory energy contributing to these differences in RGR. Fast-growing species achieve a higher RGR than slow-growing species because their net rate of CO2 uptake per unit of shoot and whole-plant mass is greater (Figure 6.18). By definition, net carbon fixed per day must depend to some extent on the proportion of fixed CO2 that is subsequently lost by respiration, so that differences in respiratory CO2 loss have an important impact on net carbon gain, and can be linked quantitatively to RGR.
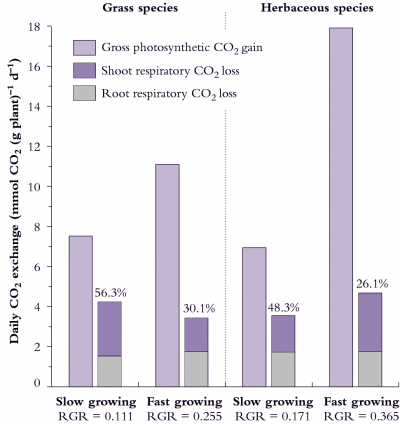
Figure 6.18. Daily carbon economy of plant species that differ with respect to inherent maximum RGR (g g-1 d-1). The fast-growing grass and fast growing herb both exhibit higher rates of gross photosynthetic CO2 uptake per unit mass (i.e. net photosynthesis plus shoot dark respiration) than their slow-growing counterparts. Fast-growing species lose a smaller percentage of daily fixed carbon via respiration. Based on data in Atkin et al. (1996) Funct Ecol 10, 698-707 for slow-growing Australian alpine and fast-growing lowland Poa species, and Poorter et al. (1990) Plant Physiol 94, 621-627 for the slow-growing herb Pimpinella saxifrage versus the fast-growing herb Galinsoga parviflora).
Data shown in Figure 6.18 can be used to calculate RGR for each species from photosynthesis and respiration measurements if the plant’s carbon concentration is known.
Processes supporting a net gain in new biomass (dW, g) per unit time (dt, d) can be represented as:
\[\frac{\text{d}W}{\text{d}t}=A-R\tag{6.25}\]
where A is daily carbon assimilation and R is whole-plant respiratory loss, so that net gain per unit existing plant biomass per unit time (or RGR, g g–1 d–1) becomes
\[\text{RGR} = \frac{1}{W}\frac{\text{d}W}{\text{d}t} = \frac{A}{W} - \frac{R}{W} \tag{6.26}\]
If A and R are expressed as mmol carbon g–1 dry matter per day, then Equation 6.26 becomes
\[\text{RGR} = (A-R)/C_{wp} \tag{6.27}\]
where Cwp is plant carbon concentration in mmol carbon g–1 dry matter. R can be separated into Rshoot and Rroot.
Whole-plant RGR can now be linked to gas exchange data for shoot assimilation (A), shoot respiration (Rshoot) and root respiration (Rroot) according to the expression
\[\text{RGR} = (A-(R_{\text{shoot}} + R_{\text{root}})/C_{wp} \tag{6.28}\]
A and R can be determined from direct measurement of whole-plant gas exchange. The example below uses a value for Cwp of 34.8 mmol C g–1 dry matter.
Taking the fast-growing grass in Figure 6.18, where A is 11.1 mmol C g-1 plant d-1, and R for shoots and roots is 1.75 and 1.68 mmol C g-1 d-1 , then RGR = 0.22 g g–1 d–1 .
This prediction of 0.22 d–1 for RGR represents an instantaneous value derived from whole-plant gas exchange measurements, whereas 0.255 d–1 in Figure 6.18 represents an average RGR from growth analysis over several days. Gas exchange values are generally within 10% of RGR values from sequential harvests.
Herbs and grasses can differ in the degree to which respiratory losses account for differences in RGR. Considering grasses (Figure 6.18, left side), 56% of daily fixed CO2 is lost by respiration in the slow-growing alpine species whereas only 30% of daily fixed CO2 is respired by the fast-growing lowland grass species. Over half of the carbon loss is attributable to roots in both species and, overall, respiration rate per unit plant mass is slightly higher in the slow-growing grass species.
Herbs in Figure 6.18 (right side) differ from grasses because the fast-growing herb respires faster than the slow-growing herb (on a mass basis) so that differences in percentage loss of carbon between these species cannot be due to differences in respiration rates per se. Significantly, however, the fast-growing herb still loses a smaller percentage of daily fixed carbon due to whole-plant respiration because daily CO2 assimilation (mass basis) is especially high. A notably higher SLA in this fast-growing herb contributes to faster photo-synthesis on a mass basis (Figure 6.18).
A lower percentage loss of daily fixed carbon due to respiration in fast-growing grasses and fast-growing herbs does imply that carbon metabolism is more effective in these species than in their slow-growing counterparts, and serves as a model for generalisations. Such fast-growing plants may be more efficient in how they generate and/or use respiratory energy.
It is likely that an inherent capacity for fast growth confers a selective advantage for plants in favourable environments such as warm moist lowlands, but would be selectively neutral in restrictive environments such as nutritionally poor sites or alpine regions.
Growth respiration can be distinguished from maintenance respiration by relating variation in respiration rate to variation in RGR over short time intervals (Figure 6.19; Penning de Vries 1975). This approach assumes a model for respiration where:
\[\text{Total respiration} = \text{Maintenance respiration} + \text{(Specific costs of growth} \times \text {RGR)} \tag{6.31}\]
where respiration is expressed in mmol CO2 g-1 d-1, and specific costs of growth in mmol CO2 g-1.
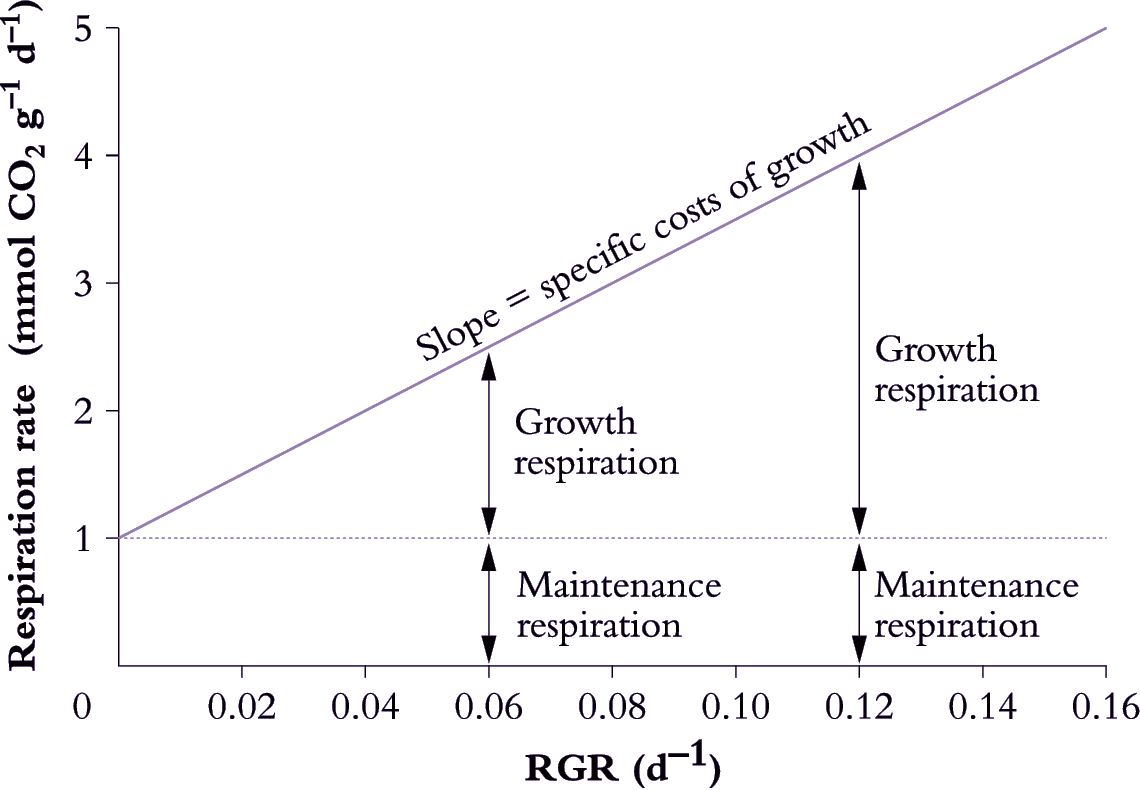
Figure 6.19. Determination of growth and maintenance respiration in whole plants, roots or shoots. Respiration rates are plotted as a function of RGR and maintenance respiration is taken as the rate of respiration when RGR is extrapolated to zero. The slope of this plot (25 mmol CO2 g-1) provides an estimate of the specific costs of growth which are assumed to remain constant for a given plant regardless of RGR. Variation in both RGR and respiration rate can be generated in several ways, including growing plants under different irradiances, or by measuring respiration and growth rates during development (RGR and respiration rate commonly decrease with age) (Original drawing courtesy Owen Atkin)
Decreases in RGR (e.g. due to growth under different irradiance or during ageing) are assumed to decrease demand for growth respiration, whereas demand for maintenance respiration is assumed to remain constant at different RGR values. Based on these assumptions, the maintenance component can be estimated by extrapolating the respiration rate back to a point where no growth occurs (1 mmol CO2 g–1 d–1 in Figure 6.19). Specific respiratory costs associated with growth can be estimated from the slope of the respiration–RGR plot (25 mmol CO2 g–1 in Figure 6.19).
An alternative approach to maintenance and growth components of respiration involves holding plants in extended darkness. Most annual plants use up their readily available energy sources after about 2 d and shoot growth will cease. Rate of CO2 release would then reflect the maintenance component of dark respiration. The difference in dark respiration rates before and after 2 d darkness would be the growth component.
Such methods incorporate specific costs of ion uptake into estimates of growth respiration, but do not isolate the ion uptake component of root respiration. Ion uptake respiration can be separated from growth by partitioning root respiration into growth, maintenance and ion uptake components. The approach adopted by Veen (1980) assumes a model where:
\[\text{Root respiration} = \text{Maintenance respiration} + \text{(Specific costs of growth} \times \text {RGR)} + \text{(Specific costs of ion uptake} \times \text{Ion uptake rate)} \tag{6.31}\]
A multiple regression analysis approach can be used to separate these components (Figure 6.20). Root respiration is taken as a dependent variable; while RGR and ion uptake rate are independent variables (van der Werf et al. 1994). The maintenance component of root respiration is taken as the rate of respiration when growth and ion uptake are extrapolated back to zero. Specific costs of growth and ion uptake are taken as the slope of the respiration versus growth and ion uptake regressions, respectively.
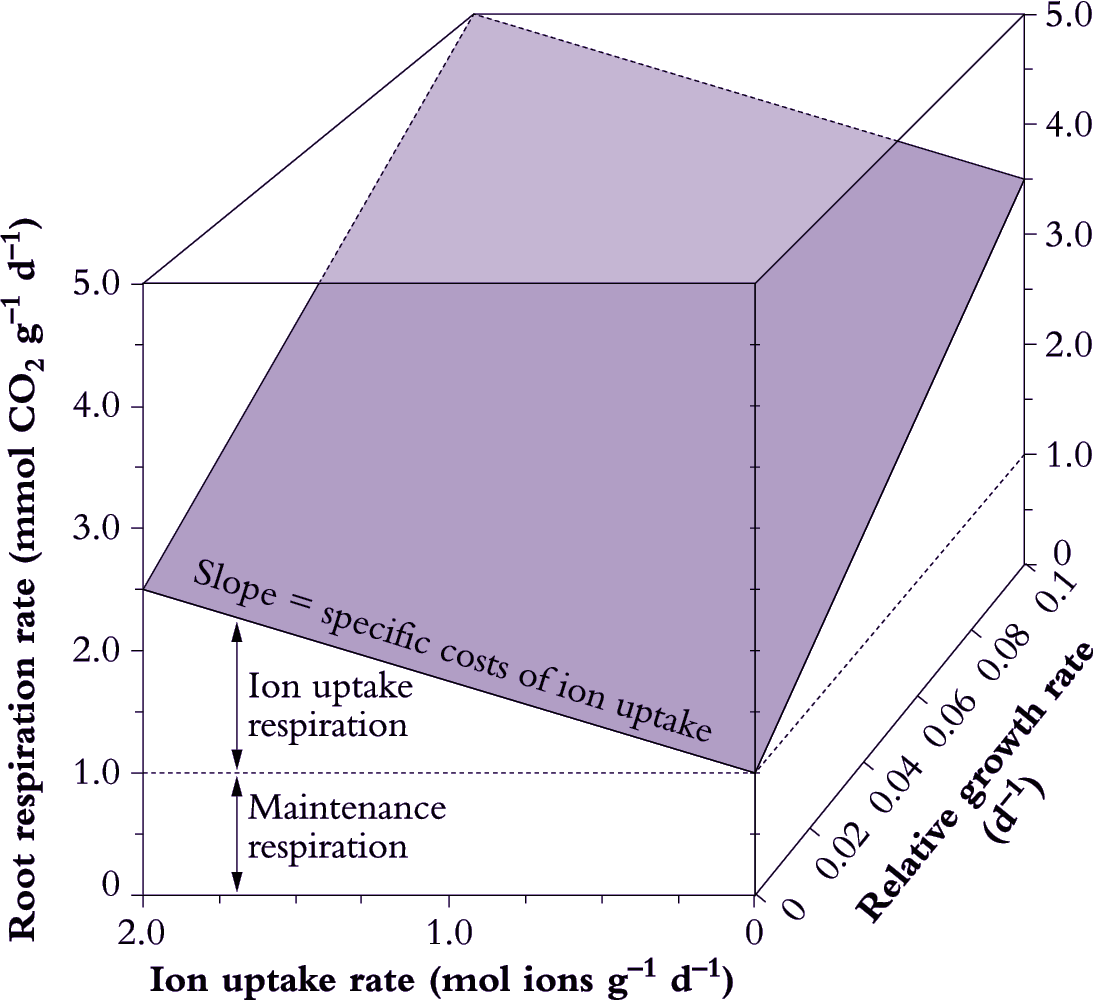
Figure 6.20. Determination of growth, maintenance and ion uptake components of root respiration. Maintenance respiration is taken as the rate of respiration when ion uptake rate and relative growth rate (RGR) are extrapolated to zero. Specific costs of ion uptake are estimated from the slope of the respiration versus ion uptake rate plot, while the actual amount of respiration allocated to ion uptake is shown. The slope of respiration versus RGR represents the specific costs of growth. Growth respiration varies with RGR, but specific costs of growth, ion uptake and maintenance are assumed to remain constant irrespective of variation in RGR or ion uptake (Original drawing courtesy Owen Atkin)
Most respiratory energy is allocated to nutrient acquisition in both fast- and slow-growing species (Figure 6.21) and this proportion increases even further under suboptimal conditions as maintenance costs rise. However, fast-growing species are distinguished by allocating less respiratory energy to nutrient acquisition, and more to growth. Presumably, a lower allocation to ion uptake in fast-growing species arises from lower specific costs. Loss of absorbed nutrients could also be lower in fast-growing species, while cotransport of protons and anions into roots might conserve energy. Maintenance costs also appear to be slightly lower in fast-growing plants (Figure 6.21) but any difference between these two plant categories in allocation to maintenance processes is small and is unlikely to matter overall. Nevertheless, differences in maintenance respiration will become more important when a plant is exposed to unfavourable conditions which invariably increase allocation of respiratory energy to fine-root turnover and maintenance of those structures.
Nitrogen limitation decreases absolute rates of shoot and root respiration in both fast- and slow-growing species (Figure 6.22) but the decrease in gross photosynthesis is much greater. Thus, the percentage of daily fixed CO2 lost during respiration increases under nitrogen limitation. This mainly results from a greater allocation of photoassimilate to roots. Slower growth of whole plants on low nitrogen is therefore due to both slower photosynthesis due to less Rubisco coupled with more costly nitrogen acquisition.

Figure 6.22. Low nitrogen (supplied as nitrate) reduces RGR in both fast-growing and slow-growing grass species. Photosynthesis and respiration (mass basis) also decrease, but the percentage of daily fixed carbon that is lost via respiration is higher on low nitrogen due to a greater investment of photoassimilate in roots. Photosynthetic CO2 gain is expressed as net photosynthesis plus shoot respiration (assuming shoots respire in daytime at the same rate as that measured in darkness). Values for CO2 exchange per unit plant mass were calculated from whole-plant measurements and proportions of plant biomass allocated to shoots and root, respectively. Based on Poorter et al. (1995) Plant Soil 171, 217-227
The proportion of daily fixed CO2 that is respired may also increase under other stressful conditions such as drought, high temperature and ion toxicity. Challenged by such stresses, a greater proportion of respiratory energy is being used to support cellular maintenance in place of growth.
In conclusion, this chapter has shown that respiratory costs are high, for both formation of new tissues and maintenance of old ones. Plants profit from shedding old leaves and roots, where the costs of maintenance outweigh the benefits of their function. Future research into ways to minimise costs while maximising functions may produce more efficient plant forms. Quantitative growth analyses will be essential in developing new plants or improving management practises for higher yields in both optimal and suboptimal environments.
Amthor JS (1984) The role of maintenance respiration in plant growth. Plant Cell Environ 7: 561-569
Blackman GE, Wilson GL (1951a) VI. The constancy for different species of a logarithmic relationship between NAR and light intensity and its ecological significance. Ann Bot 15: 63-94
Blackman GE, Wilson GL (1951b) VII. An analysis of the differential effects of light intensity on NAR, LAR and RGR of different species. Ann Bot 15: 374-408
Blackman GE et al (1955) An analysis of the effects of seasonal variation in daylight and temperature on the growth of Helianthus annuus. Ann Bot 19: 527-548
Chapin FS et al (1989) Physiological determinants of growth rate in response to phosphorus supply in wild and cultivated Hordeum species. Oecologia 79: 96-105
Davidson RL (1969b) Effects of soil nutrients and moisture on root/shoot ratios in Lolium perenne and Trifolium repens. Ann Bot 33: 571-577
Evans GC (1972) The quantitative analysis of plant growth. Blackwell: Oxford
Evans GC, Hughes AP (1961) I. Effect of artificial shading on Impatiens parviflora. New Phytol 60: 150-180
Evans LT (1993) Crop evolution, adaptation and yield. Cambridge University Press.
Fredeen AL et al (1989) Influence of phosphorus nutrition on growth and carbon partitioning in Glycine max. Plant Physiol 89: 225-230
Gifford RM et al. (1984) Crop productivity and photoassimilate partitioning. Science 225: 801-808
Hansen GK (1979) Influence of nitrogen form and absence on utilisation of assimilates for growth and maintenance in tops and roots of Lolium multiflorum. Physiol Plant 46: 165-168
Hughes AP, Cockshull KE (1971) The effects of light and CO2 on the growth of Chrysanthemum morifolium. Ann Bot 35: 899-914
Hunt R (1982) Plant growth curves: the functional approach to plant growth analysis. Edward Arnold: London
Lambers H, Poorter H (1992) Inherent variation in growth rate between higher plants. Adv Ecol Res 23: 187-261
Penning de Vries FWT (1975) The cost of maintenance processes in plant cells. Ann Bot 39: 77-92
Penning de Vries FWT et al. (1974) Products, requirements and efficiency of biosynthesis: a quantitative approach. J Theor Biol 45: 339-377
Poorter H, Lewis (1986) Testing methods in relative growth rate: a method avoiding curve fitting and pairing. Physiol Plant 67: 223-226
Poorter H et al (1991) Respiratory energy requirements of roots vary with the potential growth rate of a plant species. Physiol Plant 83: 469-478.
Poorter H et al (2012) Biomass allocation to leaves, stems and roots: meta-analyses of interspecific variation and environmental control. New Phytol 193: 30-50.
Potter JR, Jones JW (1977) Leaf area partitioning as an important factor in growth. Plant Physiol 59: 10-14
Sayre KD et al. (1997) Yield potential progress in short bread wheats in northwest Mexico. Crop Sci 37: 36-42
Sadras V, Lawson C (2011) Genetic gain in yield and associated change in phenotype, trait plasticity and competitive ability of South Australian wheat varieties. Crop Past Sci 62: 1-17
Shearman VJ et al. (2005) Physiological processes associated with wheat yield progress in the UK. Crop Sci 45: 175−185
Shipley B (2006) NAR, SLA and LMR: which is most closely correlated and with relative growth rate? A meta-analysis. Funct Ecol 20: 565-574
Warren Wilson J (1969) Maximum yield potential. In ‘Transition from Extensive to Intensive Agriculture’ Int Potash Instit, Berne, 7th Colloquium pp 34-56.
Wong SC (1990) Elevated CO2 and plant growth. II Non-structural carbohydrate content in cotton. Photosyn Res 23: 171-180
Zheng TC et al. (2011) Genetic gains in grain yield, net photosynthesis and stomatal conductance achieved in Henan Province of China between 1981 and 2008. Field Crops Res 122: 225−233.