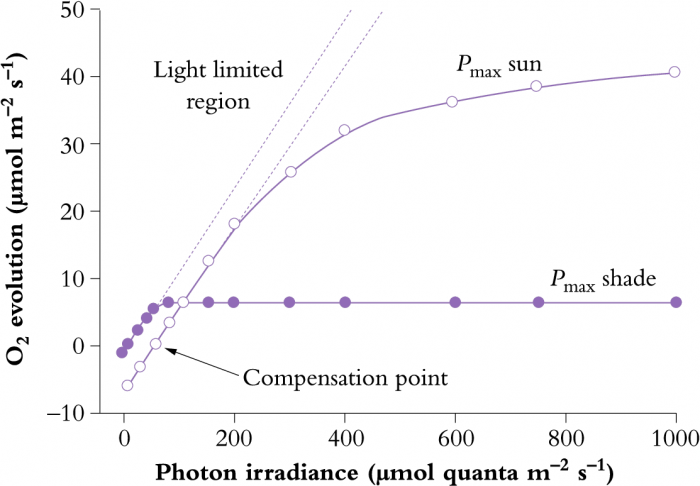
Figure 12.7 Photosynthesis-light response curve for typical shade and sun plants, showing relationships between photosynthetic rate and absorbed light (expressed as a photon irradiance). Dashed lines are extrapolations of initial linear slopes where photosynthesis is light limited, and represent quantum yield (moles of O2 evolved per mole quanta absorbed). (Original data courtesy S.A. Robinson)