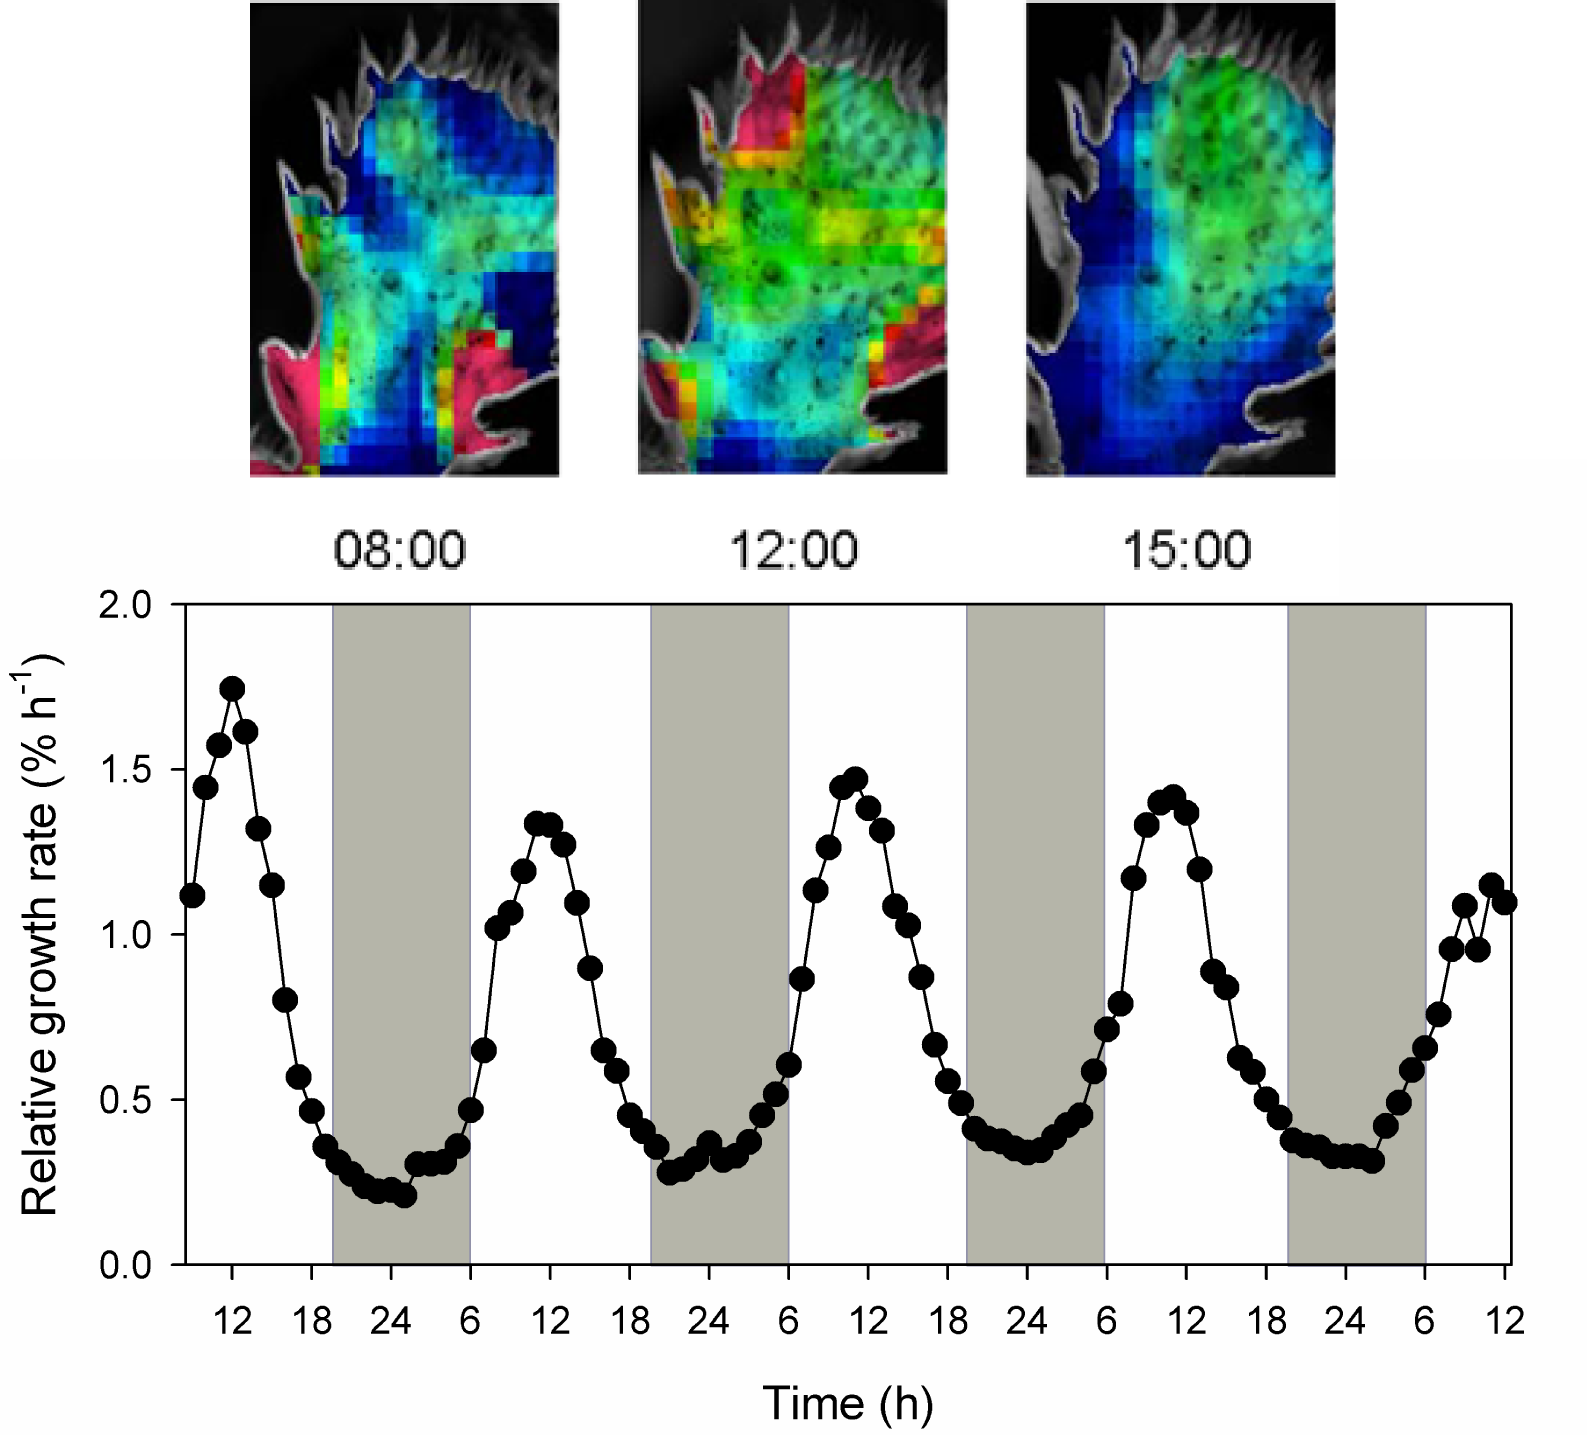
Figure 2.35 Diel expansion growth of Opuntia oricola cladodes during drought in the desert biome of the Biosphere 2 Laboratory in Oracle Arizona USA measured by time-lapse photography. Heterogeneity of growth rate throughout the day is colour coded as red = 2.0% to blue = 0.5% per hour (Diagram by B. Osmond based on Gouws et al. Funct Plant Biol 32: 421-428, 2005)