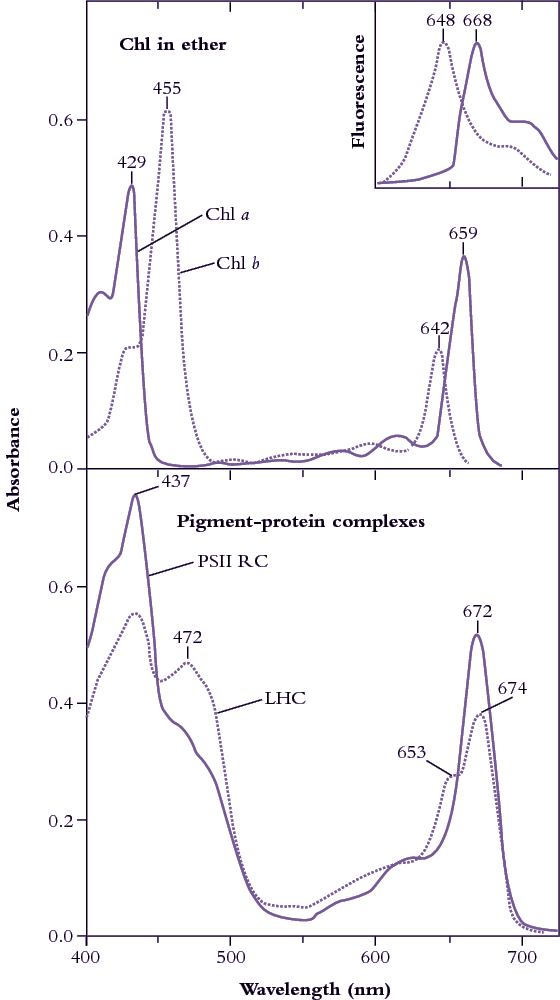
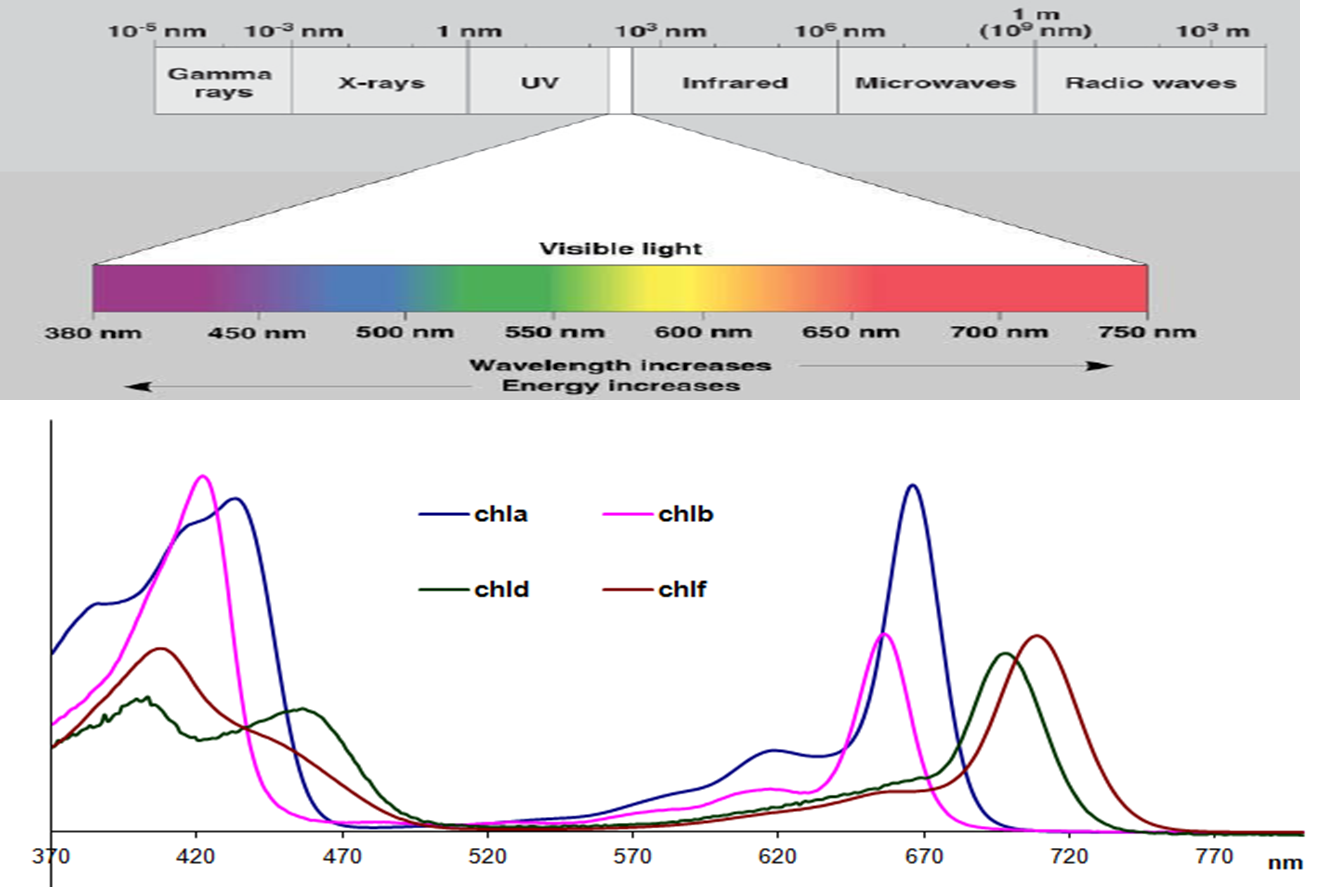
Chlorophylls are readily extracted from (soft) leaves into organic solvent and separated chromatographically into constituent types, most notably chlorophyll a (Chl a) and chlorophyll b (Chl b). These two chemical variants of chlorophyll are universal constituents of wild vascular plants and express highly characteristic absorption spectra (Figure 1.8, upper curves). Both chlorophylls show absorption maxima at wavelengths corresponding to blue and red, but chlorophyll assay in crude extracts, which inevitably contain carotenoids as well, is routinely based on absorption maxima in red light to avoid overlap with these accessory pigments that show strong absorption below 500 nm. Absorption maxima at 659 and 642 for Chl a and Chl b respectively would thus serve for assay in diethylether, but these peaks will shift slightly according to solvent system, and such shifts must be taken into account for precise measurement (see Porra et al. 1989 for details). Additional chlorophylls have been discovered that exist in cyanobacteria which extends their absorption spectrum into the infrared (Figure 1.9).
Chl a and Chl b differ with respect to both role and relative abundance in higher plants. Chl a/b ratios commonly range from 3.3 to 4.2 in well-nourished sun-adapted species, but can be as low as 2.2 or thereabouts in shade-adapted species grown at low light. Such variation is easily reconciled with contrasting functional roles for both Chl a and Chl b. Both forms of chlorophyll are involved in light harvesting, whereas special forms of only Chl a are linked into energy-processing centres of photosystems. In weak light, optimisation of leaf function calls for greater investment of leaf resources in light harvesting rather than energy processing. As a result the relative abundance of Chl b will increase and the Chl a/b ratio will be lower compared with that in strong light. Conversely, in strong light, photons are abundant and require greater capacity for energy processing by leaves (hence the higher Chl a/b ratio). As a further subtlety, the two photosystems of higher plant chloroplasts (discussed later) also differ in their Chl a/b ratio, and this provided Boardman and Anderson (1964) with the first clue that they had achieved a historic first in the physical separation of those two entities.
Carotenoids also participate in photosynthetic energy transduction. Photosystems have an absolute requirement for catalytic amounts of these accessory pigments, but their more substantive involvement is via dissipation of potentially harmful energy that would otherwise impact on delicate reaction centres when leaves experience excess photon irradiance (further details in Chapter 12). Carotenoids are thus regarded as ‘accessory’ to primary pigments (chlorophylls) and in molar terms are present in mature leaves at about one-third the abundance of Chl (a + b).
Chlorophyll in leaves is not free in solution but is held in pigment-protein complexes, each with a different absorption spectrum (see Evans and Anderson 1987). In particular, light-harvesting Chl a, b–protein complexes (LHC in Figure 1.8, lower curves) develop a secondary absorption peak at 472 nm with a shoulder at 653 nm, while the Chl a of photosystem II reaction centres shows absorption peaks at 437 and 672 nm (compared with 429 and 659 nm for purified Chl a in ether; Figure 1.8, upper curves).
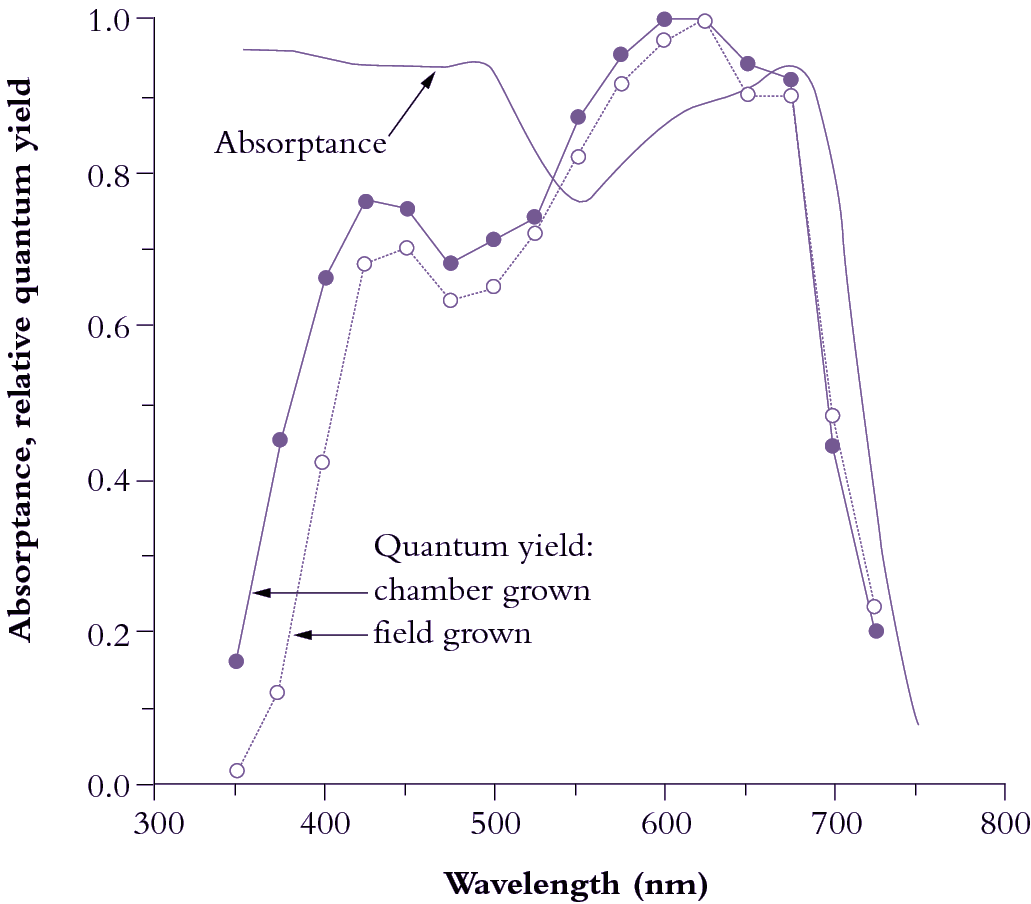
Subtle alterations in the molecular architecture of chlorophyll molecules according to the particular protein to which they bind in either light-harvesting or energy-processing centres are responsible for these shifts in absorption peaks, and for a general broadening of absorption spectra (compare lower and upper curves in Figure 1.8). Such effects are further accentuated within intact leaves by accessory pigments and greatly lengthened absorption pathways resulting in about 85% of visible wavelengths being absorbed (Figure 1.10). Any absorbed quanta at wavelengths below 680 nm can drive one electron through either reaction centre. Maximum quantum yield (Figure 1.10) occurs when both reaction centres absorb equal numbers of such quanta. When one photosystem population (PSII) absorbs more quanta than the other (PSI), excess quanta cannot be used to drive whole-chain (linear) electron flow. Quantum yield is reduced as a consequence, and leads to a slight discrepancy between in vivo absorption maxima (Figure 1.8) and quantum yield (Figure 1.10).
Although UV wavelengths are absorbed by leaves and would be capable of driving photosynthesis, such short wavelengths are damaging to biological systems and plants have adapted by developing a chemical sunscreen. Consequently, the quantum yield from these wavelengths drops off markedly below about 425 nm. Beyond 700 nm (infrared band) absorption drops to near zero, and forestalls leaf heating from this source of energy. However, quantum yield falls away even faster, and this ‘red drop’, though puzzling at first, led subsequently to a comprehensive model for photosynthetic energy transduction, outlined below.