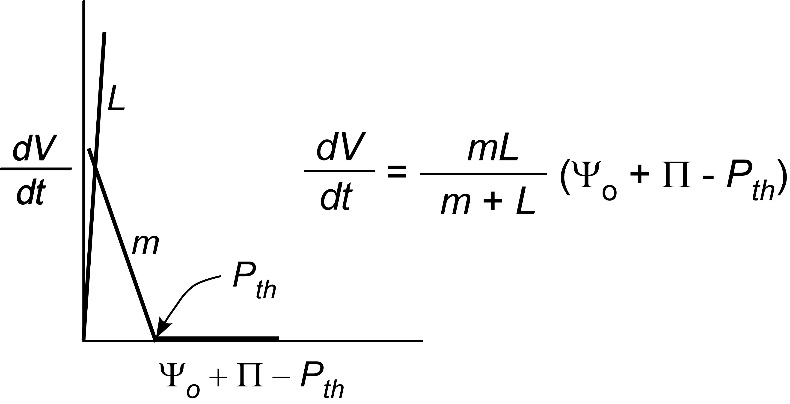
Figure 7.27 Simplified version of Fig. 5 for a single cell surrounded by water (\(\Psi_o = 0\)). \(L\) is so large that \(P\) and \(m\) control the growth rate if \(\Pi\) and \(P_{th}\) are constant. (Diagram courtesy JS Boyer)
It is pretty obvious from this behaviour that simply putting water around a tissue creates a system with several interacting factors. The growth rate could be affected not only by \(P\) but also by \(m\), \(L\), \(\Pi\), or \(P_{th}\). In an effort to simplify this system, scientists have sought single cells that could be surrounded by water. From a practical point of view this allows \(P\) and \(m\) to be the main factors controlling growth and minimises the effect of \(L\), as shown in Figure 7.27.
Figure 7.27 Simplified version of Fig. 5 for a single cell surrounded by water (\(\Psi_o = 0\)). \(L\) is so large that \(P\) and \(m\) control the growth rate if \(\Pi\) and \(P_{th}\) are constant. (Diagram courtesy JS Boyer)
One approach has been to use single algal cells large enough to measure \(P\) and growth (\(\frac{dV}{dt}\)) simultaneously. Chara corallina or Nitella flexilis are candidates because they have cells large enough for the measurements. They are naturally surrounded by fresh or brackish water and have rhizoids resembling roots. Gametes form in structures in the axils of branches analogous to flowers or cones in their land counterparts. In fact, genomic and morphological analyses consider these algae to be among the closest relatives of the progenitors of land plants. In the internode cells of Chara or Nitella, microfibrils are oriented normal to the cell axis and the walls expand mostly in length like many plant tissues (roots, stems, grass leaves).
Using the internodes of these species, \(P\) and growth rate (\(\frac{dV}{dt}\)) can be monitored simultaneously and changed so quickly that \(\Pi\) and \(P_{th}\) remain constant. This allows the \(P\) response to be rigorously determined. Moreover, the walls can be isolated without leaving the medium in which the algae are grown. The same measurements can be repeated without the cytoplasm. This is a great tool for observing the response to \(P\). When the growth of the live cells was compared with that in the isolated walls, they were similar but only for the first hour or so. After that, growth ceased in the walls but continued in the live cells even though the walls and cells had the same \(P\). Something was missing in the isolated wall that was being supplied by the live cells.
Considering that new wall material is supplied by the cytoplasm and missing in the isolated walls, if seemed reasonable to supply new wall constituents as though the cytoplasm had done so. Supplying pectin (a wall polymer) to the growth medium returned the growth rate of isolated walls to the rate in the live cells! This was unexpected but indicated the wall needed a supply of pectin in order to continue growing. The active pectin was a linear unbranched polymer of α-1,4-D-galacturonic acid sometimes with a small amount of rhamnose (usually 1-2%) that is normally synthesised in the cytoplasm and released to the wall by exocytosis. It becomes a prominent member of the wall matrix and forms a gel embedding the cellulose microfibrils.
The pectin gels because calcium ions bind to neighbouring pectin polymers. The cross-bridging forms junction zones with the polymers that are strong enough for the pectin to form a gel solid. The gel gets stronger with more cross-bridges. The new pectin from the cytoplasm removed some of the cross-bridges from the wall, weakening the wall gel and allowing the polymers to slip a little. This action occurred only when \(P\) was above \(P_{th}\), and only when temperatures were warm enough for growth. Figure 7.28 compares the turgor pressure and temperature responses of the live algal cells with those of land plants tissues.
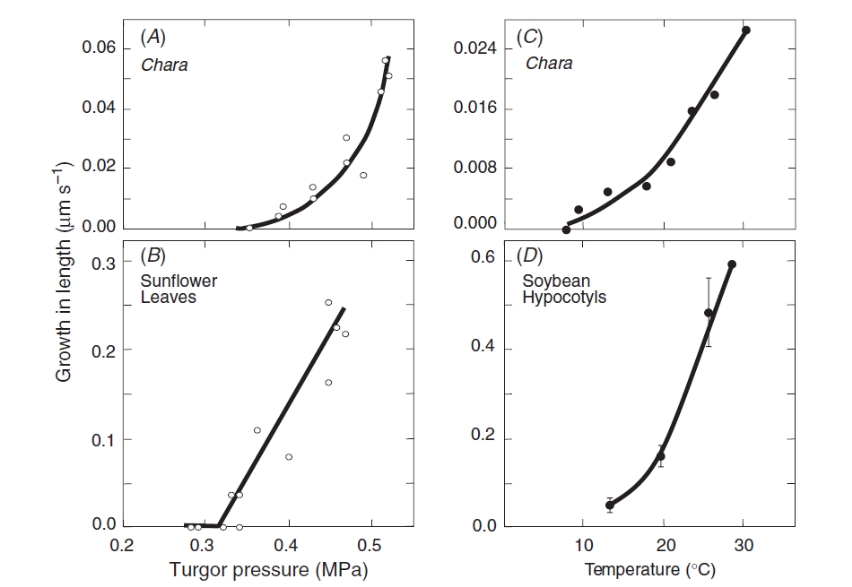
Figure 7.28 Turgor pressure and temperature responses of single algal cells compared to land plant tissues. Turgor pressure and growth in (A) Chara internode cell and (B) sunflower (Helianthus annuus) leaves at 25 °C. Temperature and growth in (C) Chara internode cell and (D) soybean hypocotyls at turgor pressure of 0.4 to 0.5 MPa. (JS Boyer, Funct Plant Biol 36: 385-394)
A chemical mechanism has been proposed to account for this behaviour and is called a “calcium pectate cycle” (Figure 7.29). It seems possible that the chemistry might also occur in land plants. As long as pectin, calcium, and sufficient turgor pressure are present, the cycle should occur in pectin-containing walls. Pectins are among the most conserved components of cell walls during plant evolution, and the similarity in pressure and temperature response in these algae and land plants suggests a common mechanism in both. However, despite these intriguing similarities, definitive tests remain for the future.
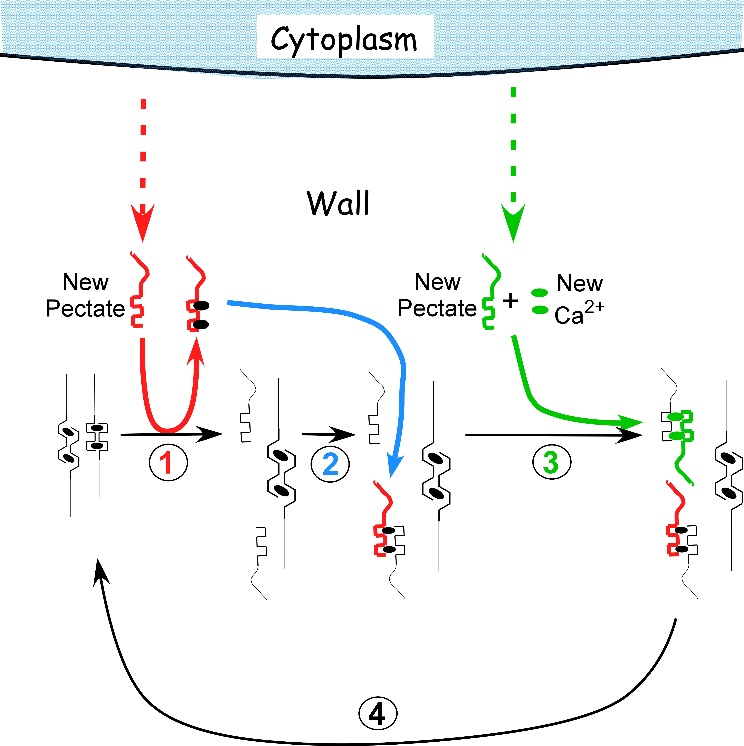
Figure 7.29 Proposed mechanism of cell enlargement in Chara. The diagram shows the calcium pectate cycle occurring in the cell wall for two calcium pectate cross-bridges (black ovals in anti-parallel pectate molecules, left side of figure). Turgor pressure is high enough to distort the egg-box in one of the pair, weakening its bonds with calcium (left pectate in pair). New pectate from the cytoplasm (dashed red arrow) is undistorted and preferentially removes calcium from the weakened and distorted pectate (step 1, red). The load-bearing pectate relaxes after its cross-bridging calcium is removed. The wall elongates incrementally, shifting the load to the other member of the pectate pair, which distorts. The remaining steps 2 to 4 follow by depositing calcium pectate (step 2, blue) and new calcium from the medium plus new pectate from the cytoplasm (step 3, green), resulting in a cycle (step 4, black). The net result is elongation plus wall deposition. Although shown for only two cross-bridged pectate molecules, the same principles apply to larger numbers of cross-bridges. Note that in Chara the cycle occurs in the medium in which the cells are grown (0.6 mM Ca2+). Also note that the rate of growth depends on the rate of pectate release from cytoplasm to wall by exocytosis (red and green dashed arrows). Each step in the diagram was demonstrated experimentally in Chara. (JS Boyer, Front Plant Sci 7:866, 2016)
In other experiments a class of cell wall proteins, expansins, are proposed as potential agents for catalysing yielding in vivo (McQueen-Mason 1995). Figure 7.30 shows sharp gradients in growth along the hook of a cucumber hypocotyl that are paralleled by a gradient in extension of these tissues when stretched under acid conditions (Figure 7.30b) but not at neutral pH (Figure 7.30c). When tissues were killed by boiling, extension was blocked (Figure 7.30d). From these results, it seems that hypocotyl extension requires acid pH and non-denatured proteins. However, all the experiments were done in an extensometer with a uni-axial pull substantially less than the multi-axial tension exerted by \(P\). Since growth requires \(P\) above a threshold in order for walls to yield (Eq. 7), it is difficult to interpret this proposal. When greater uni-axial pull was used by Ezaki et al. (2005) to study hypocotyl growth in soybean hypocotyls, pectin chemistry appeared to determine growth rate. In fact, Zhao et al. (2008) give evidence that pectins may be the target of expansin action.
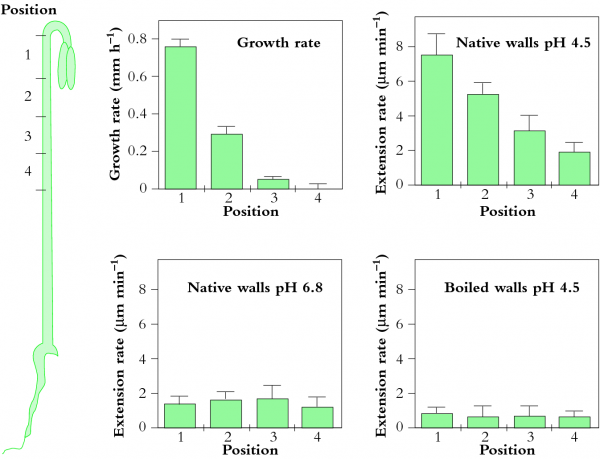
Figure 7.30 Distribution of growth and wall extension at four positions along a cucumber hypocotyl. (a) Growth rate is most rapid near the hook. (b) Hypocotyl segments were frozen, thawed, abraded and stretched under a 20 g load in an acidic buffer (pH 4.5), which is much less tension than exerted by \(P\). Most rapid extension occurred in the fast-growing hook. (c) When measured at pH 6.8, segments extended very little. (d) Segments in which enzymes were denatured by boiling did not extend under the load. (SJ McQueen-Mason, J Exp Bot 46: 1639-1650, 1995)
Notice that the growth mechanism in Figure 7.29 is entirely chemical, with no role for enzymes. It is difficult to hypothesize an enzymatic mechanism because of the requirement for \(P\) above a threshold. Enzyme activity is generally unaffected by these pressures and would continue acting regardless of \(P\). What is clear is that the biophysical consequences of instantaneous changes in \(P\) will be followed by a phalanx of biochemical events including wall polymer synthesis and altered gene expression, and rigorous methods will be required to distinguish enzymatic from biophysical hypotheses. For instance, sustained expansion of plant cell walls cannot be explained simply by inexorable wall hydrolysis; if it were, cell walls would weaken to breaking point during growth. The ‘setting’ of long-term cell expansion rates is likely to hinge on biochemical and chemical events underlying wall relaxation and reinforcement.
Molecular events leading to cessation of wall expansion are even less well understood than those which initiate growth. For example, part of the growing region stops growing when water deficits occur around maize roots (Figure 7.31).

Figure 7.31 Spatial distribution of (a) elongation rates and (b) turgor pressures along apical zones of maize roots grown either in hydrated (Ψ = -0.02 MPa; filled circles) or rather dry (\(\Psi\) = -1.6 MPa; open circles) vermiculite. Note that water deficit only depressed growth at positions more than 2 mm from the apex but \(P\) was lower at all positions in water deficient roots. (WG Spollen and RE Sharp, Plant Physiol 19: 565-576, 1991)
Clearly, the region farthest from the tip has stopped growing but \(P\) remains uniform throughout the zone. \(P\) is lower in the water deficient roots presumably because less water can be absorbed from the water deficient soil. A common view is that sufficient cross-linking develops to limit the extension of the matrix around cellulose microfibrils and prevent further wall expansion. Essentially, when a cell has reached its final dimensions its wall is ‘locked’ into a final, hardened conformation. From the description above, molecules with a specific role in growth cessation are thought to be exocytosed into cell walls, providing either substrates for cross-linkage reactions or enzymes catalysing cross-linkage of pre-existing wall polymers. Identification of cross-linkage reactions have led to a search for their presence in vivo. For example, ferulic acid residues in grass cell walls can cross-link to produce di-ferulic acid and potentially stiffen walls through formation of a polysaccharide-lignin network. Unfortunately, in rice coleoptiles the abundance of the di-ferulic form bore no relation to growth cessation. Also this form of stiffening might be difficult to distinguish from secondary wall deposition.
Secondary cell walls generally form after primary walls have ceased to grow but the familiar rigidity of secondary cell walls (e.g. wood) is mostly viewed as distinct from stiffening of primary walls. Lignification of primary walls commences earlier than once thought and is a possible factor in growth cessation (Müsel et al. 1997). Such a response might be controlled through release of peroxide into walls in much the same way as seen in walls subject to fungal attack. Peroxidase enzymes are candidates for the catalysis of these reactions. Understanding rigidification of this complex matrix of polymers demands input from the disciplines of biology, chemistry and physics. Combining established techniques with novel approaches to the study of individual cells (e.g. Fourier-Transform Infra-red microspectroscopy and the cell pressure probe) will bring new insights to the molecular basis of wall expansion.