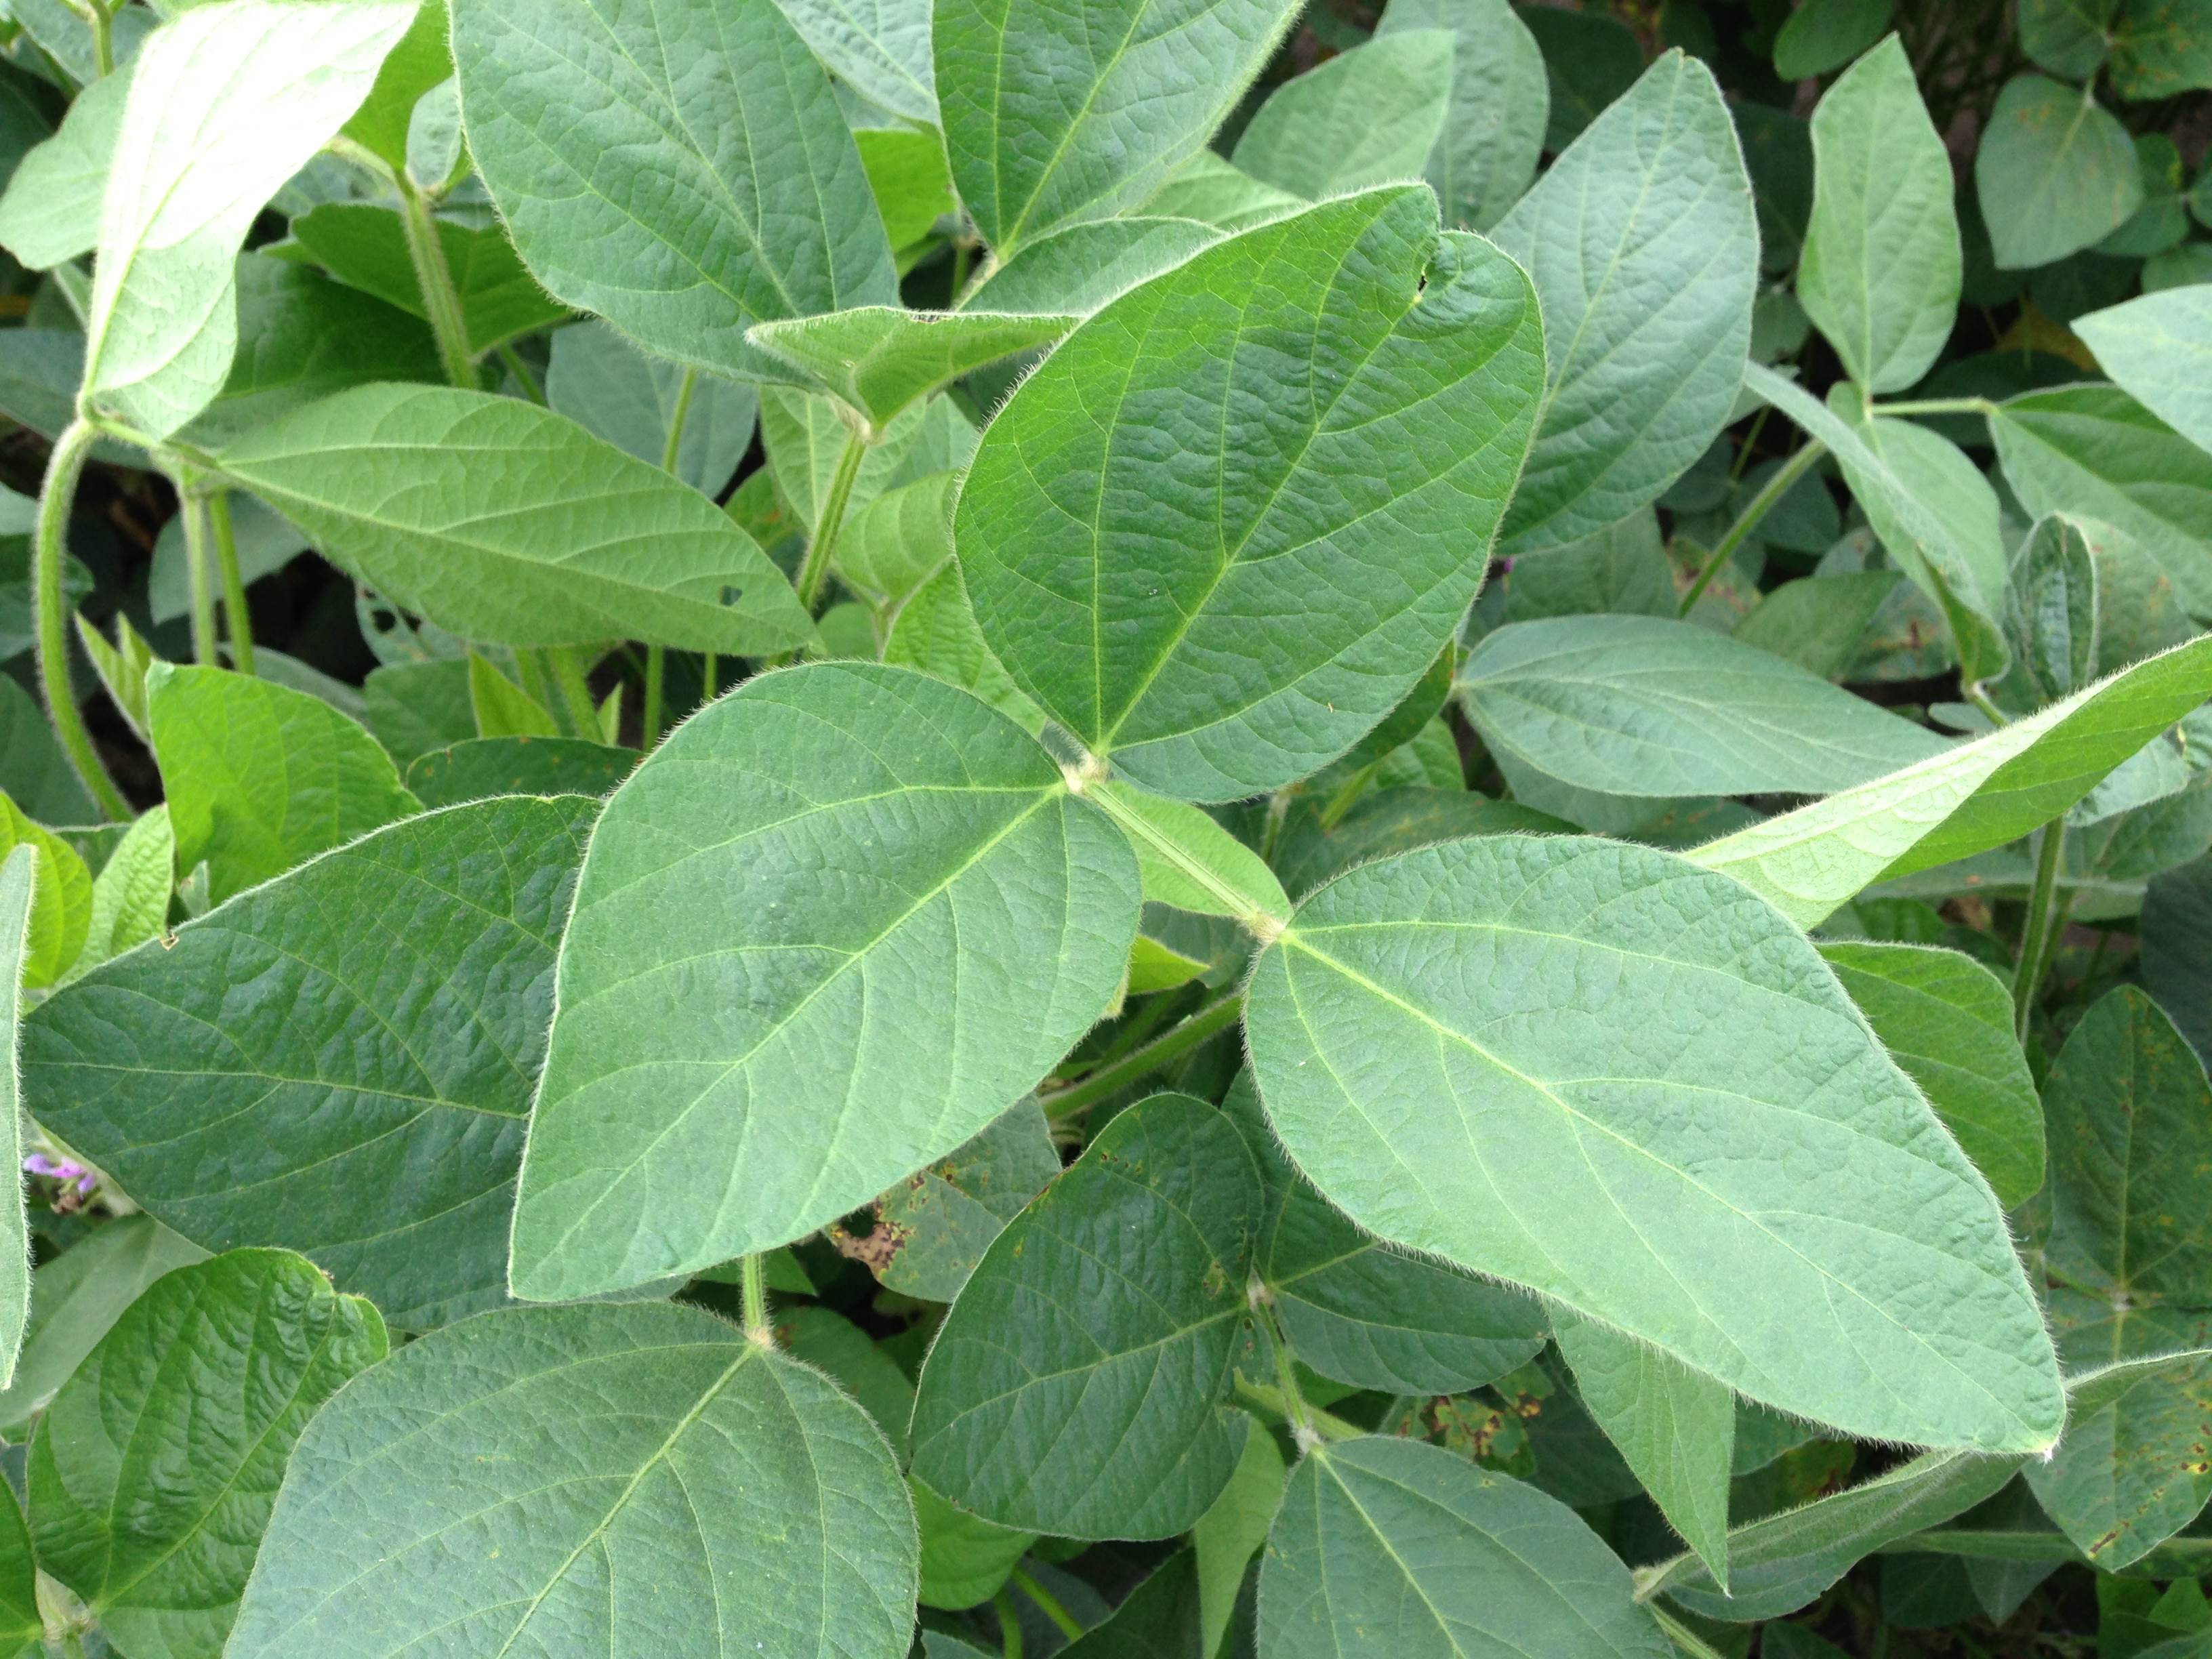
Leaves come in a variety of shapes and sizes. Soybean (Glycine max) has a trifoliate leaf with broad laminae designed for capturing the maximum amount of light in a dense canopy.
Leaves come in a variety of shapes and sizes. Soybean (Glycine max) has a trifoliate leaf with broad laminae designed for capturing the maximum amount of light in a dense canopy.
Leaves come in a great variety of shapes and sizes. The photosynthetic processes that occur within leaves also show considerable variation. All of these variations represent different adaptive responses to different environmental conditions leading to altered gene expression.
Despite such variation, leaves fulfil a common purpose: to capture energy from sunlight and convert that energy currency into chemically useful forms to drive CO2 assimilation and subsequent growth. CO2 assimilation broadly refers to the first steps in the production of sugars from CO2 and water, that is the initial incorporation of inorganic CO2 into biological molecules. Light absorption and energy utilisation is considered at progressively finer levels of organisation from leaves (Section 1.1) to chloroplasts (Section 1.2).
Section 1.1 encompasses anatomy, light interception and leaf gas exchange and includes a case study on development of a process-based model for photosynthetic CO2 assimilation using A:Ci curves.
Leaves experience a mix of demands under frequently adverse conditions. They must intercept sunlight and facilitate the uptake of CO2, which exists at levels around 390 ppm (µL L-1) in the atmosphere, while restricting water loss. The wide variety of shapes, sizes and internal structures of leaves imply that many solutions exist to meet these mixed demands.
In nature, photon irradiance (photon flux density) can fluctuate over three orders of magnitude and these changes can be rapid. However, plants have evolved with photosynthetic systems that operate most efficiently at low light. Such efficiency confers an obvious selective advantage under light limitation, but predisposes leaves to photodamage under strong light. How then can leaves cope? First, some tolerance is achieved by distributing light over a large population of chloroplasts held in architectural arrays within mesophyll tissues. Second, each chloroplast can operate as a seemingly independent entity with respect to photochemistry and biochemistry and can vary allocation of resources between photon capture and capacity for CO2 assimilation in response to light climate. Such features confer great flexibility across a wide range of light environments where plants occur and are discussed in Chapter 12.
Photon absorption is astonishingly fast (single events lasting 10–15 s). Subsequent energy transduction into NADPH and ATP is relatively ‘slow’ (10–4 s), and is followed by CO2 fixation via Rubisco at a sedate pace of 3.5 events per second per active site. Distributing light absorption between many chloroplasts equalises effort over a huge population of these organelles, but also reduces diffusion limitations by spreading chloroplasts over a large mesophyll cell surface area within a given leaf area. The internal structure of leaves (shown in the follwing section) reflects this need to maximise CO2 exchange between intercellular airspace and chloroplasts and to distribute light more uniformly with depth than would occur in a homogeneous solution of chlorophyll.
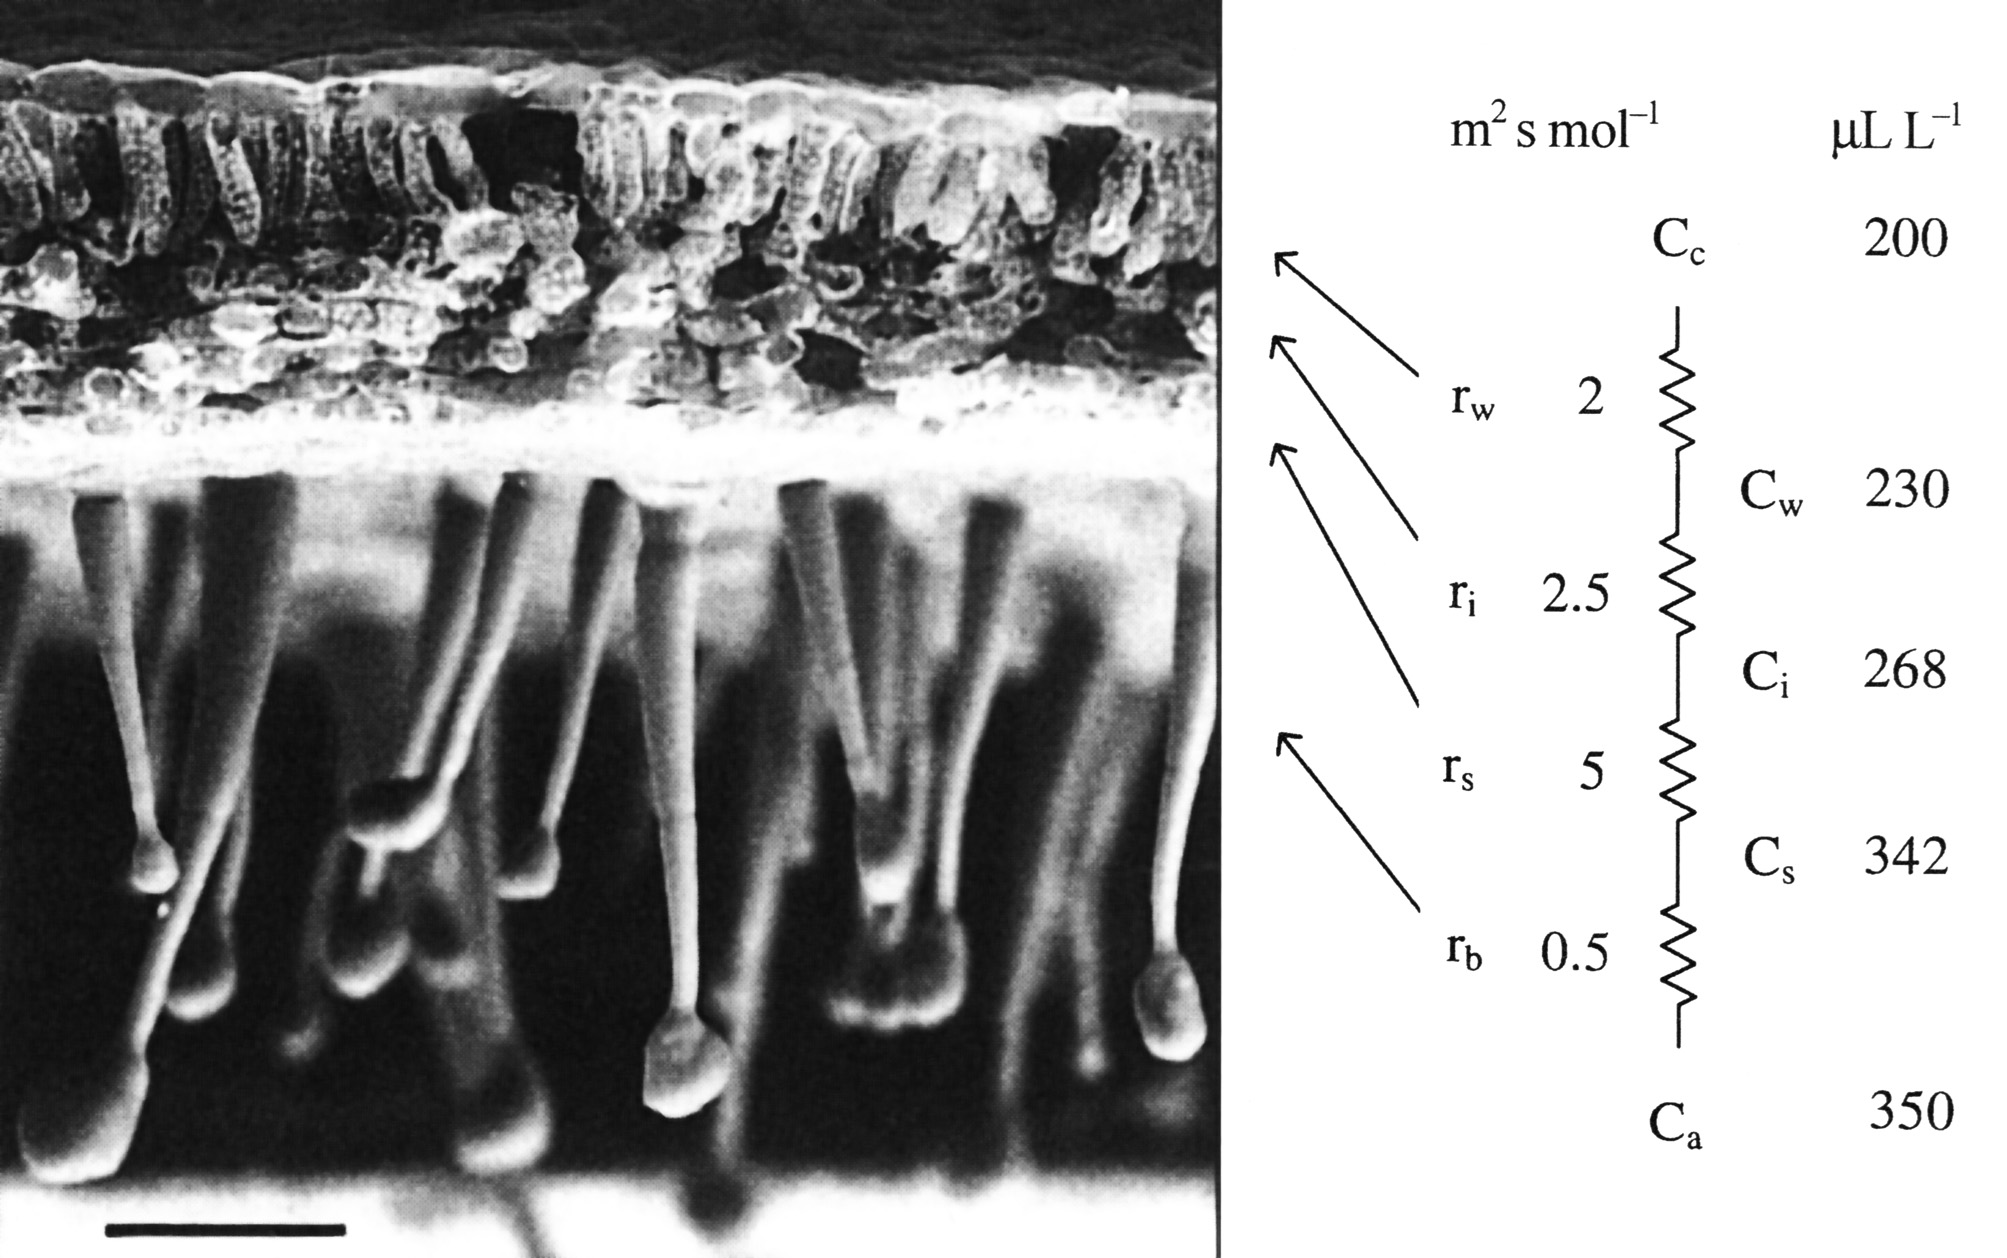
Figure 1.1 A scanning electron micrograph of an uncoated and rapidly frozen piece of tobacco leaf showing a hairy lower leaf surface and cross-sectional anatomy at low magnification. Notional values for resistances to CO2 diffusion are given in units of m2 s mol-1. Corresponding values for CO2 concentration are shown in µL L-1. Ci is routinely inferred from gas exchange measurements and used to construct A:Ci curves for leaf photosynthesis. Scale bar = 100 µm. (Image courtesy J-W. Yu and J. Evans)
In a typical herbaceous dicotyledon (Figure 1.1) lower leaf surfaces are covered with epidermal outgrowths, known to impede movement of small insects, but also contributing to formation of a boundary layer. This unstirred zone of air immediately adjacent to upper and lower epidermes varies in thickness according to surface relief, area and wind speed. Boundary layers are significant in leaf heat budgets and feature in the calculation of stomatal and mesophyll conductances from measurements of leaf gas exchange.
The diffusion of CO2 into leaves can be modelled using an analogue with electrical resistance (R) and conductance (the reverse of resistance), as in Figure 1.1, right hand side. This shows a series of resistances (r) that would be experienced by CO2 molecules diffusing from outside (ambient) air, through the boundary layer (b), the stomata (s), the intercellular airspaces (i), the cell walls and liquid phase (w) to fixed sites inside chloroplasts. These values emphasise the prominence of stomatal resistance within the series.
Corresponding values for CO2 concentration in ambient air (a), the leaf surface (s), the substomatal cavity (i), the mesophyll cell wall surface (w) to the sites of carboxylation with the chloroplasts (c) reflect photosynthetic assimilation within leaves generating a gradient for inward diffusion.
In transverse fracture as shown below in Figure 1.2(A) the bifacial nature of leaf mesophyll is apparent with columnar cells in the palisade layer beneath the upper surface and irregular shaped cells forming the spongy mesophyll below. Large intercellular airspaces, particularly in the spongy mesophyll, facilitate gaseous diffusion. The lower surface of this leaf is shown in Figure 1.2(B). On the left-hand side, the epidermis is present with its irregular array of stomata. Diagonally through the centre is a vein with broken-off hair cells and on the right the epidermis has been fractured off revealing spongy mesophyll cells beneath. Light micrographs of sections cut parallel to the leaf surface (paradermal) through palisade (C) and spongy (D) tissue reveal chloroplasts lying in a single layer and covering most of the internal cell wall surface adjacent to airspaces. Significantly, chloroplasts are rarely present on walls that adjoin another cell. Despite the appearance of close packing, mesophyll cell surfaces within the palisade layer are generally exposed to intercellular airspace. Inward diffusion of CO2 to chloroplasts is thereby facilitated.
Leaves that develop in sunny environments and have high photosynthetic capacities are generally thicker than leaves from shaded environments. This is achieved with more elongate cells within the palisade layer and/or several layers of cells forming the palisade tissue. Thicker leaves in a sunny environment enable more Rubisco to be deployed which confers a higher photosynthetic capacity. Fitting more Rubisco into a unit of leaf area with good access to intercellular airspace requires an increase in mesophyll cell surface which is possible by increasing the thickness of the mesophyll tissue and hence leaf thickness. A thicker leaf in sunny environments is energy effective because enough photons reach chloroplasts in lower cell layers to keep their Rubisco gainfully employed. By contrast, in a shaded habitat, less Rubisco is required for a leaf with lower photosynthetic capacity and this can be fitted into thinner leaves.
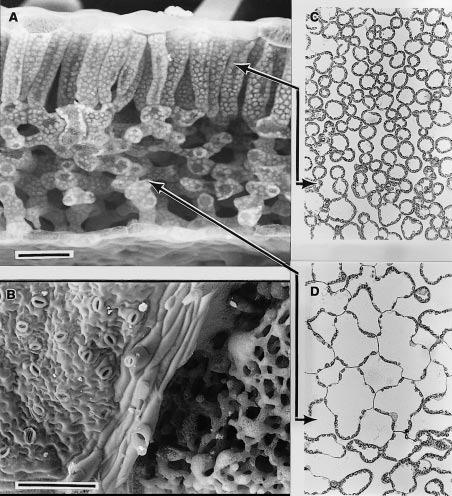
Figure 1.2 A scanning electron micrograph of an uncoated and rapidly frozen piece of tobacco leaf fractured in (A) to reveal columnar mesophyll cells of the palisade layer beneath the upper leaf surface and spongy mesophyll in the lower half. Chloroplasts can be clearly seen covering the inner faces of cell walls. Looking onto the lower surface (B), the epidermis and stomata are present on the left side of the vein, whereas the epidermis was fractured away on the right side, revealing spongy mesophyll tissue. Light micrographs (C, D) of sections cut parallel to the leaf surface are shown for palisade (C) and spongy mesophyll (D) with solid lines showing where the paradermal sections align with (A). Chloroplasts form a dense single layer covering the cell surfaces exposed to intercellular airspace, but are rarely present lining walls where two cells meet. Scale bar in (A) = 50 µm and (B) = 200 µm. (C) and (D) have same magnification as (A). (Images courtesy J. Evans and S. von Caemmerer)

Figure 1.3 Light absorption by pigments in solution and by leaves. Absorbance (A) refers to attenuation of light transmitted through a leaf or a solution of leaf pigments, as measured in a spectrophotometer, and is derived from the expression A = log I0/I where I0 is incident light, and I is transmitted light. The solid curve (scale on right ordinate) shows absorbance of a solution of pigment—protein complexes equivalent to that of a leaf with 0.5 mmol Chl m-2. The dotted curve shows absorptance (scale on left ordinate), and represents the fraction of light entering the solution that is absorbed. Virtually all light between 400 and 500 nm and around 675 nm is absorbed, compared with only 40% of light around 550 nm (green). The dashed curve with squares represents leaf absorptance, which does not reach 1 because the leaf surface reflects part of the incident light. Leaves absorb more light around 550 nm than a solution with the same amount of pigment (75 versus 38%, respectively) because leaves scatter light internally. This increases the pathlength and thereby increases the probability of absorption above that observed for the same pigment concentration in solution. (Based on K.J. McCree, Agric Meteorol 9: 191-216, 1972; J.R. Evans and J.M. Anderson, BBA 892: 75-82, 1987)
Pigments in thylakoid membranes of individual chloroplasts (Figure 1.7) are ultimately responsible for strong absorption of wavelengths corresponding to blue and red regions of the visible spectrum (Figure 1.3). Irradiated with red or blue light, leaves appear dark due to this strong absorption, but in white light leaves appear green due to weak absorption around 550 nm, which corresponds to green light. Ultraviolet (UV) light (wavelengths below 400 nm) can be damaging to macromolecules, and sensitive photosynthetic membranes also suffer. Consequently, plants adapt by developing an effective sunscreen in their cuticular and epidermal layers.
Overall, absorption of visible light by mesophyll tissue is complex due to sieve-effects and scattering. Sieve-effect is an outcome from packaging pigments into discrete units, in this case chloroplasts, while remaining leaf tissue is transparent. This increases the probability that light can bypass some pigment and penetrate more deeply. A regular, parallel arrangement of columnar cells in the palisade tissue with chloroplasts all vertically aligned means that about 80% of light entering a leaf initially bypasses the chloroplasts, and measurements of absorption in a light integrating sphere confirm this. Scattering occurs by reflection and refraction of light at cell walls due to the different refractive indices of air and water. Irregular-shaped cells in spongy tissues enhance scattering, increasing the path length of light travelling through a leaf and thus increasing the probability of absorption. Path lengthening is particularly important for those wavelengths more weakly absorbed and results in nearly 80% absorption, even at 550 nm (Figure 1.3). Consequently, leaves typically absorb about 85% of incident light between 400 and 700 nm; only about 10% is reflected and the remaining 5% is transmitted. These percentages do of course vary according to genotype × environment factors, and especially adaptation to aridity and light climate.
Sunlight entering leaves is attenuated with depth in much the same way as light entering a canopy of leaves shows a logarithmic attenuation with depth that follows Beer’s Law (Section 12.4). Within individual leaves, the pattern of light absorption is a function of both cell anatomy and distribution of pigments. An example of several spatial profiles for a spinach leaf is shown in Figure 1.4. Chlorophyll density peaks in the lower palisade layer and decreases towards each surface. The amount of light declines roughly exponentially with increasing depth through the leaf. Light absorption is then given by the product of the chlorophyll and light profiles. Light absorption initially increases from the upper surface, peaking near the base of the first palisade layer, then declines steadily towards the lower surface. Because light is the pre-eminent driving variable for photosynthesis, CO2 fixation tends to follow the light absorption profile (see 14C fixation pattern in Figure 1.4). However, the profile is skewed towards the lower surface because of a non-uniform distribution of photosynthetic capacity. Chloroplasts near the upper surface have ‘sun’-type characteristics which include a higher ratio of Rubisco to chlorophyll and higher rate of electron transport per unit chlorophyll. Chloroplasts near the lower surface show the converse features of ‘shade’ chloroplasts. Similar differences between ‘sun’ and ‘shade’ leaves are also apparent. Chloroplast properties do not change as much as the rate of absorption of light. Consequently, the amount of CO2 fixed per quanta absorbed increases with increasing depth beneath the upper leaf surface. The lower half of a leaf absorbs about 25% of incoming light, but is responsible for about 31% of a leaf’s total CO2 assimilation.
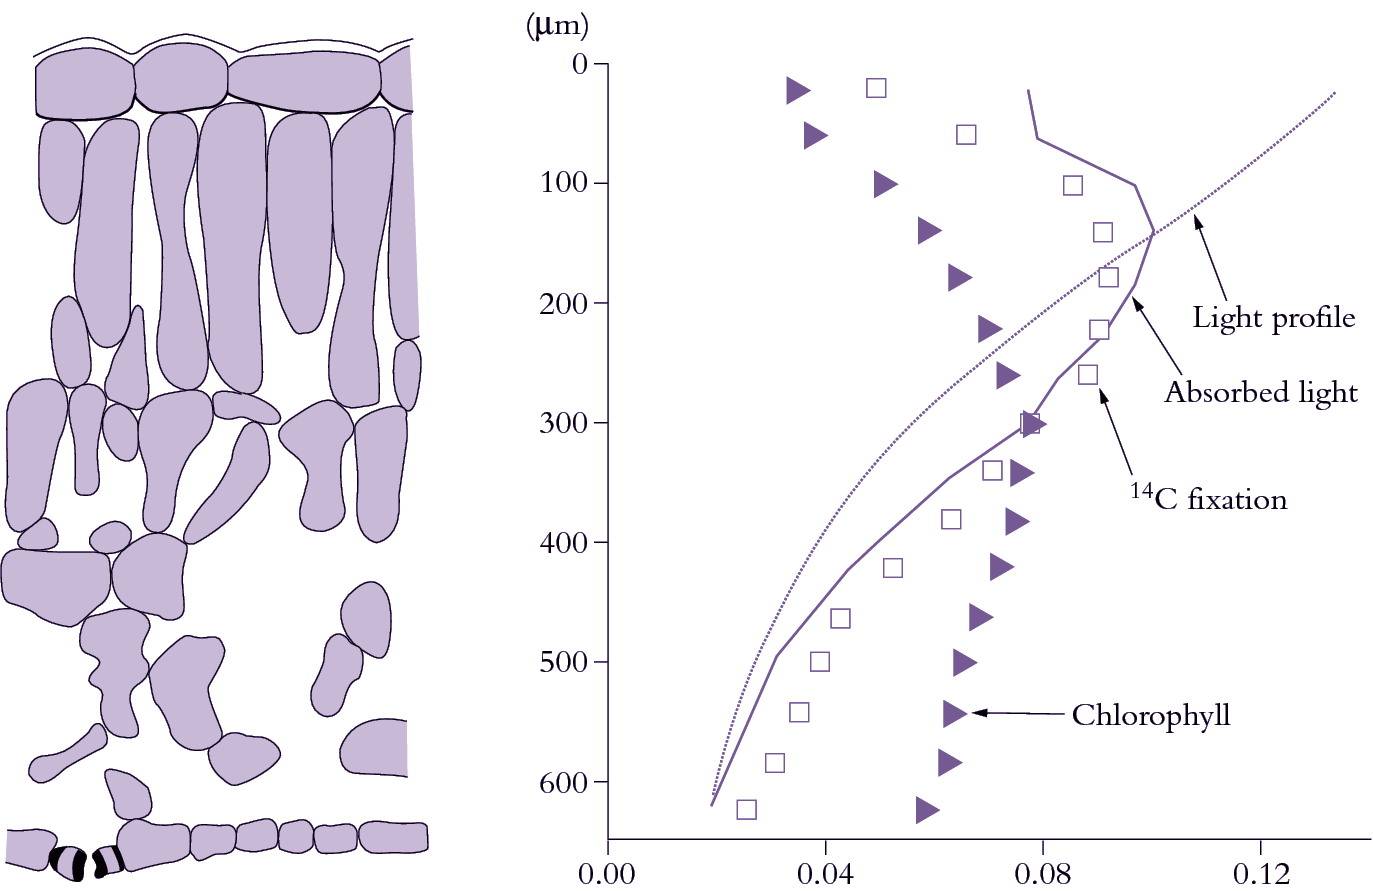
Figure 1.4 Profiles of chlorophyll, light absorption and photosynthetic activity through a spinach leaf. Cell outlines are shown in transverse section (left side). Triangles represent the fraction of total leaf chlorophyll in each layer. The light profile (dotted curve) can then be calculated from the Beer—Lambert law. The profile of absorbed light is thus the product of the chlorophyll and light profiles (solid curve). CO2 fixation, revealed by 14C labelling, follows the absorbed light profile, being skewed towards slightly greater depths. (Based on J.N. Nishio et al., Plant Cell 5: 953-961, 1993; J.R. Evans, Aust J Plant Physiol 22: 865-873, 1995)
Leaves are covered with a barrier or ‘cuticle’ on the outer walls of epidermal cells that is impermeable to both water and CO2. To enable CO2 entry into the leaf for photosynthesis, the epidermis is perforated by pores called stomata (Figure 1.5). As CO2 molecules diffuse inwards they encounter an opposite flux of H2O molecules rushing outwards that is three to four orders of magnitude stronger. This problem of transpirational water loss is a particular problem for plants in hot, dry climates, such as in most of Australia. Leaves control this gas exchange by adjusting the aperture of stomata which can vary within minutes in response to changes in several environmental variables including light, humidity and CO2 concentration (see Chapter 15 for more details). Air-spaces inside leaves are effectively saturated with water vapour (equivalent to 100% relative humidity at that leaf temperature) and because air surrounding illuminated leaves is almost universally drier, water molecules diffuse outwards down this concentration gradient from leaf to air.
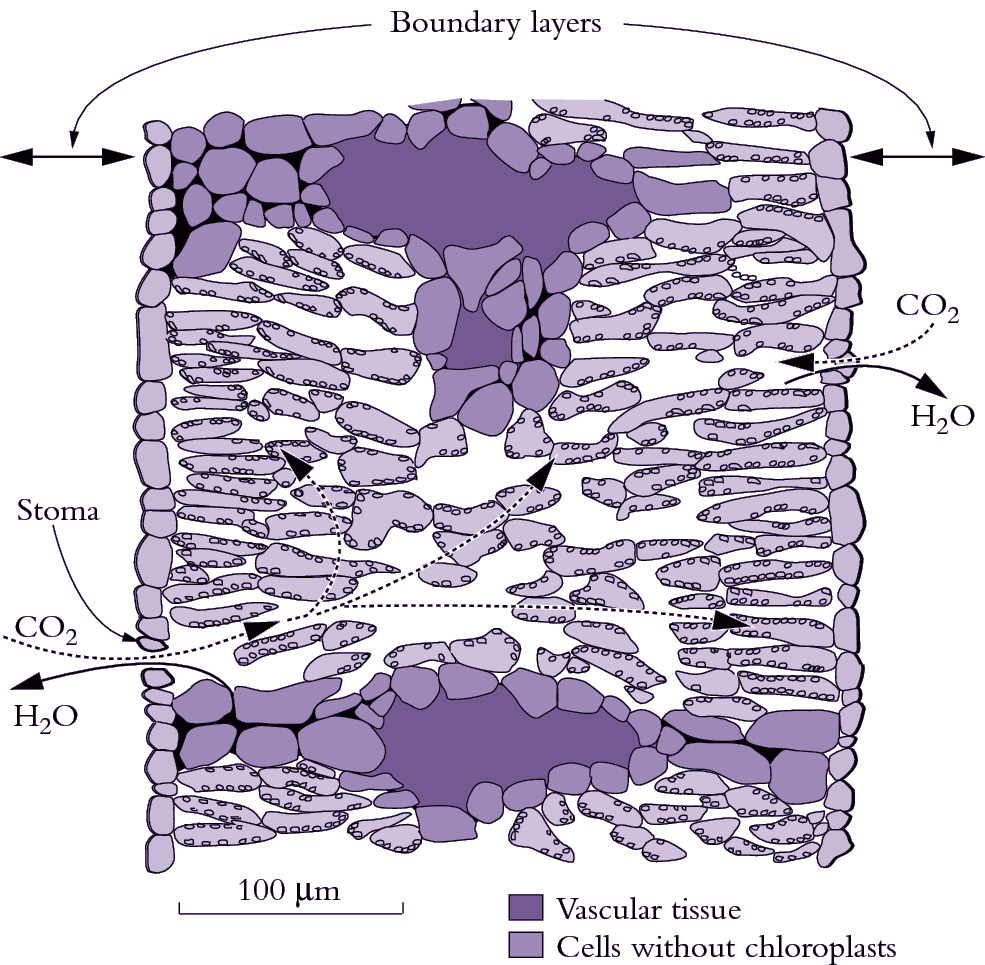
Figure 1.5 Diagram of a transverse section through an isolateral Eucalyptus pauciflora leaf which is normally pendulant. Palisade tissue occurs beneath both surfaces with spongy tissue and oil glands (not shown) in the middle. Putative pathways for diffusion of H2O out of substomatal cavities are shown by the solid curved arrows. CO2 diffuses inwards and H2O diffuses outwards in response to concentration differences between the leaf and air. Such gas exchange is restricted by a boundary layer (the unstirred layer of air at the leaf surface) and by stomata. One stoma is shown on each surface. CO2 diffusion continues inside the leaf mesophyll through airspaces between cells (curved dashed arrows) to reach cell walls adjacent to each chloroplast where CO2 dissolves and then diffuses into the chloroplast to reach the carboxylating enzyme Rubisco. Bundle sheath extensions (bottom of diagram) reach both epidermis and create an internal barrier to lateral diffusion. (Based on J.R. Evans et al., Planta 189: 191-200, 1993)
The diffusion pathway for H2O out of a leaf is usually divided into two parts, namely the boundary layer of still air at the leaf surface and stomatal pores (Figure 1.5). Boundary layer thickness depends on windspeed, leaf dimensions and the presence of surface structures (e.g. hairs in Figure 1.1). Positioning of stomata also varies between species. Leaves of terrestrial plants always have stomata on their lower (abaxial) surface but many species have stomata on both surfaces, especially if they have high photosynthetic rates and are in sunny locations such as pendulant leaves of eucalypts. Adaptations for arid environments include having surface structures like hairs and waxes, which increase the thickness of the boundary layer, and leaf rolling and encryption of stomata by placing them in crevices in the leaf surface. While these features restrict water loss, they also impose an increased resistance (decreased conductance) to CO2 uptake.
The flux of water escaping from a leaf, called transpiration rate, can be understood from Fick’s law. It depends on the product between conductance and the gradient in water vapour from the inside of the leaf to the surrounding air. The vapour pressure gradient depends on both the humidity of the surrounding air and leaf temperature. Dry air (low humidity), or hotter leaf temperatures will result in greater transpiration rates for a given conductance. Maximum leaf conductance depends on the number and size of stomata per unit leaf area which is a leaf property that becomes fixed during development. However, the aperture of stomata can be varied, so stomatal conductance can vary over the timescale of minutes. Stomatal conductance responds to light, CO2 and humidity. The sensitivity of a leaf to these variables is not fixed but can change over time in response to, for example, drought. Transpiration rate can be measured by a variety of means. With the availability of portable instruments, it is now most commonly obtained by measuring the increase in water vapour content of air from a leaf enclosed in a chamber. Stomatal conductance can then be calculated from Fick’s law by dividing the transpiration rate by the vapour pressure gradient between the leaf and the air.
CO2 molecules diffusing inwards from ambient air to chloroplasts encounter restrictions additional to boundary layer and stomata (Figure 1.5). CO2 must also diffuse from substomatal cavities throughout the mesophyll, dissolve in wet cell walls, cross the plasma membrane to enter the cytosol, diffuse into chloroplasts across a double membrane (outer envelope in Figure 1.7) and finally reach fixation sites within the stroma of those chloroplasts. The combination of these restrictions from intercellular airspace to the sites of fixation within chloroplasts has been termed mesophyll conductance.
There is considerable variation in leaf anatomy and hence potential restriction to CO2 diffusion, but in general leaves with high rates of photosynthesis tend to have more permeable leaves (e.g. tobacco in Figure 1.2) and this complex anatomy ensures a greatly enlarged surface area for diffusion across interfaces. Indeed the total mesophyll cell wall area can be 20 times that of the projected leaf surface.
Chloroplasts tend to be appressed against cell walls adjacent to intercellular spaces (Figure 1.2 C, D) which improves access to CO2, and they contain carbonic anhydrase which speeds up diffusion of CO2 by catalysing interconversion of CO2 and bicarbonate within the stroma of chloroplasts. Although CO2 rather than HCO3– is the substrate species for Rubisco, the presence of carbonic anhydrase enables bicarbonate ions, which are more abundant under the alkaline conditions (pH 8.0) that prevail inside chloroplasts, to diffuse to Rubisco in concert with diffusion of CO2. By sustaining a very rapid equilibration between CO2 and HCO3– immediately adjacent to active sites on Rubisco, carbonic anhydrase enhances inward diffusion of inorganic carbon.
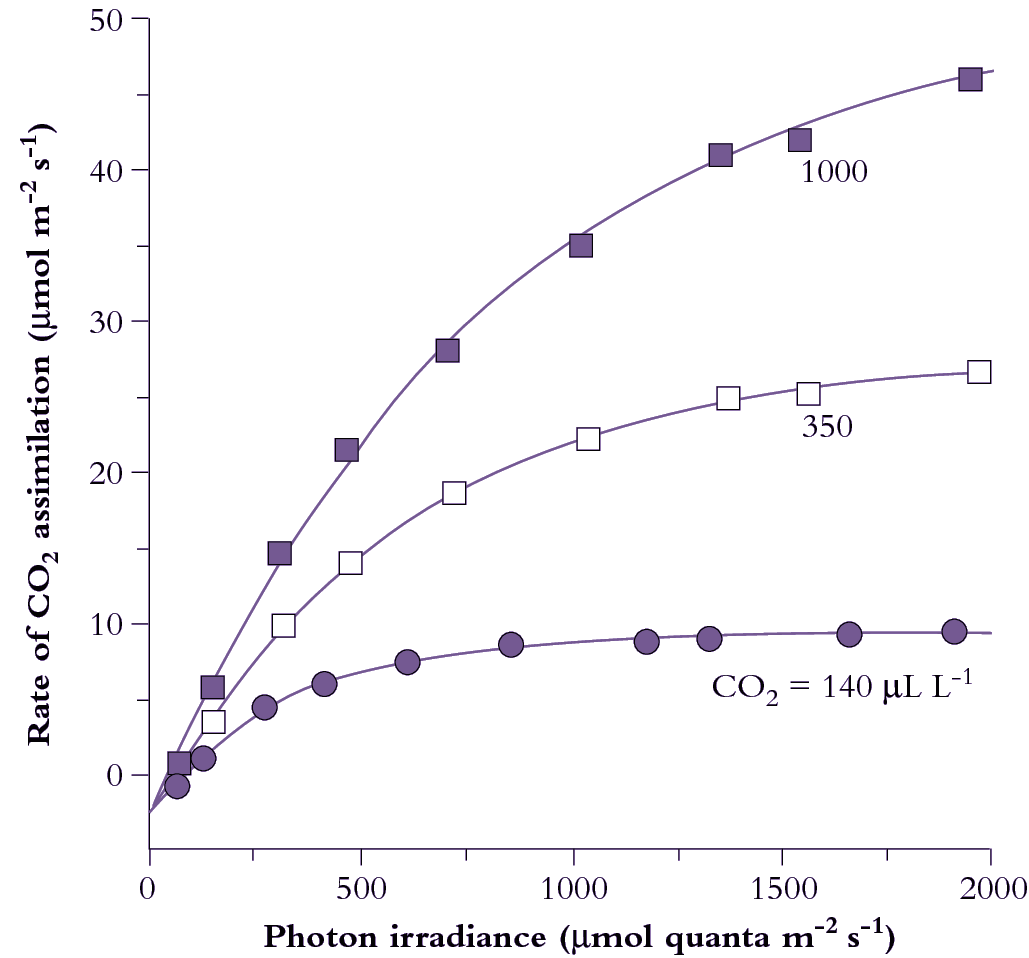
Figure 1.6 Photosynthetic response to photon irradiance for a Eucalyptus maculata leaf measured at three ambient CO2 concentrations, 140, 350 and 1000 µmol mol-1. Irradiance is expressed as µmol quanta of photosynthetically active radiation absorbed per unit leaf area per second, and net CO2 assimilation is inferred from a drop in CO2 concentration of gas passing over a leaf held in a temperature-controlled cuvette. CO2 evolution in darkness is shown on the ordinate as an extrapolation below zero. The irradiance at which net CO2 exchange is zero is termed the light compensation point (commonly 15-50 µmol quanta m-2 s-1, shade to sun species respectively). The initial slope of light-response curves for CO2 assimilation per absorbed quanta represents maximum quantum yield for a leaf. (Based on E. Ögren and J.R. Evans, Planta 189: 182-190, 1993)
Light impinging on plants arrives as discrete particles we term photons, so that a flux of photosynthetically active photons can be referred to as ‘photon irradiance’. Each photon carries a quantum of electromagnetic (light) energy. In biology the terms photon and quantum (plural quanta) tend to be used interchangeably.
CO2 assimilation varies according to both light and CO2 partial pressure. At low light (low photon irradiance in Figure 1.6) assimilation rate increases linearly with increasing irradiance, and the slope of this initial response represents maximum quantum yield (mol CO2 fixed per mol quanta absorbed). Reference to absorbed quanta in this expression is important. Leaves vary widely in surface characteristics (hence reflectance) as well as internal anatomy and chlorophyll content per unit leaf area. Therefore, since absorption of photosynthetically active quanta will vary, quantum yield expressed in terms of incident irradiance does not necessarily reflect the photosynthetic efficiency of the mesophyll. In the case of comparisons between sun and shade leaves, it has led to a widely held but mistaken belief that shade leaves (thinner and with higher chlorophyll content) are more efficient. Expressed in terms of absorbed quanta, sun and shade leaves have virtually identical quantum efficiencies for CO2 assimilation.
Assimilation rate increases more slowly at higher irradiances until eventually a plateau is reached where further increases in irradiance do not increase the rate of CO2 assimilation (Figure 1.6). Chloroplasts are then light saturated. Absolute values for both quantum yield and light-saturated plateaux depend on CO2 concentration. Quantum yield increases as CO2 concentration increases as it competes more successfully with other species such as oxygen, at the binding site on Rubisco. Leaf absorptance has a hyperbolic dependence on chlorophyll content. For most leaves, 80–85% of 400–700 nm light is absorbed and it is only in leaves produced under severe nitrogen deficiency where there is less than 0.25 mmol Chl m–2 that absorptance falls below 75%.
The plateau in Figure 1.6 at high irradiance is set by maximum Rubisco activity. With increasing CO2 partial pressure, the rate of carboxylation increases. The transition from light-limited to Rubisco-limited CO2 assimilation as irradiance increases becomes progressively more gradual at higher CO2 partial pressures. In part, this gentle transition reflects the fact that a leaf is a population of chloroplasts which have different photosynthetic properties depending on their position within that leaf. As discussed above, the profile of photosynthetic capacity per chloroplast changes less than the profile of light absorption per chloroplast (Figure 1.4). This results in an increase in CO2 fixed per quanta absorbed with increasing depth. A transition from a light to a Rubisco limitation therefore occurs at progressively higher incident irradiances for each subsequent layer and results in a more gradual transition in the irradiance response curve of a leaf compared to that of a chloroplast.
Photosynthetic capacity of leaves varies widely according to light, water and nutrient availability and these differences in capacity usually reflect Rubisco content. Leaves in high light environments (‘sun’ leaves) have greater CO2 assimilation capacities than those in shaded environments and this is reflected in the larger allocation of nitrogen-based resources to photosynthetic carbon reduction (PCR cycle; Section 2.1). Sun leaves have a high stomatal density, are thicker and have a higher ratio of Rubisco to chlorophyll in order to utilise the larger availability of photons (and hence ATP and NADPH). Shade leaves are larger and thinner, but have more chlorophyll per unit leaf dry weight than sun leaves. They can have a greater quantum yield per unit of carbon invested in leaves, but with a relatively greater allocation of nitrogen-based resources to photon capture, shade leaves achieve a lower maximum rate of assimilation.
Despite such differences in leaf anatomy and chloroplast composition, leaves sustain energy transduction and CO2 fixation in an efficient and closely coordinated fashion. Processes responsible are discussed below (Section 1.2).
Susanne von Caemmerer, Research School of Biology, Australian National University
CO2 assimilation rate at a whole-leaf level can be analysed in terms of the underlying biochemistry. Traditionally, photosynthesis has been divided into light and dark reactions. The light reactions describe photosynthetic electron flow which generates reducing power (NADPH) and the formation of ATP. The dark reactions consist of the photosynthetic carbon reduction and oxidation cycles which start with Rubisco as the primary catalyst.
In this essay A:Ci refers to CO2 assimilation rate (A) as a function of intercellular CO2 (Ci) which can either be expressed in terms of concentration (µL of CO2 per litre of gas, µL L–1, or ppm) or partial pressure (µbar, or Pa). Multiplying concentration by atmospheric pressure converts it to partial pressure (e.g. 400 µL L–1 x 0.95 bar = 380 µbar). Partial pressures are preferred as this is the form that relates best to Rubisco performance and takes into account the altitude where the measurement was made. At sea level where atmospheric pressure averages one bar, the values for concentration and partial pressure are the same. A:Ci curves are created by measuring A in various atmospheric CO2 concentrations.
Physical concepts of leaf gas exchange
Penman and Schofield (1951) put diffusion of CO2 and water vapour through stomata on a firm physical basis. Their ideas were taken up at Wageningen by Pieter Gaastra in the 1950s and modern analytical gas exchange is often attributed to this seminal work (Gaastra 1959) where he even constructed his own infrared gas analyser and other equipment necessary to make measurements of CO2 and water vapour exchange. His work was a landmark because it examined CO2 assimilation and water vapour exchange rates of individual leaves under different environmental conditions, and he distinguished between stomatal and internal resistances. Gaastra calculated resistances to water vapour and CO2 diffusion from two equations (here in our simplified notation) which are based on Fick’s Law for the diffusion of gases.
\[ E=\frac{w_i-w_a}{r_{sw}} \text{ and } A=\frac{C_a-C_i}{r_{sc}} \tag{1} \]
where E and A are the fluxes of water vapour and CO2 and \(w_i\) and \(c_i\) and \(w_a\) and \(c_a\) are the mole fractions of water vapour and CO2 in intercellular air spaces and ambient air respectively. The denominator terms, \(r_{sw}\) and \(r_{sc}\), represent stomatal resistances to H2O and CO2 diffusion respectively. Gaastra assumed that \(w_i\) was equivalent to the saturated vapour pressure at the measured leaf temperature. By rearranging equation 1, \(r_{sw}\) could be calculated:
\[ r_sw=\frac{w_i-w_a}{E} \tag{2} \]
Knowing that resistances to CO2 and water vapour are related by the ratio of their diffusivities, he calculated stomatal resistance to CO2 diffusion, \(r_{sc}\). Gaastra realised that the diffusion path for CO2 is longer than that of water vapour, as CO2 had to diffuse from the intercellular airspaces through the cell wall across membranes to the chloroplast stroma where CO2 fixation by Rubisco takes place. He therefore extended the equation for CO2 assimilation to:
\[ A=\frac{C_a-C_c}{r_{sc}+r_m} \tag{3} \]
where Cc represented CO2 concentration in the chloroplasts.
Gaastra analysed the dependence of CO2 assimilation rate on light, CO2 and temperature, and observed that at low CO2 concentrations the rate of CO2 assimilation was independent of temperature whereas it was strongly influenced by temperature at higher CO2 concentrations. This led him to conclude that the rate of CO2 uptake was completely limited by CO2 diffusion processes at low CO2 and that biochemical processes became limiting only at high CO2. The belief that CO2 diffusion was limiting gave rise to the assumption that chloroplastic CO2 concentration was close to zero. This led to the erroneous simplification of the above equation such that the total resistance to CO2 diffusion could be calculated from CO2 assimilation rate and the ambient CO2 concentration alone. Since stomatal resistances could be calculated from measurements of water vapour diffusion, it was also possible to calculate mesophyll resistance to CO2 diffusion. In Australia particularly, there was great interest in determining the relative importance of stomatal versus mesophyll resistance in limiting CO2 assimilation rates under adverse conditions of high temperature and water stresses. In global terms, much of the pioneering work was undertaken in this country (see, for example, Bierhuizen and Slatyer 1964).
Calculation of intercellular CO2, Ci and the first A versus Ci curves

Figure 1. An early A:Ci curve showing the CO2 assimilation rate of cotton at a range of cell wall CO2 concentrations (redrawn from Troughton and Slayter (1969) and retaining original units for CO2 flux). For comparative purposes, 10 × 10-8 g cm-2 s-1 would be equivalent to 22.27 µmol CO2 m-2 s-1, and 1 µg L-1 would be equivalent to 0.54 µL L-1 (assuming a gram molecular weight of 44 for CO2, and measurements at normal temperature and pressure). (a) Leaf temperature influences the overall shape of CO2 response curves (measured in O2-free air) but has no effect on the initial slope where response to CO2 is limited by Rubisco activity. This family of curves comes from repeated measurements of gas exchange by the same leaf at five different temperatures (values shown) and indicated in the figure by five different symbols. (b) CO2 response curves for two leaves of cotton measured in O2-free air at 25°C and three levels of relative water content. Legend: ● leaf 1, 92% water content; O leaf 1, 56%; ▲ leaf 2, 92%; Δ leaf 2, 69%. Identical slopes regardless of treatment mean that variation in relative water content over this range is without effect on CO2 assimilation within mesophyll tissues. By implication, reduction in CO2 uptake as commonly observed on whole leaves under moisture stress would be attributable to stomatal factors.
Although CO2 concentration in intercellular airspaces, Ci, was explicit in Gaastra’s equations, this term was first specifically calculated by Moss and Rawlings in 1963, and the first extensive use of the parameter was made by Whiteman and Koller in 1967, who examined stomatal responses to CO2 and irradiance, concluding that stomata were more likely to respond to Ci rather than Ca. The first bona fide response curves of CO2 assimilation rate to Ci rather than Ca were those of Troughton and Slatyer (1969) (Figure 1). In Figure 1(a), Ci was derived from measurements of CO2 uptake in an assimilation chamber where air passed through a leaf, rather than over both surfaces concurrently (as became commonplace in subsequent designs), and such estimates would differ slightly. More importantly, those measurements were made at different temperatures and confirmed that CO2 assimilation was not greatly affected by temperature at low Ci. Later, this lack of temperature dependence was explained by the kinetics of Rubisco (von Caemmerer and Farquhar 1981). Figure 1(b) shows the initial slope of CO2 response curves measured at different stages of water stress. In this case, water stress has affected stomatal resistance (as the Ci obtained at air levels of CO2 occur at progressively lower Ci) but not the relationship between CO2 assimilation rate and Ci. A versus Ci response curves thus provided an unambiguous distinction between stomatal and non-stomatal effects on CO2 assimilation and, provided stomata respond uniformly across both leaf surfaces, that distinction can be made quantitative.
Before we head further into a discussion of our understanding and interpretation of more comprehensive CO2 response curves, we must take an important digression into development of mathematical models of C3 photosynthesis.
Biochemistry of photosynthesis and leaf models
Gas exchange studies focused initially on physical limitations to diffusion, but it was not long before persuasive arguments were being brought forward to show that leaf biochemistry must influence the rate of CO2 fixation even at low CO2 concentrations. Björkman and Holmgren (1963) made careful gas exchange measurements of sun and shade ecotypes of Solidago growing in Sweden, and noted strong correlations between photosynthetic rate measured at high irradiance and ambient CO2 and the nitrogen content of leaves, and later also related it to different concentrations of Rubisco (then called carboxydismutase). Anatomical studies implied that thin shade leaves would have less internal diffusion resistance to CO2 than thicker sun leaves where cells were more densely packed, but the opposite was observed. Furthermore, following earlier discoveries that CO2 assimilation rate was enhanced under low-O2, Gauhl and Björkman (1969), then at Stanford, showed very elegantly that O2 concentration affected CO2 assimilation rate but not water vapour exchange (i.e. stomata did not respond to a change in O2). Clearly, the increase in CO2 assimilation rates seen with a decrease in O2 concentration could not be explained via a limitation on CO2 diffusion.
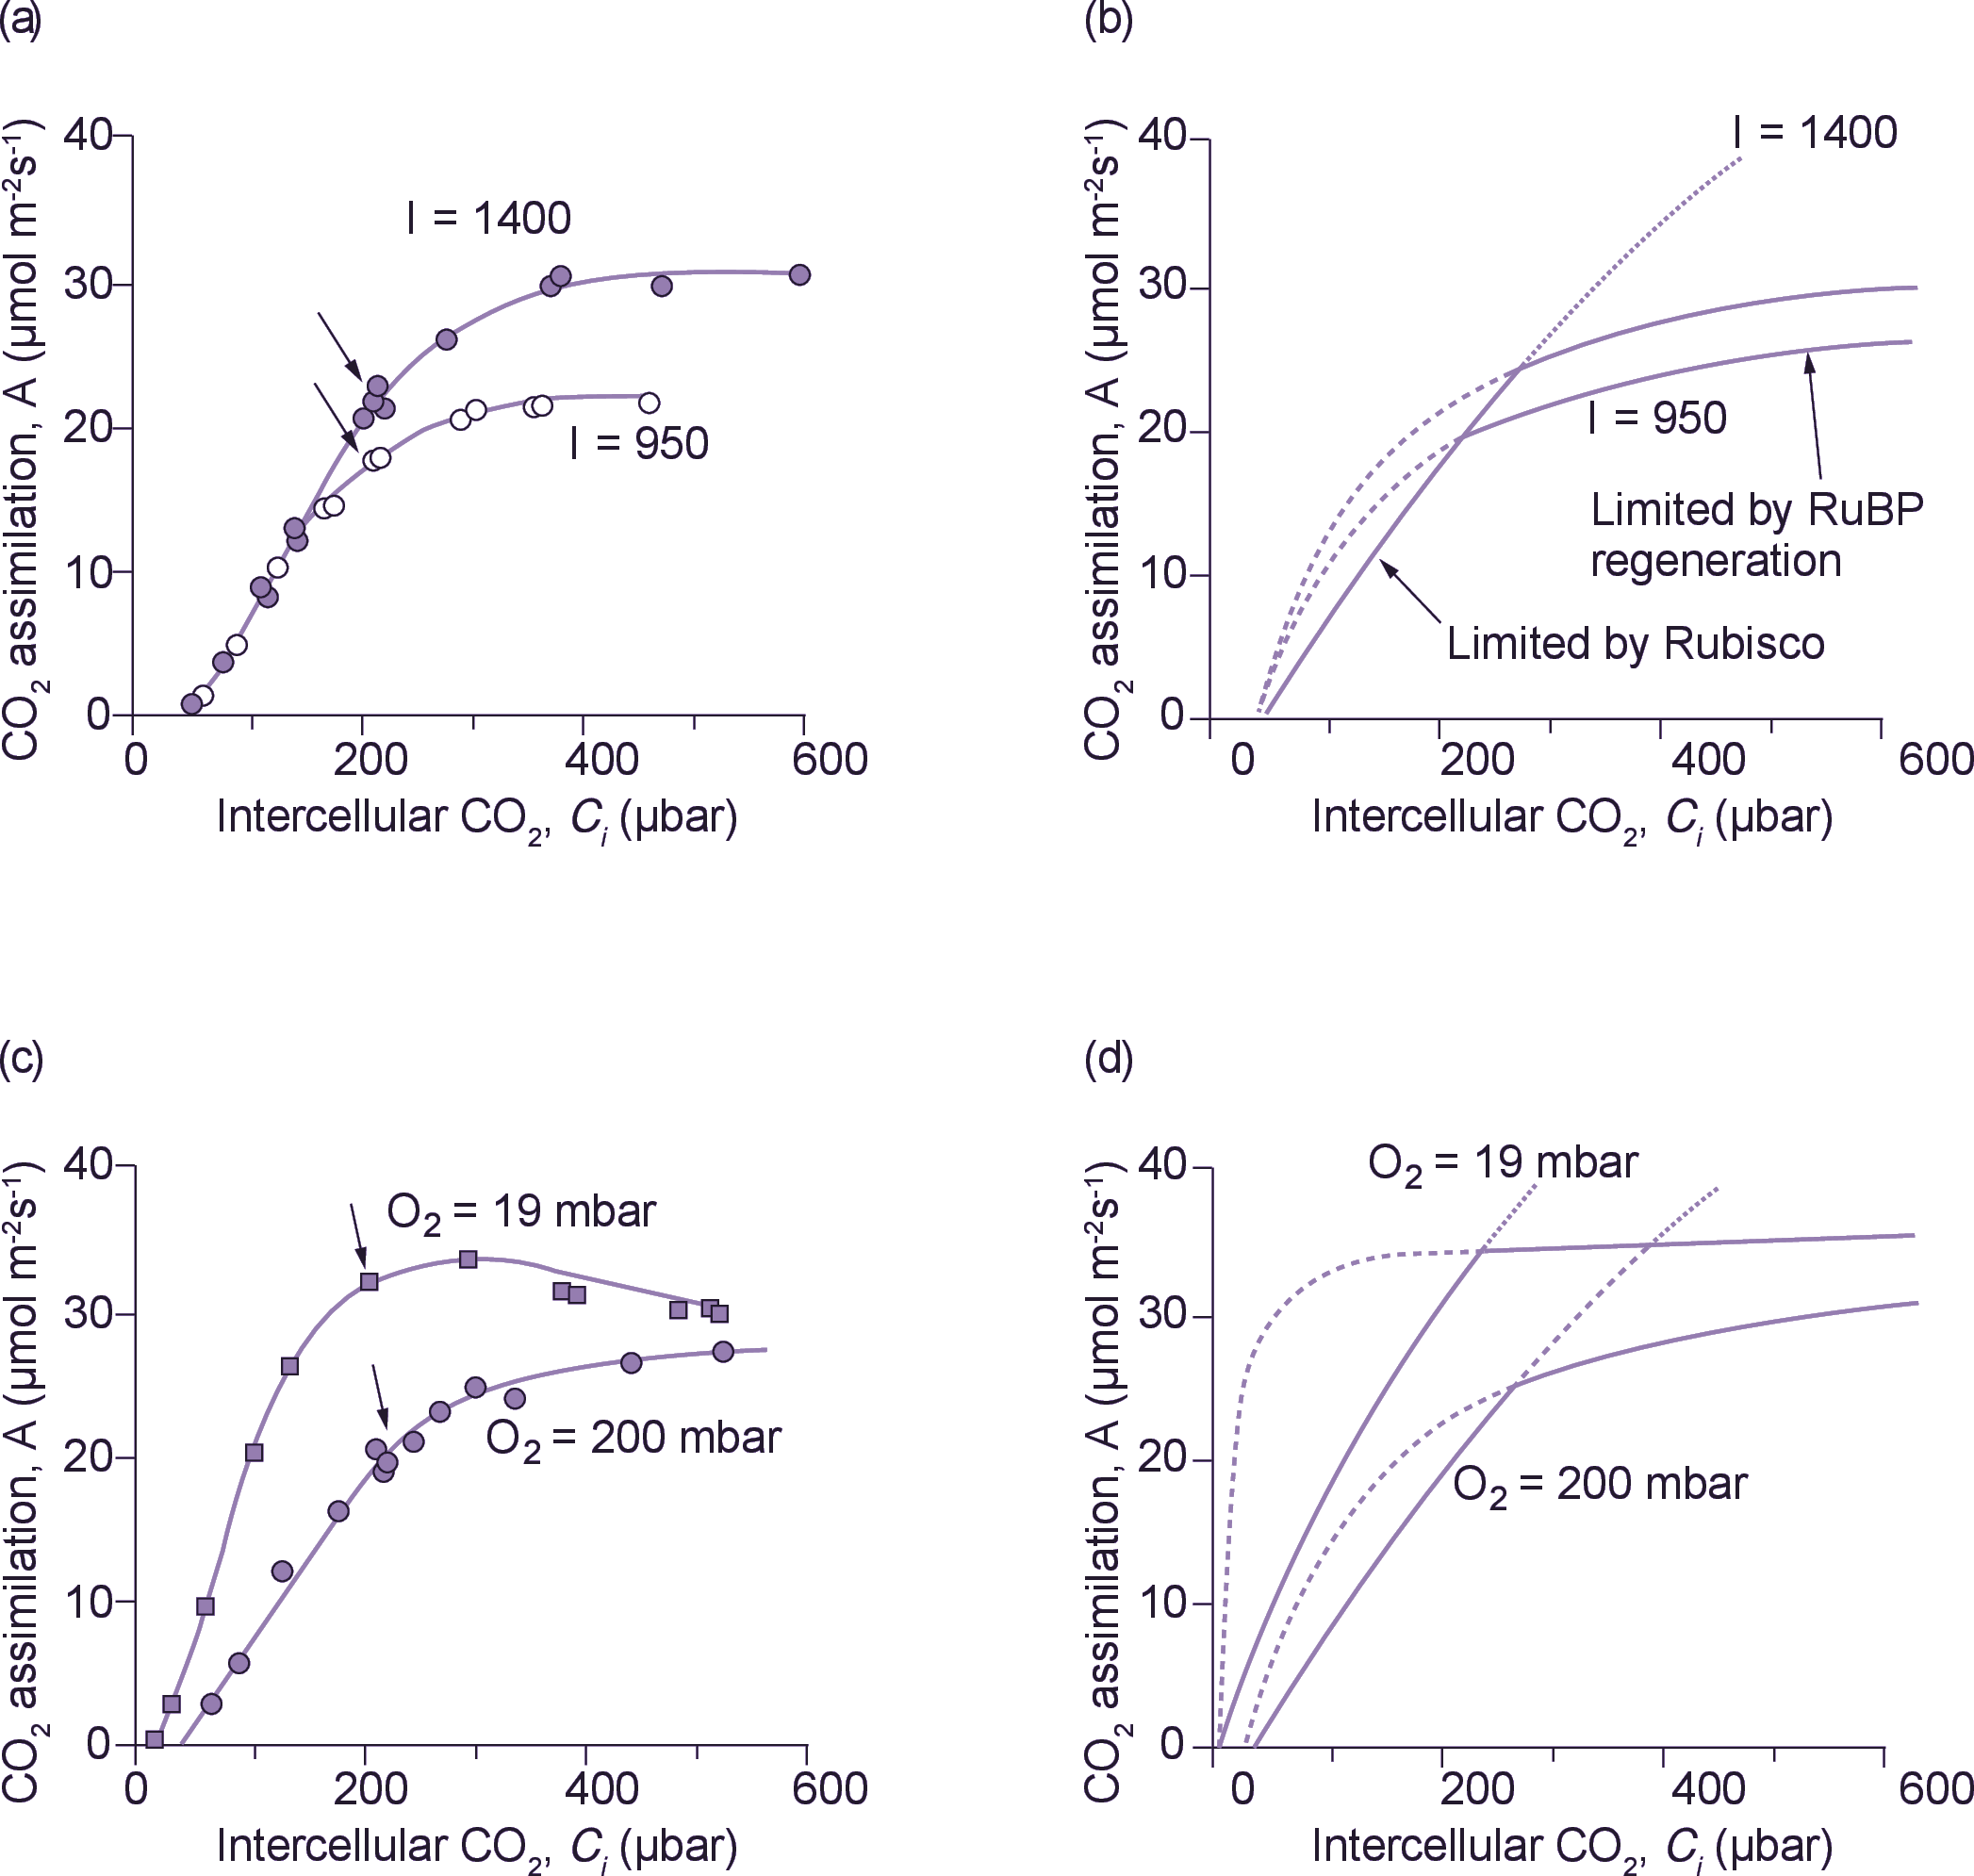
Figure 2. Comparison of measured and modelled CO2 response curves. (a) CO2 assimilation rate (A) v. intercellular CO2 partial pressure (Ci) in Phaseolus vulgaris measured at two irradiances and a leaf temperature of 28°C. Arrows indicate points obtained at an external CO2 partial pressure of 330 µbar, which was the ambient CO2 partial pressure in Canberra around 1980. (b) Modelled CO2 response curves. The solid curve extending from the x axis represents the Rubisco-limited rate of CO2 assimilation.
\[ A=\frac{\left(C_i - \Gamma_{*} \right) V_{cmax}}{C_i + K_c \left( 1 + O / K_o \right)} -R \]
The dashed lines and their extensions represent the electron-transport-limited rates of CO2 assimilation at the two irradiances.
\[ A=\frac{J \left( C_i - \Gamma_{*} \right)}{4.5C_i + 10.5 \Gamma} - R \]
For further details, see von Caemmerer and Farquhar (1981). (c) CO2 assimilation rate v. intercellular CO2 partial pressure in Phaseolus vulgaris measured at two O2 partial pressures at a leaf temperature of 28°C. Arrows indicate points obtained at an external CO2 partial pressure of 330 µbar. (d) Modelled CO2 response curves for conditions applied in (c) using the equations given in (b).
Early mathematical models of leaf photosynthesis were extensions of Gaastra’s resistance equation, and could not accommodate the O2 sensitivity of CO2 assimilation. They were quickly followed by development of more biochemical models in the early 1970s and the discoveries by Bowes et al. (1971) that Rubisco was responsible for both carboxylation and oxygenation of RuBP (a five-carbon phosphorylated sugar, regenerated by the photosynthetic carbon reduction (PCR) cycle of chloroplasts). This crucial observation of dual function put Rubisco at centre stage. Laing et al. (1974) were first to compare the gas exchange of soybean leaves with the in vitro kinetics of Rubisco and suggested the following equation for the net CO2 assimilation rate:
\[ A=V_c \left(1-0.5\frac{V_o}{V_c} \right) \tag{4} \]
where \(V_c\) and \(V_o\) are the rates of Rubisco carboxylation and oxygenation (later on a term for mitochondrial respiration was added to most models). Laing et al. related a ratio of the rates of carboxylation to oxygenation of RuBP to the concentration of its substrates, CO2, \(C\), and O2, \(O\), and showed that:
\[ \frac{V_o}{V_c} = \frac{V_{omax} K_c}{V_{cmax} K_o} \frac{O}{C} = \frac{2 \Gamma_{*}}{C} \tag{5} \]
where \(K_c\), \(K_o\), \(V_{cmax}\), \(V_{omax}\) are the corresponding Michaelis Menten constants and maximal activities of carboxylase and oxygenase functions respectively and \(\Gamma_{*}\)is the CO2 compensation point in the absence of mitochondrial respiration.
A note on \(\Gamma\): illuminated leaves held in a closed circuit of recirculating air will reduce CO2 to a ‘compensation point’ where uptake and generation of CO2 are balanced; this is commonly 50–100 ppm for C3 plants and referred to as \(\Gamma\). A CO2 response curve for leaf photosynthesis will show a similar value as an intercept on the abscissa. \(\Gamma\) can thus be measured empirically, and will be an outcome of interactions between photosynthesis, photorespiration and dark (mitochondrial) respiration (R). If allowance is made for R, the CO2 compensation point would then be slightly lower, and is termed \(\Gamma_{*}\). As with measured \(\Gamma\), this inferred CO2 compensation point, \(\Gamma_{*}\) , is linearly related to O2, an observation that intrigued earlier observers but was easily reconciled with the dual function of Rubisco. Laing et al. (1974) used Equations 4 and 5 to predict this linear dependence of \(\Gamma_{*}\) on O2, and with subsequent confirmation Rubisco became a key player in photosynthetic models. (Equation 4 assumes that for each oxygenation, 0.5 CO2 are evolved in the subsequent photorespiratory cycle, although there has been some debate over this stoichiometry.) If the enzyme reaction is ordered with RuBP binding first, the rate of carboxylation in the presence of the competitive inhibition by O2 at saturating RuBP concentration can be given by
\[ V_c=\frac{CV_{cmax}}{C+K_c \left( 1+O⁄K_o \right)} \tag{6} \]
When combined with Equation 4 this gave a simple expression of net CO2 fixation rate:
\[ A = \frac{\left(C_i - \Gamma_{*} \right) V_{cmax}}{C_i + K_c \left( 1 + O / K_o \right)} \tag{7} \]
which depends on the maximal Rubisco activity and provided the quantitative framework for comparing rates of CO2 assimilations with the amount of Rubisco present in leaves (von Caemmerer and Farquhar 1981). Difference in CO2 assimilation rates observed under different growth conditions could then be explained according to variations in the amount of Rubisco present in leaves. In Figure 2 the dotted line shows a CO2 response curve modelled by Equation 7. Chloroplast CO2 partial pressure was then assumed to be similar to that in the intercellular airspaces. Using on-line discrimination between 13CO2 and 12CO2, and deriving an estimate of CO2 partial pressure at fixation sites within chloroplasts, we subsequently learned that a further draw down can occur, but the general applicability of Equation 7 was not compromised. As an aside, these equations became basic to most photosynthetic models long before the order of the reaction mechanism of Rubisco had been unequivocally established. Had CO2 and O2 bound to Rubisco before RuBP, or the reaction not been ordered, our equations would have been much more complex with both Km(CO2) and Km(O2) dependent upon RuBP concentration.

Figure 3. Transgenic tobacco with reduced amount of Rubisco shows no limitation by the rate of RuBP regeneration. CO2 assimilation response curves in wild-type tobacco ■, and in transgenic tobacco with reduced amount of Rubisco □, were measured at a photon irradiance of 1000 µmol quanta m-2 s-1 and a leaf temperature of 25°C. Lines show Rubisco-limited rates of CO2 assimilation (see legend to Figure 2). The reduction in Rubisco in transgenic tobacco was achieved with an antisense gene directed against the mRNA of the Rubisco small subunit (Hudson et al. 1992). Arrows indicate the points obtained at an external CO2 partial pressure of 350 µbar.
Regeneration of RuBP and electron transport rate
Equation 7 could mimic CO2 assimilation rate at low Ci , as well as O2 effects on CO2 uptake, but measured rates of CO2 assimilation saturated much more abruptly at high CO2 concentrations than could be predicted from Rubisco kinetics (Figure 2). Using a novel approach in Estonia, Laisk and Oja (1974) proposed that CO2 assimilation was limited by RuBP regeneration rate at high Ci. They had fed brief pulses of CO2 to leaves that had been previously exposed to low CO2 (conditions under which RuBP concentrations were presumably high), and obtained rates up to 10 times higher than the steady-state rates of CO2 assimilation! Lilley and Walker (1975) at Sheffield reached a similar conclusion after comparing the CO2 responses of illuminated isolated chloroplasts with those obtained upon lysing chloroplasts in a medium containing saturating RuBP.
In our model of C3 photosynthesis (Farquhar et al. 1980), the way we handled rate limitation by RuBP regeneration was probably the most important decision made in that context. Both ATP and NADPH were required for RuBP regeneration, and this fundamental need formed a connection with light in our model. From a mathematical perspective there were two options: (1) RuBP and CO2 could always colimit the rate of carboxylation, and this we would express in a double Michaelis Menten equation, or (2) carboxylation rate could be limited by either RuBP or else be saturated and thus independent of RuBP. The in vivo kinetics of Rubisco suggest the second option.
Peisker (1974) and Farquhar (1979) pointed out that Rubisco was unusual in that it was present in the chloroplast at very high concentrations. Given such a low Km(RuBP), this meant that the in vivo kinetics with respect to chloroplastic RuBP were those of a tight binding substrate. That is, the rate of Rubisco would depend linearly on RuBP concentration when chloroplastic RuBP concentration was below Rubisco catalytic site concentration, and once RuBP exceeded Rubisco site concentration carboxylase would be RuBP saturated. We also knew that irradiance affected CO2 assimilation rate mainly at high intercellular CO2. This supported option 2 (see Figure 2a, b). Given these insights, the more complex link between chloroplastic electron transport rate and RuBP pools used by Farquhar et al. (1980) was quickly simplified to a description of CO2 assimilation that was limited by RuBP regeneration, and utilisation of ATP and NADPH for photosynthetic carbon reduction or oxygenation. RuBP regeneration was in turn driven by the electron transport rate, J (dependent on irradiance and its own maximal capacity), and stoichiometry of ATP or NADPH use by the photosynthetic carbon reduction and oxygenation cycle. For example, when electron transport rate, \(J\), was limiting (in view of ATP use) carboxylation rate could proceed at:
\[ V_c = \frac{J}{4.5 + 10.5 \Gamma_{*} / C} \tag{8} \]
Dashed lines in Figure 2 give modelled electron-transport-limited rates of CO2 fixation according to:
\[ A = \frac{J \left( C_i - \Gamma_{*} \right)}{4.5C_i + 10.5 \Gamma} \tag{9} \]
This simplified formulation of C3 photosynthesis (Equations 7 and 9) now provides a meaningful framework for analysis of leaf photosynthesis, and has focused our interpretation of CO2 response curves on leaf biochemistry. For example, von Caemmerer and Farquhar (1981) related the initial slopes of CO2 response curves to in vitro Rubisco activity, and the CO2-saturated rates of A:Ci curves to in vitro measurements of electron transport rates. Such studies validate Equations 7 and 9, demonstrating that CO2 response curves could be used as a meaningful and non-invasive tool to quantify these biochemical components under a wide variety of conditions. Subsequent comparisons between wild-type tobacco and transgenic tobacco with a reduced amount of Rubisco have confirmed our concepts. When Rubisco alone is reduced in transgenic plants, RuBP regeneration capacity remains unchanged and no longer limits the rate of CO2 assimilation at high CO2. Rubisco then constitutes the sole limitation (Figure 3).
Colimitation
Both Rubisco and electron transport components are expensive in terms of leaf nitrogen. For example, Rubisco represents up to 25% of a leaf’s protein nitrogen, with energy transduction components a further 25%. At a Ci where the transition from a Rubisco limitation to RuBP regeneration limitation occurs, both capacities are used efficiently and colimit net CO2 assimilation. That is, assimilation can only be increased if both sets of component processes are increased. Where then should the balance lie if a plant is to use nitrogen-based resources to best effect? The transition obviously varies with irradiance and temperature so that an optimal balance will vary with habitat. However, surprisingly little variation has been observed and plants appear unable to shift this point of balance. As an example, important in the context of rising atmospheric CO2 concentrations, plants grown in a high CO2 environment should manage with less Rubisco and thus put more nitrogen into the capacity of RuBP regeneration. Surprisingly, such adjustments have not been observed experimentally, but given prospects of global change, our need for understanding gains urgency.
Bierhuizen JF, Slatyer RO (1964) Photosynthesis of cotton leaves under a range of environmental conditions in relation to internal and external diffusive resistances. Aust J Biol Sci 17: 348–359
Björkman O, Holmgren P (1963) Adaptability of the photosynthetic apparatus to light intensity in ecotypes from exposed and shaded habitats. Physiol Plant 16: 889–914
Bowes G, Ogren WL, Hageman RH (1971) Phosphoglycolate production catalysed by ribulose diphosphate carboxylase. Biochem Biophys Res Com 45 716–722
Evans JR, von Caemmerer S (1996) CO2 diffusion inside leaves. Plant Physiol 110: 339–346
Farquhar GD (1979) Models describing the kinetics of ribulose bisphoshate carboxylase–oxygenase. Archiv Biochem Biophys 193: 456–468
Farquhar GD, von Caemmerer S, Berry JA (1980) A biochemical model of photosynthetic CO2 assimilation in leaves of C3 species. Planta 149: 78–90
Gaastra P (1959) Photosynthesis of crop plants as influenced by light, carbon dioxide, temperature and stomatal diffusion resistance. Mededel Landbouwhogeschool Wageningen 59: 1–68
Gauhl E, Björkman O (1969) Simultaneous measurements on the effect of oxygen concentration on water vapor and carbon dioxide exchange. Planta 88: 187–191
Hudson GS, Evans JR, von Caemmerer S, Arvidsson YBC, Andrews TJ (1992) Reduction of ribulose-1,5-bisphosphate carboxylase/oxygenase content by antisense RNA reduced photosynthesis in tobacco plants. Plant Physiol 98: 294–302
Laing WA, Ogren W, Hageman R (1974) Regulation of soybean net photosynthetic CO2 fixation by the interaction of CO2, O2 and ribulose-1,5-diphosphate carboxylase. Plant Physiol 54: 678–685
Laisk A, Oja VM (1974) Photosynthesis of leaves subjected to brief impulses of CO2. Soviet J Plant Physiol 21: 928–935
Lilley RM, Walker DA (1975) Carbon dioxide assimilation by leaves, isolated chloroplasts and ribulose bisphosphate carboxylase from spinach. Plant Physiol 55: 1087–1092
Moss DN, Rawlings SL (1963) Concentration of carbon dioxide inside leaves. Nature 197: 1320–1321
Peisker M (1974) A model describing the influence of oxygen on photosynthetic carboxylation. Photosynthetica 8: 47–50
Penman HJ, Schofield RK (1951) Some physical aspects of assimilation and transpiration. Symp Soc Exp Biol 5: 115–129
Sharkey TD, Bernacchi CJ, Farquhar GD, Singsaas EL (2007) Fitting photosynthetic carbon dioxide response curves for C3 leaves. Plant Cell Environ 30: 1035-1040
Troughton JH, Slatyer RO (1969) Plant water status, leaf temperature and the calculated mesophyll resistance to carbon dioxide of cotton. Aust J Biol Sci 22: 815–827
von Caemmerer S (2000) Biochemical models of photosynthesis. Techniques in Plant Sciences No.2. CSIRO Publishing, Australia. http://biology.anu.edu.au/CMS/FileUploads/file/vonCaemmerer/von%20Caemme...
Whiteman PC, Koller D (1967) Interactions of carbon dioxide concentration, light intensity and temperature on plant resistance to water vapour and carbon dioxide diffusion. New Phytol 66: 463–473
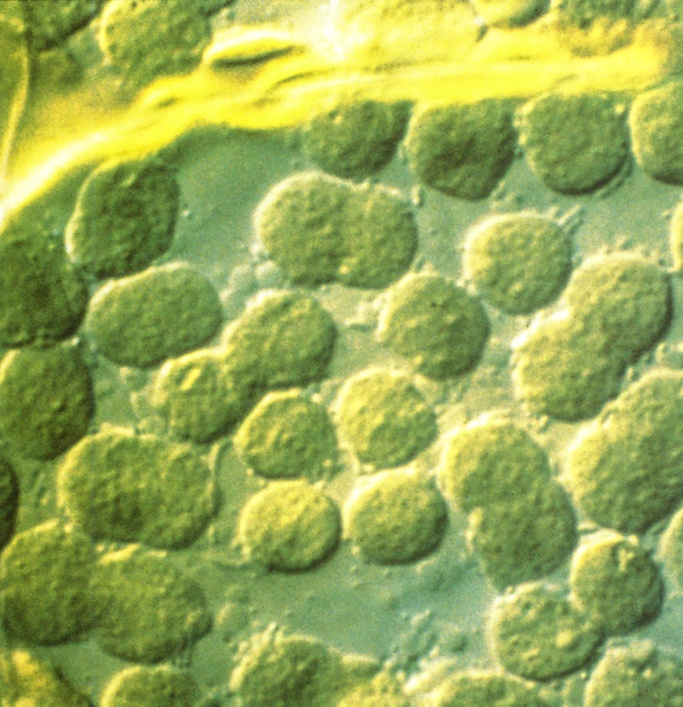
Chloroplasts dividing (dumbbell figures) within an enlarging cell of a young spinach leaf, resulting in about 200 chloroplasts per cell at leaf maturity. (Micrograph courtesy John Possingham: Nomarski optics)
In thermodynamic terms, O2-generating photosynthesis in vascular plants is an improbable process! Improbable, because a weak oxidant (CO2) must oxidise a weak reductant (H2O), thereby producing a strong oxidant (O2) and a strong reductant (carbohydrate). To achieve this ‘uphill’ reaction, a massive and continuous input of chemical energy is required. However, in nature, only radiant energy is available on that scale. How then can green plants achieve this conversion? Chloroplasts are responsible, and in the most significant process in our biosphere, photosynthetically active quanta are trapped and converted into chemically usable forms. This captured energy sustains plant growth and provides a renewable resource base for life on earth.
Thanks to the pioneering work of Calvin and Benson at Berkeley on 14CO2 fixation products by Chlorella which began in the 1950s, biochemical aspects of photosynthetic carbon reduction (Calvin cycle) are now comprehensively understood. The transduction of light energy into chemical potential energy is not so well understood, while events surrounding photosynthetic electron flow are defined in some detail and are described here, biophysical processes within the water-splitting apparatus of chloroplasts, and indeed the manner in which photons are captured and their quantum energy harnessed for photolysis, remain something of an enigma and fall outside the scope of our present account.
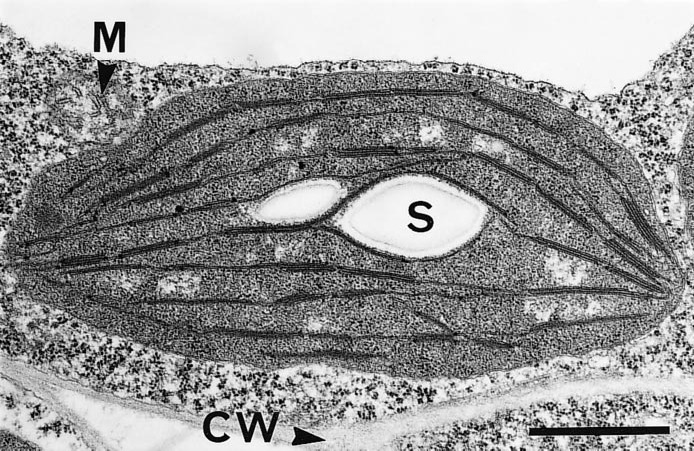
Figure 1.7 A mature and functional chloroplast in an immature leaf of bean (Phaseolus vulgaris) with an extensive network of photosynthetic membranes (thylakoids), parts of which are appressed into moderate granal stacks, and suspended in a gel-like matrix (stroma).The chloroplast containing a pair of starch grains (S) is encapsulated in a double membrane (envelope) and suspended within a granular cytoplasmic matrix adjacent to a mitochondrion (M) and in close proximity to the cell wall (CW). Scale bar = 1 µm. (Micrograph courtesy S. Craig and C. Miller)
Chloroplasts are easily recognised under a light microscope in leaf sections as distinctive green organelles suspended in the cytoplasm and usually appressed against cell walls. Chloroplasts are abundant in mesophyll tissue (commonly 200–300 in each palisade cell) and functional organelles can be isolated from homogenates of leaf tissue.
Chloroplasts are surrounded by a double membrane, or envelope, just visible in transmission electron micrographs (Figure 1.7). This envelope encapsulates a soluble (gel-like) stroma which contains all the enzymes necessary for carbon fixation, many enzymes of nitrogen and sulphur metabolism and the chloroplast’s own genetic machinery.
The inner membrane of a chloroplast envelope is an effective barrier between stroma and cytoplasm, and houses transporters for phosphate and metabolites (Section 2.1.8) as well as some of the enzymes for lipid synthesis. By comparison, the outer membrane of the chloroplast envelope is less complex and more permeable to both ions and metabolites.
Suspended within the stroma, and entirely separate from envelope membranes, is an elaborately folded system of photosynthetic membranes or ‘thylakoids’ (literally ‘little sacs’). Embedded within these membranes are the complexes that enable light harvesting and electron flow from H2O molecules to NADP+, thereby converting light energy into chemically usable forms. There are four basic complexes comprising two types of photosystem (with interlinked protein and pigment molecules), cytochrome b/f complexes (pivotal for photosynthetic electron transport) and ATP synthase complexes (responsible for proton egress from thylakoid lumen to stroma, and consequent ATP generation). These complexes are densely packed within the thylakoids. This remarkable transduction of energy, with such profound implications for life as we know it, starts with selective absorption of incoming light by chlorophylls and accessory pigments (certain carotenoids) that operate within both photosystems.
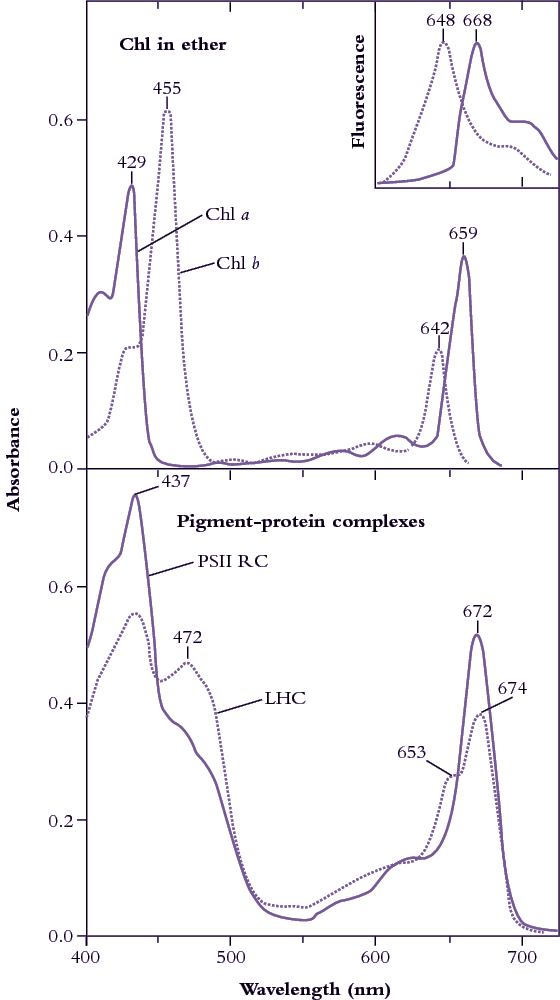
Figure 1.8 Upper curves: Diethylether solutions of chlorophyll a (Chl a, solid line) and chlorophyll b (Chl b, dotted line) show distinct absorption peaks in
blue and in red regions of the visible spectrum (redrawn from Zscheile and Comar’s (1941) original data). Fluorescence emission spectra (inset, redrawn from Lichtenthaler 1986) show peaks only in red, and at wavelengths characteristically longer than corresponding absorption peaks, namely 648 cf. 642 nm for Chl b, and 668 cf. 662 nm for Chl a. Lower curves: In situ absorption spectra (eluted from gel slices) for pigment-protein complexes corresponding to photosystem II reaction centre (PSII RC) and light-harvesting chlorophyll (a,b)-protein complexes (LHC). A secondary peak at 472 nm and a shoulder at 653 nm indicate contributions from Chl b to these broadened absorption spectra which have been normalised to 10 µM Chl solutions in a 1 cm path length cuvette. (Based on J.R. Evans and J.M. Anderson, BBA 892: 75-82, 1987)
Chlorophylls are readily extracted from (soft) leaves into organic solvent and separated chromatographically into constituent types, most notably chlorophyll a (Chl a) and chlorophyll b (Chl b). These two chemical variants of chlorophyll are universal constituents of wild vascular plants and express highly characteristic absorption spectra (Figure 1.8, upper curves). Both chlorophylls show absorption maxima at wavelengths corresponding to blue and red, but chlorophyll assay in crude extracts, which inevitably contain carotenoids as well, is routinely based on absorption maxima in red light to avoid overlap with these accessory pigments that show strong absorption below 500 nm. Absorption maxima at 659 and 642 for Chl a and Chl b respectively would thus serve for assay in diethylether, but these peaks will shift slightly according to solvent system, and such shifts must be taken into account for precise measurement (see Porra et al. 1989 for details). Additional chlorophylls have been discovered that exist in cyanobacteria which extends their absorption spectrum into the infrared (Figure 1.9).
Chl a and Chl b differ with respect to both role and relative abundance in higher plants. Chl a/b ratios commonly range from 3.3 to 4.2 in well-nourished sun-adapted species, but can be as low as 2.2 or thereabouts in shade-adapted species grown at low light. Such variation is easily reconciled with contrasting functional roles for both Chl a and Chl b. Both forms of chlorophyll are involved in light harvesting, whereas special forms of only Chl a are linked into energy-processing centres of photosystems. In weak light, optimisation of leaf function calls for greater investment of leaf resources in light harvesting rather than energy processing. As a result the relative abundance of Chl b will increase and the Chl a/b ratio will be lower compared with that in strong light. Conversely, in strong light, photons are abundant and require greater capacity for energy processing by leaves (hence the higher Chl a/b ratio). As a further subtlety, the two photosystems of higher plant chloroplasts (discussed later) also differ in their Chl a/b ratio, and this provided Boardman and Anderson (1964) with the first clue that they had achieved a historic first in the physical separation of those two entities.
Carotenoids also participate in photosynthetic energy transduction. Photosystems have an absolute requirement for catalytic amounts of these accessory pigments, but their more substantive involvement is via dissipation of potentially harmful energy that would otherwise impact on delicate reaction centres when leaves experience excess photon irradiance (further details in Chapter 12). Carotenoids are thus regarded as ‘accessory’ to primary pigments (chlorophylls) and in molar terms are present in mature leaves at about one-third the abundance of Chl (a + b).
Chlorophyll in leaves is not free in solution but is held in pigment-protein complexes, each with a different absorption spectrum (see Evans and Anderson 1987). In particular, light-harvesting Chl a, b–protein complexes (LHC in Figure 1.8, lower curves) develop a secondary absorption peak at 472 nm with a shoulder at 653 nm, while the Chl a of photosystem II reaction centres shows absorption peaks at 437 and 672 nm (compared with 429 and 659 nm for purified Chl a in ether; Figure 1.8, upper curves).
Subtle alterations in the molecular architecture of chlorophyll molecules according to the particular protein to which they bind in either light-harvesting or energy-processing centres are responsible for these shifts in absorption peaks, and for a general broadening of absorption spectra (compare lower and upper curves in Figure 1.8). Such effects are further accentuated within intact leaves by accessory pigments and greatly lengthened absorption pathways resulting in about 85% of visible wavelengths being absorbed (Figure 1.10). Any absorbed quanta at wavelengths below 680 nm can drive one electron through either reaction centre. Maximum quantum yield (Figure 1.10) occurs when both reaction centres absorb equal numbers of such quanta. When one photosystem population (PSII) absorbs more quanta than the other (PSI), excess quanta cannot be used to drive whole-chain (linear) electron flow. Quantum yield is reduced as a consequence, and leads to a slight discrepancy between in vivo absorption maxima (Figure 1.8) and quantum yield (Figure 1.10).
Although UV wavelengths are absorbed by leaves and would be capable of driving photosynthesis, such short wavelengths are damaging to biological systems and plants have adapted by developing a chemical sunscreen. Consequently, the quantum yield from these wavelengths drops off markedly below about 425 nm. Beyond 700 nm (infrared band) absorption drops to near zero, and forestalls leaf heating from this source of energy. However, quantum yield falls away even faster, and this ‘red drop’, though puzzling at first, led subsequently to a comprehensive model for photosynthetic energy transduction, outlined below.
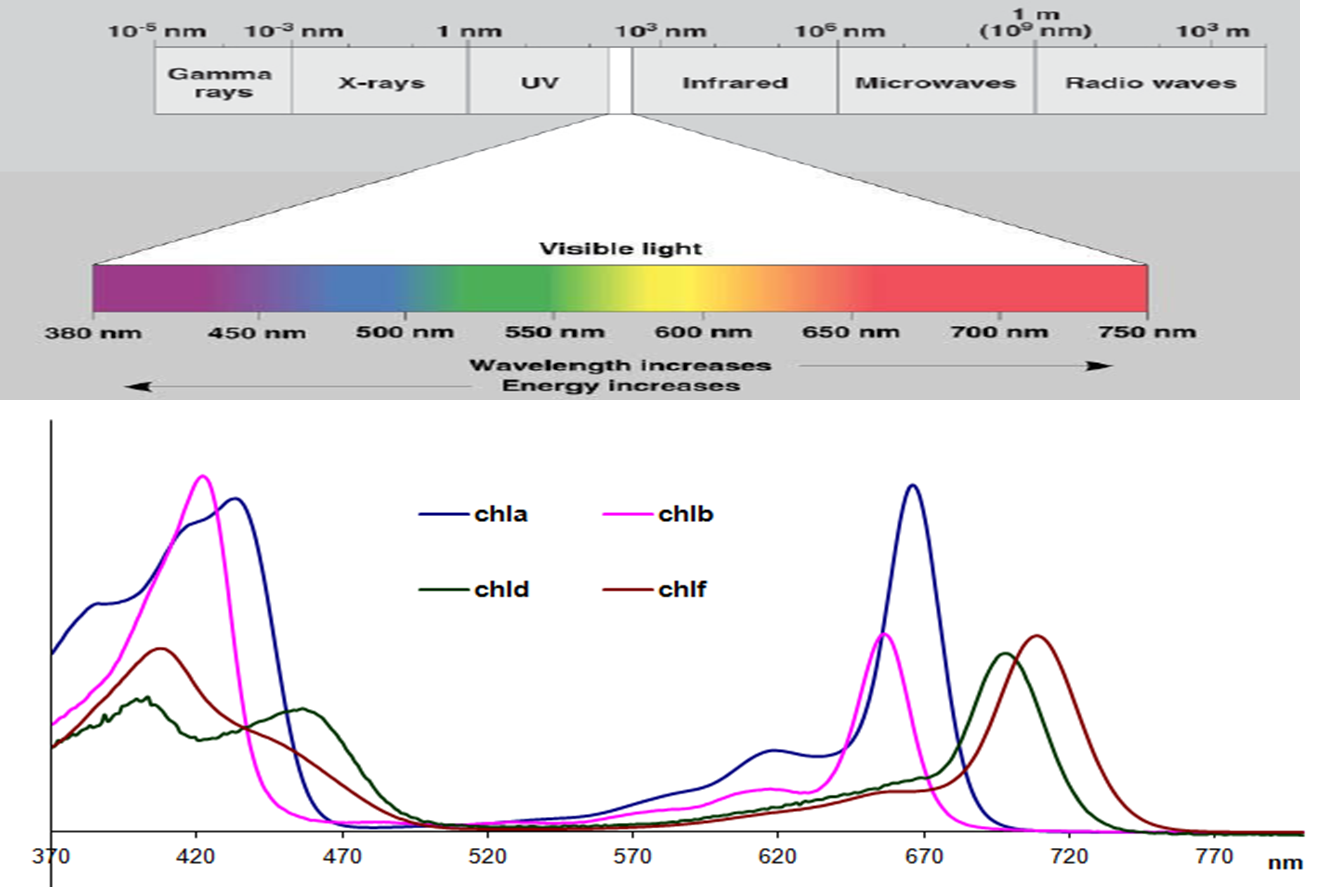
Figure 1.9 Absorption spectra for the four types of chlorophyll found in photosynthetic organisms with respect to the visible spectrum. Chlorophyll d and f are found in a cyanobacteria which allows it to utilise infrared light between 700-750 nm, beyond the range normally absorbed by photosynthetic organisms. The chlorophylls are dissolved in methanol which alters their spectra compared to in vivo. The extinction coefficients for the long wavelength peak of each chlorophyll are: Chl a 665.5 nm 71.4 L mmol-1 cm-1, Chl b 652 nm 38.6 L mmol-1 cm-1, Chl d 697 nm 63.7 L mmol-1 cm-1, Chl f 707 nm 71.1 L mmol-1 cm-1. (Based on Chen and Blankenship, Trends Plant Sci 16: 427-431, 2011; Li et al., BBA Bioenergetics, 2012; Porra et al., BBA Bioenergetics 975: 384-394, 1989).
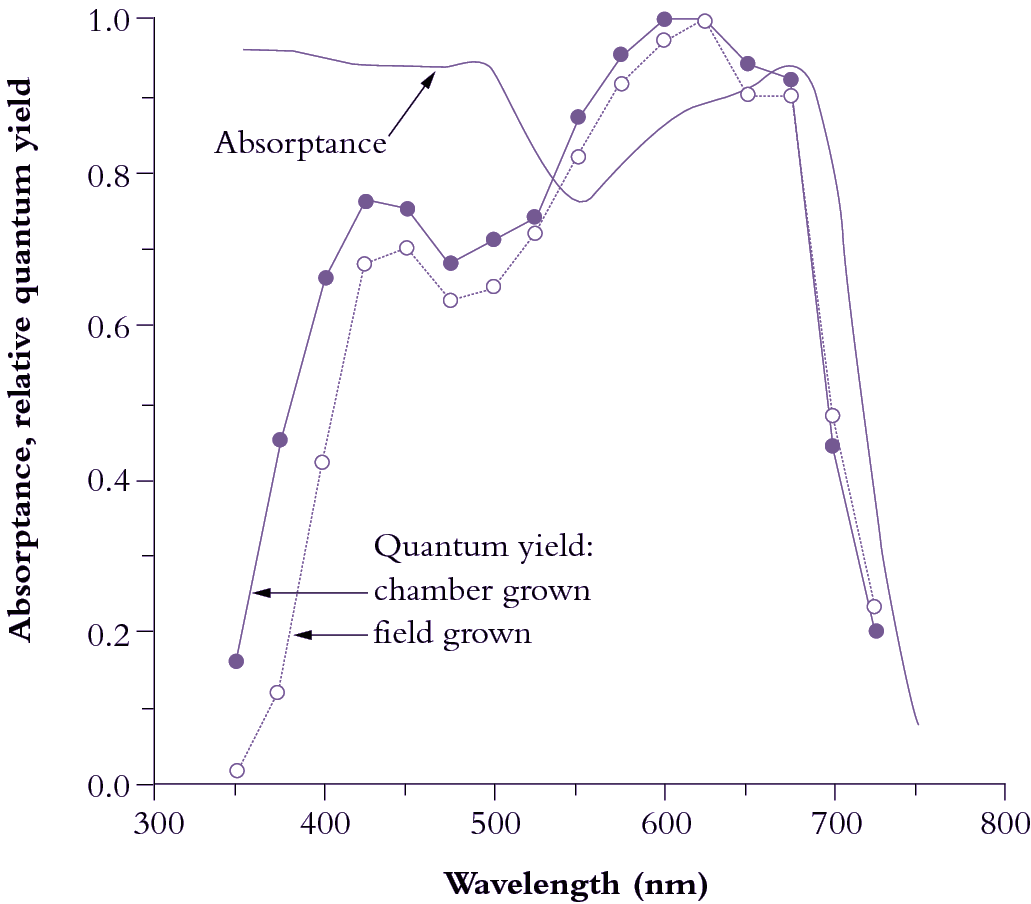
Figure 1.10 Leaves absorb visible light very effectively (85% for the waveband between 400 and 700 nm; solid curve).Wavelengths corresponding to green light are absorbed less effectively (absorptance drops to c. 0.75). Beyond 700 nm (infrared band) absorptance drops to near zero, and forestalls leaf heating from this source of energy. Quantum yield is referenced to values obtained in red light (600-625 nm), which is most effective in driving photosynthesis, requiring about 10 quanta per CO2 assimilated (based on high-precision leaf gas exchange) compared with about 12 quanta at the blue peak (450 nm). Quantum yield shows a bimodal response to wavelength. Absorptance drops beyond 700 nm but quantum yield drops off even faster because PSII (responsible for O2 generation) absorbs around 680 nm and cannot use quanta at longer wavelengths in this measuring system. UV wavelengths (below 400 nm) are capable of driving photosynthesis, but as a protective adaptation vascular plants accumulate a chemical ‘sunscreen’ in response to UV exposure. Field-grown plants are especially rich in these substances so that absorbed UV is dissipated harmlessly, lowering quantum yield compared with growth-chamber plants. (Based on K.J. McCree, Agric Meteorol 9: 191-216, 1972)
Plants and many algae contain two distinct protein complexes for trapping and processing photons of light; photosystems I and II (PSI and PSII). These two systems can be separated and identified using a combination of biochemical and chemical techniques. Within the chloroplast, however, these two systems must work cooperatively and sequentially to absorb photons and convert their quantum energy into a flow of electrons. Interestingly, although PSI was discovered first, in cyanobacteria, photosynthetic electron flow is initiated in PSII and then proceeds to PSI. In PSII electrons are provided through the splitting of water molecules. PSI is responsible for finally delivering these electrons to NADH+.
This section presents a historical account of the discovery of the two photosystems and how they work together to split water and produce NADH+.
Prior to the advent of high-precision leaf gas exchange methods (as employed for Figure 1.10), O2 evolution was taken as a measure of photosynthetic activity. Action spectra were measured on a number of plants and algae over the range of visible radiation. A crucial and consistent observation was that O2 evolution dropped off much faster in the long-wavelength red region (>690 nm) than did absorption. Put another way, more quanta were being absorbed at longer wavelengths than could be used for photosynthesis. It seemed at these longer wavelengths as though a light absorber was being robbed of energy-processing capacity.
Anticipating that bimodal absorption implied a two-step process, and knowing that chlorophyll also absorbed photons at shorter wavelengths, Robert Emerson (working at Urbana in the mid-1950s) supplemented far-red light with shorter wavelength red irradiance and demonstrated that the relatively low photosynthetic rate in far-red light could be significantly increased. In fact the photosynthetic rate achieved with the two light qualities combined could be 30–40% higher than the sum of the rates in far-red or shorter red when measured separately (Emerson et al. 1957). This phenomenon became known as the ‘Emerson Enhancement Effect’ and contributed to a working hypothesis for photosynthetic energy conversion based upon two photochemical acts (proposed by Duysens et al. 1961), but additional lines of evidence were impacting on this outcome.
At about the same time as Emerson was establishing his enhancement effect, Myers and French observed ‘sequential enhancement’; that is, a disproportionate increase in photosynthetic rate or efficiency when the two light qualities were separated in time. The upper limits of dark intervals between two flashes of different light quality were 6 s for far-red after green and 1 min for green after far-red. Clearly, the ‘product’ of photochemical act 1 was stable for 1 min, that of act 2 for only 6 s. This discovery implied that chemical intermediates, rather than an altered physical state, were involved in a two-step cooperation (see Clayton 1980).
According to physical laws of photochemical equivalence, there should be a 1:1 yield in converting light energy to chemical energy by a perfect system. Quantum requirement for such events would be 1. However in photosynthesis the absolute quantum requirement for O2 is much greater than I. In the 1950s, Robert Emerson (at Urbana) and co-workers determined that 8-10 quanta were required. Hill and Bendell (1960) suggested a 'Z' scheme that was consistent with a requirment of 8-10 quanta, the cooperation of 2 quanta in the separation of one strong reducing and one strong oxidising equivalent, and the operation of two sequential photochemical acts. Figure 1.11 is a greatly developed version of their original model.
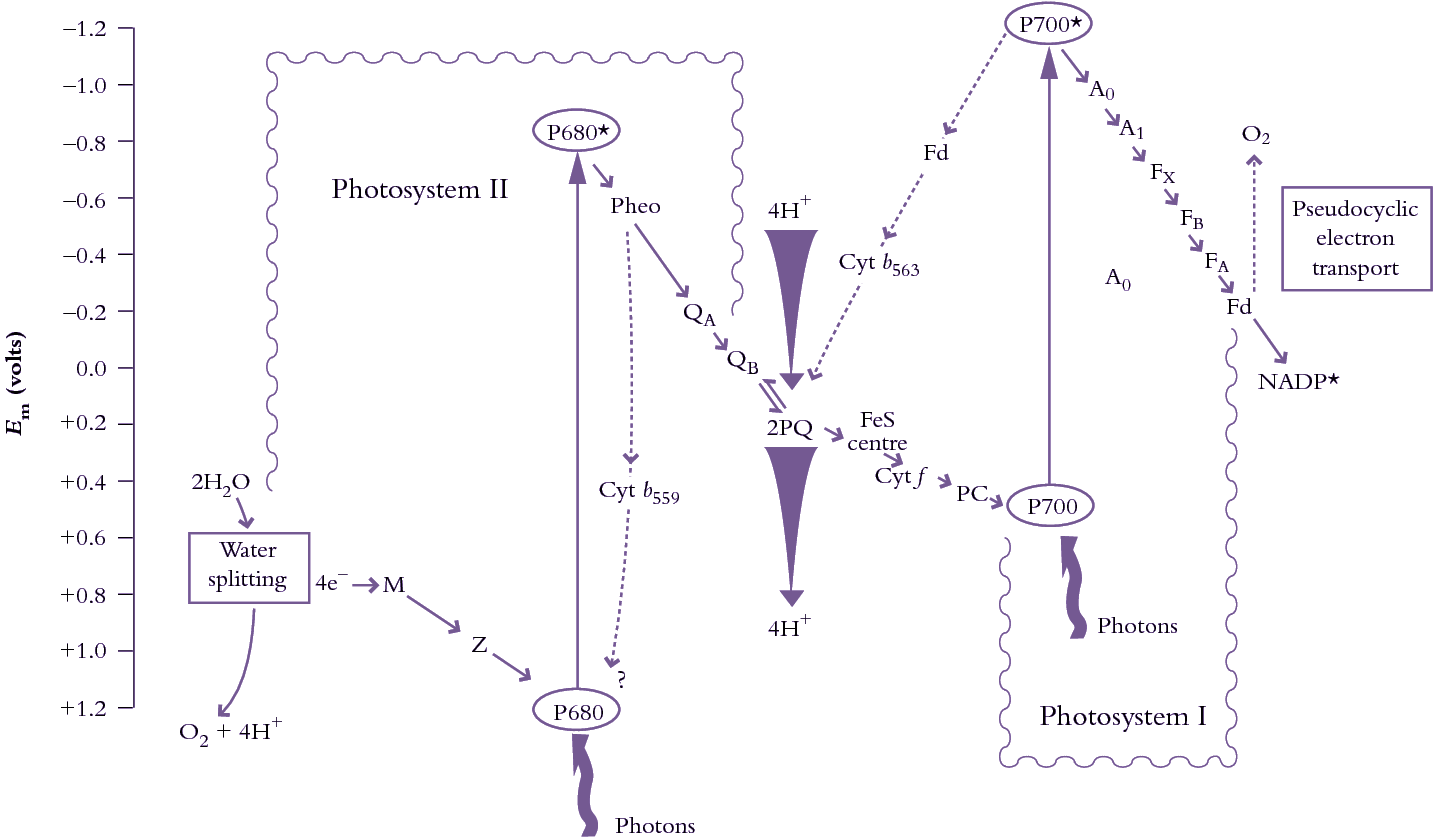
Figure 1.11. A highly diagrammatic zig-zag or ‘Z’ scheme of photosynthetic electron transport from water to NADP+ showing the sequence of electron/proton carriers and their association with either PSII or PSI. Linear electron flow is shown as solid lines; cyclic electron flow is indicated by dashed lines. All of these electron transport chains operate within thylakoid membranes with electron flow following a sequence dictated by redox potential (shown in volts on the ordinate). Cyclic electron flow in PSII diverts electrons from pheophytin to cytochrome b559 (and possibly back to P680+). Cyclic electron transport around PSI moves electrons from ferredoxin through cytochrome b565 and plastoquinone (PQ), while pseudocyclic electron transport takes electrons from ferredoxin to O2. (Original drawing courtesy C. Critchley).
In linear flow, water molecules are split in PSII, liberating O2 and providing a source of electrons. M is the manganese—containing cluster which oxidises water, Z is tyrosine-161 of the D1 protein which in turn represents the primary electron donor to P680+ (a special pair of Chl a molecules with an absorption peak at 680 nm). Pheo is the primary electron acceptor pheophytin a, a chlorophyll molecule lacking magnesium; QA is the first stable and permanently bound plastoquinone electron acceptor; QB is the second, temporarily bound, plastoquinone electron acceptor which actually leaves PSII in a reduced form (PQH2). Further along, FeS = Rieske iron—sulphur centre; Cyt f = cytochrome f; PC = plastocyanin; P700 = reaction centre chlorophyll a of PSI; A0, A1, FX, FB and FA are electron acceptors of PSI; Fd = ferredoxin; Cyt b559 = cytochrome b559; Cyt b563 = cytochrome b563. Also shown as tapered arrows is H+ accumulation in the lumen associated with water and plastoquinol oxidations.
The original version of this ‘Z’ scheme was further validated by unequivocal evidence from Australia that the two (inferred) photosystems were indeed separate physical entities. Using sophisticated biochemical chloroplast purification and subfractionation methods, coupled with detergent solubilisation of membranes, Boardman and Anderson (1964) achieved the first physical separation of photosystem II (PSII) and photosystem I (PSI), thus confirming the separate identities of those complexes.
A source of electrons had long been recognised as basic to the operation of this ‘Z’ scheme, with H2O molecules an obvious source, but were photosynthetic membranes capable of photolysis? Early experiments by Robin Hill and colleagues at Cambridge had established this capability. They used isolated thylakoid membrane preparations and showed that O2 could be evolved in the absence of CO2 as long as external electron acceptors were present (Hill reaction). Intact leaves or whole chloroplasts have no need for an artificial acceptor because electron flow is directed to NADP+ and subsequent reduction of CO2 (first demonstrated with intact chloroplasts; see Arnon 1984). The O2-evolving function of photosynthesis was found to be associated with PSII in experiments with isolated thylakoids using external (artificial) electron donors and acceptors and specific electron transport inhibitors. As one outcome of those early Cambridge experiments, O2 evolution is now measured routinely in vitro (and in vivo on leaves) with O2 electrodes (Walker 1987).
Chloroplast structure and function is by now sufficiently well defined to consider photosynthetic electron flow in detail. Figure 1.11 applies equally well to vascular plants or to algae with oxygenic photosynthesis, where in either case two photosystems work cooperatively and sequentially in absorbing photons and converting their quantum energy into a flow of electrons. Paradoxically, convention has it that photosynthetic electron flow initiates in PSII and proceeds to PSI. PSII was so named because PSI had already been described in single-celled (prokaryotic) organisms and, owing to the rules of nomenclature, was accorded priority.
Both photosystems are large multi-subunit complexes, quite different structurally and functionally, and operating in series. In PSII, electrons are provided from a water-splitting apparatus via a manganese complex which undergoes oxidation from a valency state of +2 to +4. These oxidation states are made possible by P680+ (a special form of Chl a with an absorption peak at 680 nm). P680+ is a powerful oxidant generated by absorption of energy from a photon. P680 is referred to as a ‘special pair’ because it is a pair of Chl a molecules. Electrons from P680 pass to pheophytin (Pheo in Figure 1.11) and on to a bound quinone molecule, QA. From there a second transiently bound quinone, QB, receives two electrons in succession and requires protonation. The entire, fully reduced, quinone molecule leaves PSII and enters a plastoquinone pool (2PQ).
In PSI, absorption of quantum energy from a photon causes oxidation of P700, the PSI reaction centre equivalent of P680. In contrast to PSII, where electrons are drawn from a water-splitting apparatus, P700 accepts electrons from PC (reduced form PC– in Figure 1.12). Electrons then pass through three iron–sulphur (FeS) centres and out of PSI to ferredoxin (Fd). The reaction centre of PSI contains several proteins, but most of the electron transfer cofactors are bound to large heterodimeric proteins which in turn bind the inner Chl a antenna. The LHCI complex consists of possibly eight polypeptides of between 24 and 27 kDa which carry Chl a and Chl b plus carotenoids.
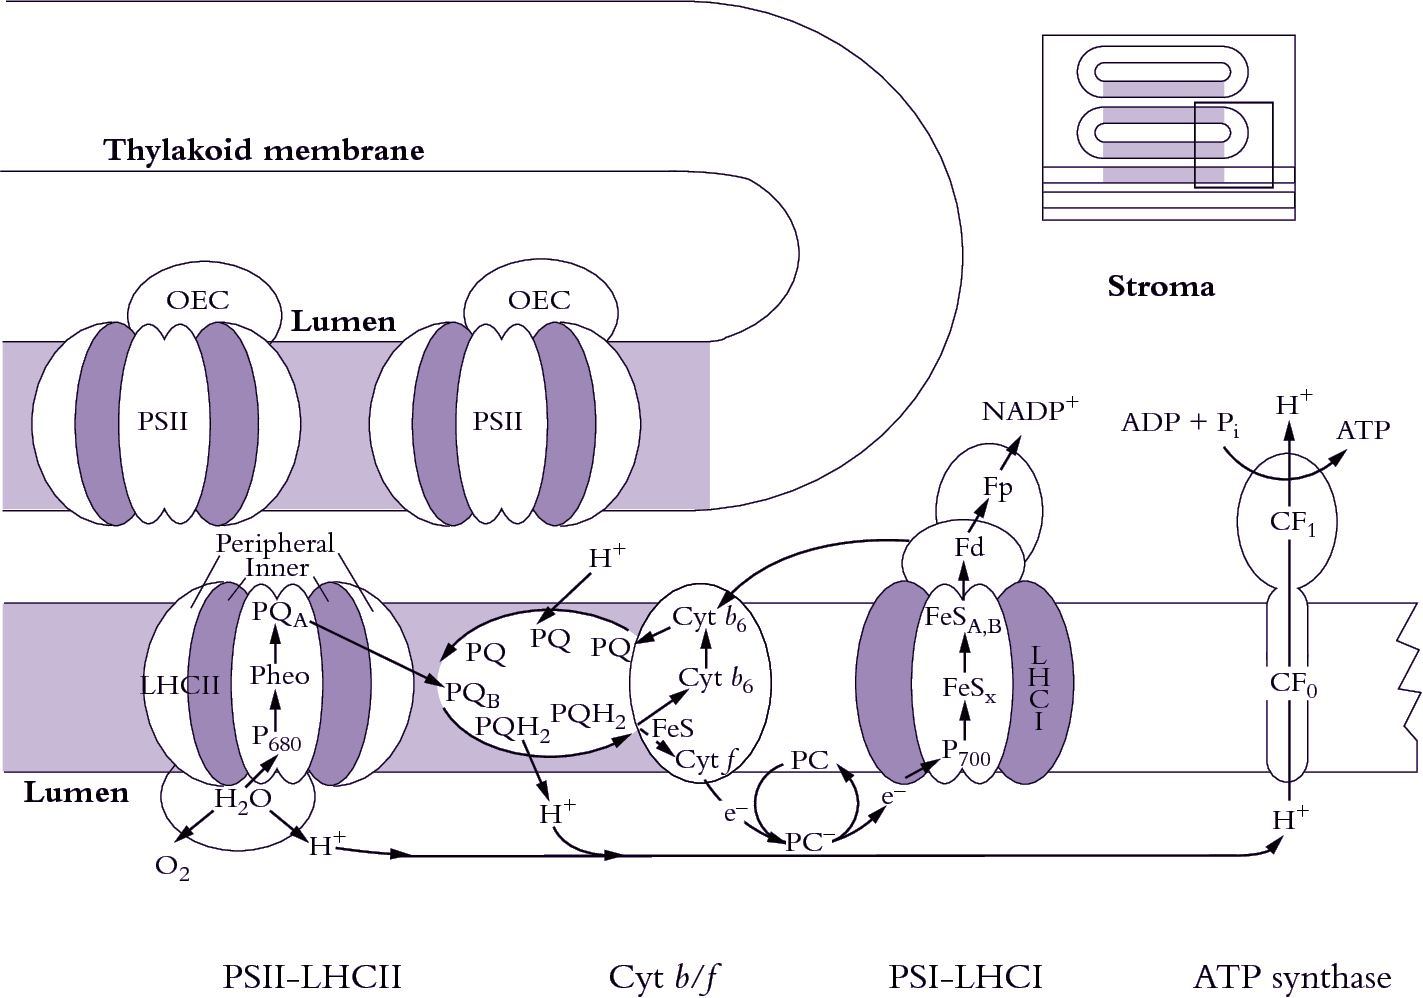
Figure 1.12. Light harvesting, photosynthetic electron transport from H2O to NADP+ and generation of ATP are achieved via four types of complexes which show a lateral heterogeneity within thylakoid membranes. A small part of a continuous network of interconnected thylakoids is shown here diagrammatically where PSI complexes and ATP synthase are restricted to non—appressed regions. Most PSII complexes and the light-harvesting assemblages associated with PSII (LHCII) are held within appressed regions of this network. Cytochrome b/f complexes (Cyt b/f) are more generally located. (Based on J.M. Anderson and B. Andersson, Trends Biochem Sci 13: 351-355, 1988)
A chemiosmotic coupling mechanism is responsible for ATP synthesis. Protons are ‘pumped’ across the thylakoid membrane from outside (stroma) to inside (lumen) by a complex arrangement of electron carriers embedded within the membrane. A prodigious concentration of protons builds up within the lumen, partly from photolysis of water molecules (water-splitting apparatus on PSII) and partly from oxidation of plastoquinone (PQ) on the inner face of the membrane. Hence, energy originally carried by incident photons is transduced into energy stored within an electrochemical gradient acrosss the thylakoid membrane. The protonmotive force from inside (lumen) to outside (stroma) is used to generate ATP within the stroma via an ATP synthase complex (CF0 and CF1) that straddles the thylakoid membrane. OEC = oxygen-evolving complex; Pheo = pheophytin a.These two photosystems are juxtaposed across thylakoid membranes in such a way that linear electron transport is harnessed for charge separation, leading to a massive accumulation of H+ ions within the lumen of illuminated thylakoids, which is then employed in ATP generation.
Combining concepts of photolysis and photosynthetic electron flow outlined earlier (Figure 1.11) and putting that conceptual framework into a thylakoid membrane system (Figure 1.12), a picture emerges where electrons generated from splitting H2O molecules on the inner surface of PSII are transferred from plastoquinol (PQH2) to the Rieske iron– sulphur centre (Rieske FeS) of the cytochrome b6/f complex (Cyt b6/f) and further to cytochrome f (Cyt f). The pivotal importance of Cyt f in facilitating electron transport from PSII to PSI was demonstrated by Duysens and colleagues (see Levine 1969), who showed that preferential energisation of PSII (light at <670 nm) caused reduction, whereas preferential energisation of PSI (light at >695 nm) caused oxidation. This elegant ‘push–pull’ experiment confirmed the cooperative and sequential nature of PSII and PSI, as well as indicating overall direction of photosynthetic electron flow.
Proteins which bind the Rieske FeS centre and Cyt f together with cytochrome b563 (Cyt b6) form a large electron transfer complex. This complex (Figure 1.12) spans the membrane and is located between the two photosystems. Electrons are transferred to PC (forming PC–), a copper-containing soluble protein extrinsic to the thylakoid membrane and located in the lumen. On the other side of the membrane, attached to the stromal side, is ferredoxin (Fd) which accepts electrons from PSI and passes them on to ferredoxin–NADP reductase, an enzyme, also extrinsic to thylakoids, and attached on the stromal side of the thylakoid membrane. This enzyme accomplishes the final electron transfer in an overall linear chain and reduced NADP is then protonated.
While linear electron transport from water to NADP+ is the main and most important path, electrons can also be transferred to O2 in a so-called pseudocyclic or Mehler reaction (Figure 1.11). This pathway probably operates in vivo as a sink for electrons when synthetic events call for more ATP than NADPH. Electrons can also be cycled around both PSII and PSI. Electrons cycling around PSI will produce ATP but with no accompanying NADPH. Cyclic electron flow around PSII may have a completely different role and may be related to the downregulation of this photosystem during photoinhibition (Chapter 12).
According to this multistage scheme, electrons are transferred from donor (reductant) to acceptor (oxidant). The direction of that transfer depends upon a difference in oxidation–reduction potential between a given donor and a given acceptor (as indicated on the ordinate in Figure 1.11). A more positive potential implies stronger oxidative power (i.e. capacity to accept electrons); a more negative potential implies stronger reducing power (i.e. capacity to donate electrons). P680* thus has a strong capacity to donate electrons (a strong reductant); P700* has an even stronger capacity to donate electrons (an even stronger reductant).
Molecules which accept electrons are immediately protonated. In aqueous systems, such as chloroplasts in vivo, hydrogen ions (H+) are ubiquitous, and these ions combine with electron acceptors to generate hydrogen atoms (i.e. H+ ion + electron → H atom). In Figure 1.11, some events involve electron transfer, while others include transfer of hydrogen atoms. As a simplifying convention, all such events are referred to as electron transfers. Ironically, the end result of all these reactions is a net transfer of hydrogen atoms!
During photosynthetic electron transfer from water to NADP+, energy captured in two photoacts is stored as an electrochemical potential gradient of protons. First, such reduction of QB requires protonation with protons drawn from the stromal side of the membrane. Reoxidation (and deprotonation) occurs towards the thylakoid lumen. In addition, protons are lost from the stromal side via protonation of reduced NADP and they are also generated in the lumen during photolysis. A massive ΔpH, of approximately 3–4 pH units, equivalent to an H+ ion concentration difference of three to four orders of magnitude, develops across the thylakoid membrane. This immense gradient drives ATP synthesis (catalysed by ATP synthase) within a large energy-transducing complex embedded in the thylakoid membrane (Figure 1.12).
ATP synthesis in chloroplasts (photophosphorylation) proceeds according to a mechanism that is basically similar to that in mitochondria. Chemiosmotic coupling (Mitchell 1961) which links the movement of protons down an electro-chemical potential gradient to ATP synthesis via an ATP synthase applies in both organelles. However, the orientation of ATP synthase is opposite. In chloroplasts protons accumulate in thylakoid lumen and pass outwards through the ATP synthase into the stroma. In mitochondria, protons accumulate within the intermembrane space and move inwards, generating ATP and oxidising NADH within the matrix of these organelles (Figure 2.24).
In chloroplasts, ATP synthase is called the CF0CF1 complex. The CF0 unit is a hydrophobic transmembrane multiprotein complex which contains a water-filled proton conducting channel. The CF1 unit is a hydrophilic peripheral membrane protein complex that protrudes into the stroma. It contains a reversible ATPase and a gate which controls proton movement between CF0 and CF1. Entire CF0CF1 complexes are restricted to non-appressed portions of thylakoid membranes due to their bulky CF1 unit.
Direct evidence for ATP synthesis due to a transthylakoid pH gradient can be adduced as follows. When chloroplasts are stored in darkness in a pH 4.0 succinic acid buffer (i.e. a proton-rich medium), thylakoid lumen equilibrate to this pH. If the chloroplasts, still in the dark, are rapidly transferred to a pH 8.0 buffer containing ADP and Pi, ATP synthesis then occurs. This outcome confirms a central role for the proton concentration difference between thylakoid lumen and stroma for ATP synthesis in vitro; but does such a process operate on that scale in vivo?
Mordhay Avron, based in Israel, answered this question in part during the early 1970s via a most elegant approach (Rottenberg et al. 1972). Working with thylakoid preparations, Avron and colleagues established that neutral amines were free to exchange between bathing medium and thylakoid lumen, but once protonated in illuminated preparations they became trapped inside. By titrating the loss of such amines from the external medium when preparations where shifted from dark to light, they were able to infer the amount retained inside. Knowing that the accumulation of amine depended upon H+ ion concentration in that lumen space, the difference in H+ ion concentration and hence ΔpH across the membrane were established.
At saturating light, chloroplasts generate a proton gradient of approximately 3.5 pH units across their thylakoid membranes. Protons for this gradient are derived from the oxidation of water molecules occurring towards the inner surface of PSII and from transport of four electrons through the Cyt b/f complex, combined with cotranslocation of eight protons from the stroma into the thylakoid space for each pair of water molecules oxidised. Electrical neutrality is maintained by the passage of Mg2+ and Cl– across the membrane, and as a consequence there is only a very small electrical gradient across the thylakoid membrane. The electrochemical potential gradient that yields energy is thus due almost entirely to the concentration of intrathylakoid H+ ions.
For every three protons translocated via ATP synthase, one ATP is synthesised. Linear electron transport therefore generates about four molecules of ATP per O2 evolved. Thus eight photons are absorbed for every four ATP molecules generated or for each O2 generated. Cyclic electron transport is slightly more efficient at producing ATP and generates about four ATP per six photons absorbed. However, linear electron transport also generates NADPH, which is equivalent, in energy terms, to six ATP per O2 released.
As implied in Figure 1.12, the four thylakoid complexes, PSII, PSI, Cyt b/f and ATP synthase, are not evenly distributed in plant thylakoid membranes but show a lateral heterogeneity. This distribution is responsible for the highly characteristic structural organisation of the continuous thylakoid membrane into two regions, one consisting of closely appressed membranes or granal stacks, the other of non-appressed stroma lamellae where outside surfaces of thylakoid membranes are in direct contact with the stroma. This structural organisation is shown on a modest scale in Figure 1.7, but extreme examples are evident in chloroplasts of shade-adapted species grown in low light (Chapter 12). Under such conditions, membrane regions with clusters of PSII complexes and Cyt b/f complexes become appressed into classical granal stacks. Cyt b/f complexes are present inside these granal stacks as well as in stroma lamellae, but PSI and ATP synthase are absent from granal stacks. Linear electron transport occurs in granal stacks from PSII in appressed domains to PSI in granal margins. Nevertheless, shade plants have only a low rate of linear electron transport because they have fewer Cyt b/f and to a lesser extent fewer PSII complexes compared to PSI, a consequence of investing more chlorophyll in each PSII to enhance light harvesting (see Anderson (1986) and Chapter 12 for more detail).
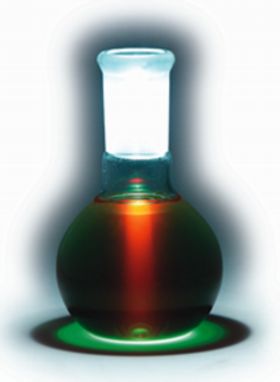
Figure 1.13 Catching the Light is a demonstration of photosynthesis in action. Photosynthesis begins when light is absorbed by chlorophyll. The flask contains chlorophyll extracted from spinach leaves. When a beam of light passes through the extract, the chlorophyll absorbs this energy. But because the chlorophyll in the flask has been isolated from the plant, energy cannot be converted and stored as sugar. Instead it is released as heat and red fluorescence. Note the green ring below the flask which is transmitted light, the colour we normally perceive for chlorophyll. The colour of a leaf is green because it reflects and transmits green light but absorbs the blue and red components of white light. (Image courtesy R. Hangarter)
A dilute solution of leaf chlorophyll in organic solvent appears green when viewed in white light. Wavelengths corresponding to bands of blue and red have been strongly absorbed (Figure 1.8), whereas mid-range wavelengths corresponding to green light are only weakly absorbed, hence the predominance of those wavelengths in transmitted and reflected light. However, when viewed at right angles to the light source, the solution will appear deep red due to energy re-emitted as fluorescence (Figure 1.13). The red colour is evident regardless of the colour of the source light.
Chlorophyll within the two photosystems can absorb energy from incident photons. This absorbed energy can be dissipated by driving the processes of photosynthesis, as heat, or re-emitted as fluorescence radiation. These are all complementary processes so that fluorescence provides an important tool in the study of photosynthesis. The normal processes of photochemistry and electron transport within intact leaves typically reduce the amount of fluorescence, a process referred to as quenching. In the demonstration shown in Figure 1.13 the chlorophyll has been isolated from the plant these processes are disrupted, minimizing the quenching effects.
Fluorescence spectra are invariate, and the same spectrum will be obtained (e.g. Figure 1.8 inset) regardless of which wavelengths are used for excitation. This characteristic emission is especially valuable in identifying source pigments responsible for given emission spectra, and for studying changes in their photochemical status during energy transduction.
Fluorescence emission spectra (Figure 1.8 inset) are always displaced towards longer wavelengths compared with corresponding absorption spectra (Stoke’s shift). As quantum physics explains, photons intercepted by the chromophore of a chlorophyll molecule cause an instantaneous rearrangement of certain electrons, lifting that pigment molecule from a ground state to an excited state which has a lifetime of c. 10–9 s. Some of this excitation energy is subsequently converted to vibrational energy which is acquired much more ‘slowly’ by much heavier nuclei. A non-equilibrium state is induced, and molecules so affected begin to vibrate rather like a spring with characteristic periodicity, leading in turn to energy dissipation as heat plus remission of less energetic photons of longer wavelength.
Apart from their role in photon capture and transfer of excitation energy, photosystems function as energy converters because they are able to seize photon energy rather than lose as much as 30% of it through fluorescence as do chlorophylls in solution. Moreover, they can use the trapped energy to lift an electron to a higher energy level from where it can commence a ‘downhill’ flow via a series of electron carriers as summarised in Figure 1.11.
Protein structure confers very strict order on bound chlorophylls. X-ray crystallographic resolution of the bacterial reaction centre has given us a picture of the beautiful asymmetry of pigment and cofactor arrangements in these reaction centres, and electron diffraction has shown us how chlorophylls are arranged with proteins that form the main light-harvesting complexes of PSII. This structural constraint confers precise distance and orientation relationships between the various chlorophylls, as well as between chlorophylls and carotenoids, and between chlorophylls and cofactors enabling the photosystems to become such effective photochemical devices. It also means that only 2–5% of all the energy that is absorbed by a photosystem is lost as fluorescence.
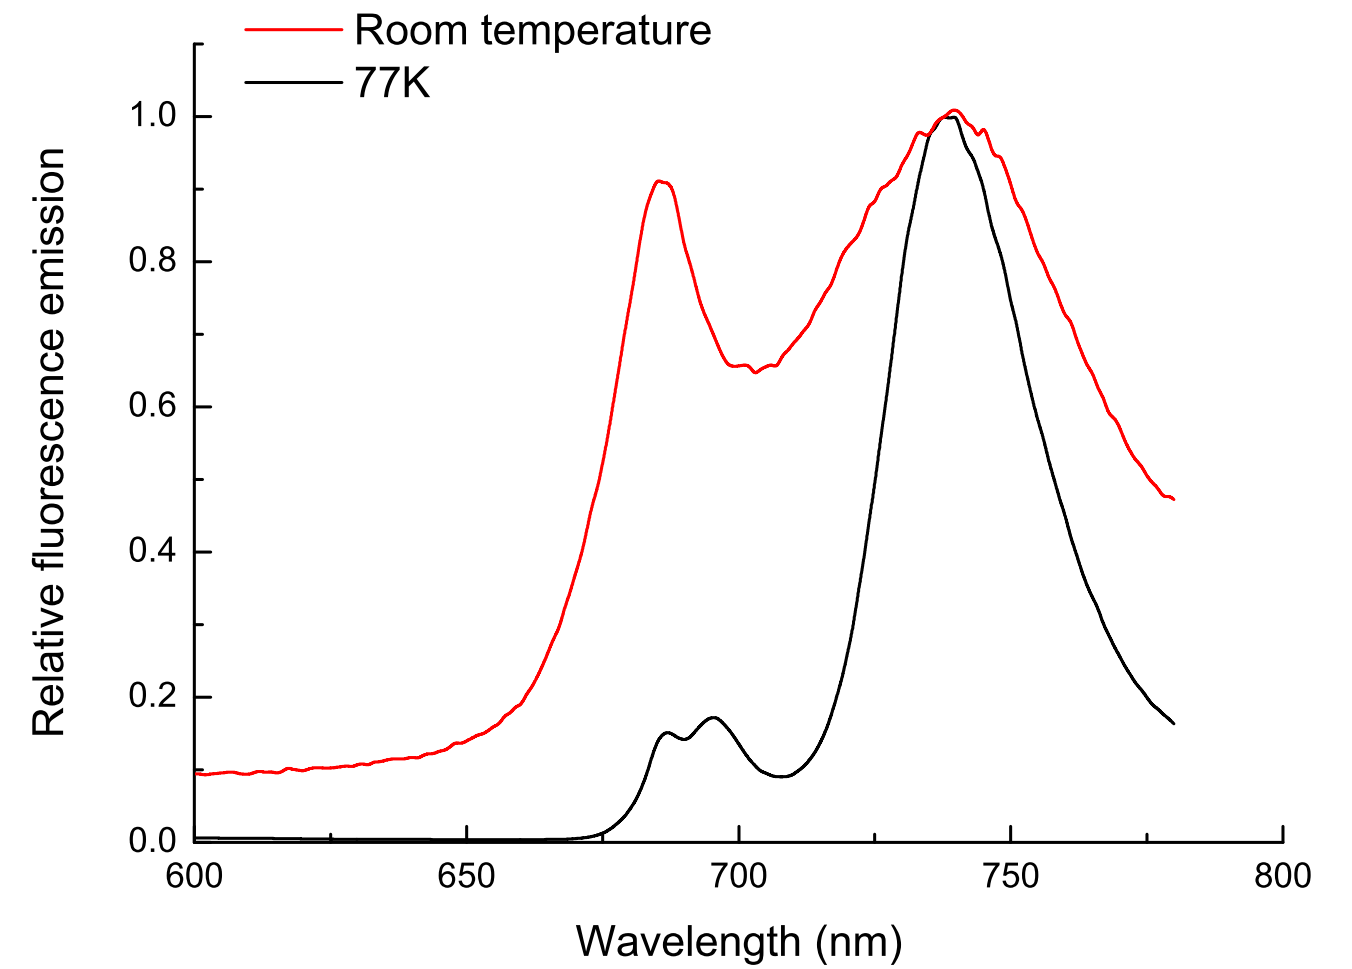
Figure 1.14 Fluorescence emission spectra from a leaf measured at room temperature or in liquid nitrogen. Spectra have been normalised to the peak at 748 nm.
If leaf tissue is held at liquid nitrogen temperature (77 K), photosynthetic electron flow ceases and chlorophyll fluorescence increases, including some emission from PSI (Figure 1.14). Induction kinetics of chlorophyll fluorescence at 77 K have been used to probe primary events in energy transduction, and especially the functional state of photosystems. Present discussion is restricted to room temperature fluorescence where even the small amount of fluorescence from PSII is diagnostic of changes in functional state. This is because chlorophyll fluorescence is not emitted simply as a burst of red light following excitation, but in an ordered fashion that varies widely in flux during continuous illumination. These transient events (Figure 1.15) are referred to collectively as fluorescence induction kinetics, fluorescence transients, or simply as a Kautsky curve in honour of its discoverer Hans Kautsky (Kautsky and Franck 1943).
At room temperature and under steady-state conditions, in vivo Chl a fluorescence from leaves show a characteristic emission spectrum with two distinct peaks around 680–690 nm and 750 nm, both of which mainly originate from photosystem II (Figure 1.14). Because other chlorophyll molecules can reabsorb fluorescence emitted at 680–690 nm within a leaf, the spatial origin of fluorescence can differ between the 680 and 750nm fluorescence that is detected. The fluorescence waveband measured by room temperature fluorometers differs between instruments.
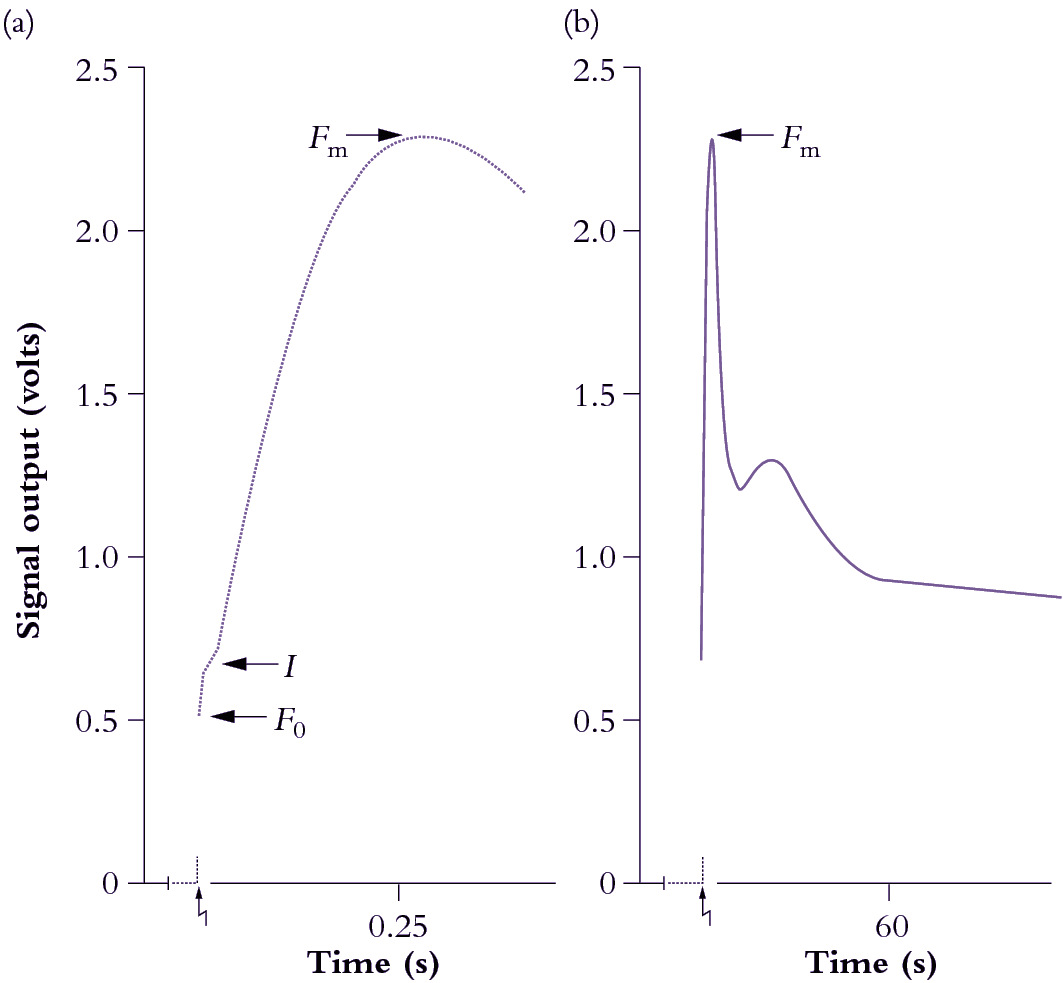
Figure 1.15 A representative chart recorder trace of induction kinetics for Chl a fluorescence at room temperature from a mature bean leaf (Phaseolus vulgaris). The leaf was held in darkness for 17 min prior to excitation (zig-zag arrow) at a photon irradiance of 85 µmol quanta m-2 s-1. The overall Kautsky curve is given in (b), and an expanded version of the first 400 ms is shown in (a). See text for explanation of symbols and interpretation of variation in strength for these ‘rich but ambiguous signals’! (Based on R. Norrish et al., Photosyn Res 4: 213-227, 1983)
Strength of emission under steady-state conditions varies according to the fate of photon energy captured by LHCII, and the degree to which energy derived from photosynthetic electron flow is gainfully employed. However, strength of emission fluctuates widely during induction (Figure 1.15) and these rather perplexing dynamics are an outcome of some initial seesawing between photon capture and subsequent electron flow. Taking Figure 1.11 for reference, complexities of a fluorescence transient (Figure 1.15) can be explained as follows. At the instant of excitation (zig-zag arrow), signal strength jumps to a point called \(F_0\) which represents energy derived largely from chlorophyll molecules in the distal antennae of the LHCII complex which fail to transfer their excitation energy to another chlorophyll molecule, but lose it immediately as fluorescence. \(F_0\) thus varies according to the effectiveness of coupling between antennae chlorophyll and reaction centre chlorophyll, and will increase due to high-temperature stress or photodamage. Manganese-deficient leaves show a dramatic increase in \(F_0\) due to loss of functional continuity between photon-harvesting and energy-processing centres of PSII (discussed further in Chapter 16).
Returning to Figure 1.15, the slower rise subsequent to \(F_0\) is called \(I\), and is followed by a further rise to \(F_m\). These stages reflect a surge of electrons which fill successive pools of various electron acceptors of PSII. Significantly, Fm is best expressed in leaves that have been held in darkness for at least 10–15 min. During this dark pretreatment, electrons are drawn from QA, leaving this pool in an oxidised state and ready to accept electrons from PSII. An alternative strategy is to irradiate leaves with far-red light to energise PSI preferentially, and so draw electrons from PSII via the Rieske FeS centre. The sharp peak (\(F_m\)) is due to a temporary restriction on electron flow downstream from PSII. This constraint results in maximum fluorescence out of PSII at about 500 ms after excitation in Figure 1.15(a). That peak will occur earlier where leaves contain more PSII relative to electron carriers, or in DCMU-treated leaves.
Photochemistry and electron transport activity always quench fluorescence to a major extent unless electron flow out of PSII is blocked. Such blockage can be achieved with the herbicide 3-(3,4-dichlorophenyl)-1,1-dimethyl urea (DCMU) which binds specifically to the D1 protein of PSII and blocks electron flow to QB. DCMU is a very effective herbicide because it inhibits photosynthesis completely. As a consequence, signal rise to \(F_m\) is virtually instantaneous, and fluorescence emission stays high.
Variation in strength of a fluorescence signal from \(F_0\) to \(F_m\) is also called variable fluorescence (\(F_v\)) because scale and kinetics of this rise are significantly influenced by all manner of environmental conditions. \(F_0\) plus \(F_v\) constitute the maximal fluorescence (\(F_m\)) a leaf can express within a given measuring system. The \(F_v/F_m\) ratio, measured after dark treatment, therefore reflects the proportion of efficiently working PSII units among the total PSII population. Hence it is a measure of the photochemical efficiency of a leaf, and correlates well with other measures of photosynthetic effectiveness (discussed further in Chapter 12).
Both the patterns of initial induction of fluorescence, and its subsequent decay once the light has ceased, are important indicators of the underlying structure and function of photosynthetic systems. The latter is referred to as the relaxation kinetics of a fluorescence event. In a typical experiment the chlorophyll is exposed to repeated pulses of light and the relaxation kinetics measured (Figure 1.16).
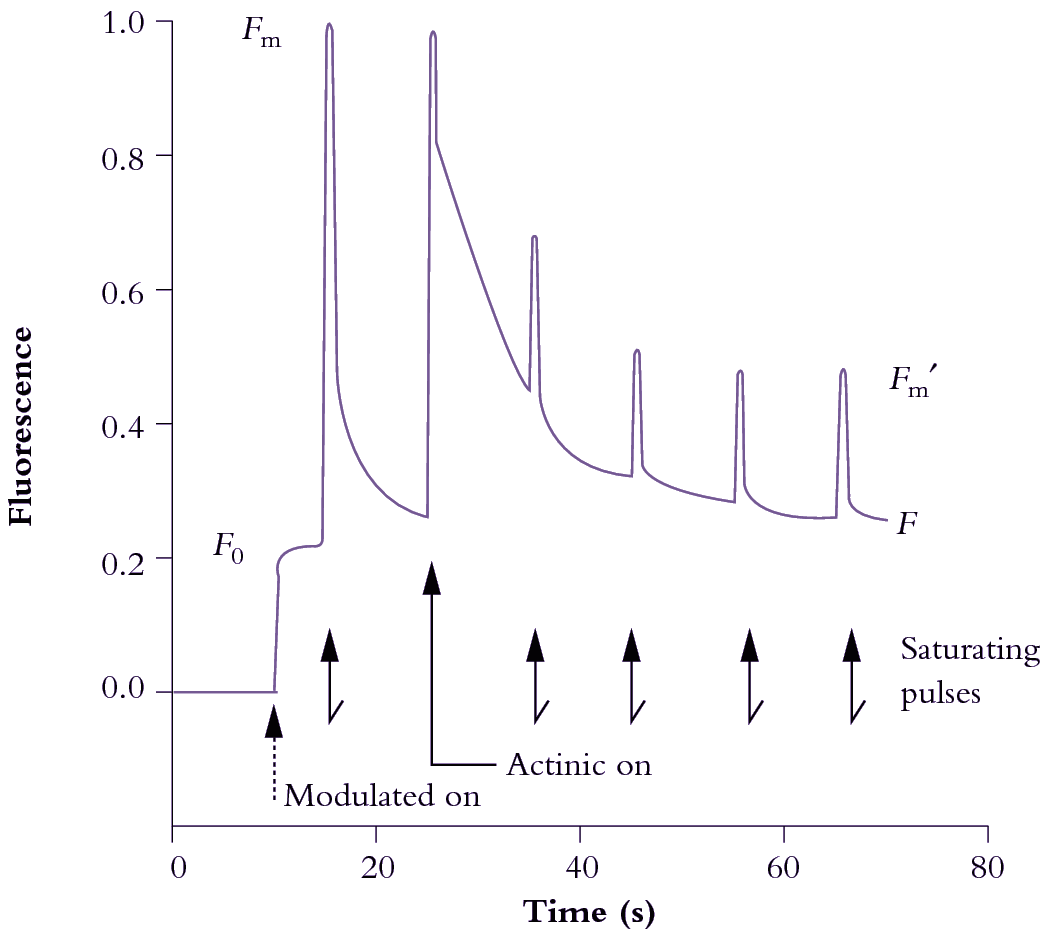
Figure 1.16 Induction and relaxation kinetics of in vivo Chl a fluorescence from a well-nourished radish leaf (Raphanus sativus) supplied with a photon irradiance of actinic light at 500 µmol quanta m-2 s-1 and subjected to a saturating pulse of 9000 µmol quanta m-2 s-1 for 0.8 s every 10 s. Output signal was normalised to 1.0 around the value for \(F_m\) following 30 min dark pretreatment. Modulated light photon irradiance was <1 µmol quanta m-2 s-1. See text for definition of symbols and interpretation of kinetics. (Original data from J. Evans generated on a PAM fluorometer - Heinz Walz GmbH, Germany)
Excellent fluorometers for use in laboratory and field such as the Plant Efficiency Analyser (Hansatech, King’s Lynn, UK) make accurate measurements of all the indices of the Kautsky curve and yield rapid information about photochemical capacity and response to environmental stress. Conventional fluorometers (e.g. Figure 1.15) use a given source of weak light (commonly a red light-emitting diode producing only 50–100 µmol quanta m–2 s–1) for both chlorophyll excitation and as a source of light for photosynthetic reactions.
Even more sophisticated is the Pulse Amplitude Modulated (PAM) fluorometer (Walz, Effeltrich, Germany) which employs a number of fluorescence- and/or photosynthesis-activating light beams and probes fluorescence status and quenching properties. These fluorimeters measure fluorescence excited by a weak source of light that is modulated: that is a beam that applies short, square pulses of saturating light for chlorophyll excitation on top of a constant beam of light that sustains photosynthesis (actinic light). A combination of optical filters plus sophisticated electronics is used to tune the detector to detect only fluorescence excited by the modulated light beam.
In this way, most of the continuous background fluorescence and reflected long-wavelength light is disregarded. Most significantly, relative fluorescence can be measured in full sunlight in the field. The functional condition of PSII in actively photosynthesising leaf tissue is thus amenable to analysis. This instrument also reveals the relative contributions to total fluorescence quenching by photochemical and non-photochemical processes and will help assess any sustained loss of quantum efficiency in PSII. Photosynthetic electron transport rates can be calculated concurrently. These techniques have revolutionised the application of chlorophyll fluorescence to the study of photosynthesis.
Photochemical quenching (\(q_p\)) varies according to the oxidation state of electron acceptors on the donor side of PSII. When QA is oxidised (e.g. subsequent to dark pretreatment), quenching is maximised. Equally, \(q_p\) can be totally eliminated by a saturating pulse of excitation light that reduces QA, so that fluorescence yield will be maximised, as in a PAM fluorometer. Concurrently, a strong beam of actinic light drives photosynthesis (maintaining linear electron flow) and sustaining a pH gradient across thylakoid membranes for ATP synthesis. Those events are a prelude to energy utilisation and contribute to non-photochemical quenching (\(q_n\)). This \(q_n\) component can be inferred from a combination of induction plus relaxation kinetics.
In Figure 1.16, a previously darkened radish leaf (QA oxidised and ready to receive an electron from P680; 'traps open') initially receives weak modulated light (<1 µmol quanta m–2 s–1) that is insufficient to close traps but sufficient to establish a base line for constant yield fluorescence (\(F_0\)). This value will be used in subsequent calculations of fluorescence indices. The leaf is then pulsed with a brief (0.8 s) saturating flash (9000 µmol quanta m–2 s–1) to measure \(F_m\). Pulses follow at 10 s intervals to measure \(F_m^\prime\). Actinic light (500 µmol quanta m–2 s–1) starts with the second pulse and pH starts to build up in response to photosynthetic electron flow. Photosynthetic energy transduction comes to equilibrium with these conditions after a minute or so, and fluorescence indices \(q_n\) and \(q_p\) can then be calculated as follows:
\[ q_n=\frac{F_m - F_m^\prime}{F_m - F_0} \text{, and } q_p=\frac{F_m^\prime-F}{F_m^\prime - F_0} \tag{1.1} \]
Under these steady-state conditions, saturating pulses of excitation energy are being used to probe the functional state of PSII, and by eliminating \(q_p\) the quantum efficiency of light-energy conversion by PSII (\(\Phi_{PSII}\)) can be inferred:
\[ \Phi_{PSII} = \frac{F_m^\prime - F}{F_m^\prime} \tag{1.2} \]
If overall quantum efficiency for O2 evolution is taken as 10 (discussed earlier), then the rate of O2 evolution by this radish leaf will be:
\[ \Phi_{PSII} \times \text{photon irradiance}/10 \;(\mu\text{mol O}_2 m^{-2}s^{-1}) \tag{1.3} \]
In summary, chlorophyll fluorescence at ambient temperature comes mainly from PSII. This photosystem helps to control overall quantum efficiency of electron flow and its functionality changes according to environmental and internal controls. In response to establishment of a ΔpH across thylakoid membranes, and particularly when irradiance exceeds saturation levels, some PSII units become down-regulated, that is, they change from very efficient photochemical energy converters into very effective energy wasters or dissipators (Chapter 12). Large amounts of the carotenoid pigment zeaxanthin in LHCII ensure harmless dissipation of this energy as heat (other mechanisms may also contribute). PSII also responds to feedback from carbon metabolism and other energy-consuming reactions in chloroplasts, and while variation in pool size of phosphorylated intermediates has been implicated, these mechanisms are not yet understood.
Min Chen
School of Biological Sciences, University of Sydney, Australia

Figure 1. Absorption spectra of photosynthetic organisms containing different chlorophylls and the quantum yield of photosynthesis using chlorophylls a and b (grey line). Green line, in vivo absorption spectrum of Synechocystis PCC 6803 in BG11 medium; Black line, isolated Prochloron cell suspension in seawater; Red line, in vivo absorption spectrum of Acaryochloris marine MBIC11017 in seawater medium; and Blue line, in vivo absorption spectrum of Halomicronema hongdechloris in seawater medium.
Solar radiation is a black body at a temperature of ~5800oK, covering all spectral regions. However, all known eukaryotic photosynthetic organisms (including plants and algae) are only able to use the same region of the solar spectrum that our eyes are sensitive to, covering the wavelength of 400 – 700 nm region, which is approximately 43% of the total solar radiation. This region is called photosynthetic active radiation (PAR) with estimated photon flux of 1.05 x 10²¹ photons m-2 s-1. Longer wavelengths up to 1000 nm can drive anoxygenic photosynthesis but not oxygenic (oxygen evolving) photosynthesis. The reason for the high threshold energy for oxygenic photosynthesis is the higher energy requirement for catalysing water oxidation and oxygen evolution in photosynthesis. The PAR input limit depends on the absorption of the photopigments. Chlorophylls a and b, the main chlorophylls in eukaryotic photosynthetic organisms, show their maximal absorption bands in the blue region of 430 - 455 nm and the red region of 645 -670 nm, thus leaving a “green window” and photons outside of “visible region” (Figure 1). The photons collected by chlorophylls a and b provide a strong enough redox potential for the oxidisation of water, while at the same time they also provide an negative enough excited state redox potentials for the reduction of the primary electron acceptor.
There are five different chlorophylls that have been identified, chlorophylls a, b, c, d and f. Here, we focus on chlorophylls containing five rings (macrocycle) and an esterified 17-propionic acid side chain, the chlorin type chlorophylls, including chlorophylls a, b, d and f. The chemical difference among the different chlorophylls is either formyl substitution at the side chain of the macrocycle (chlorophyll b, d, and f) or the degree of unsaturation of the macrocycle (8-vinyl chlorophyll a and 8-vinly chlorophyll b). Those chemical structural differences are also the spectral determinants and responsible for the different absorption spectral features (Figure 2).

Figure 2. Chemical structure of chlorophylls and their absorption spectra in 100% methanol. (A) Chemical structure of chlorophyll a and the structural differences of other chlorophylls from chlorophyll a. The carbon atoms are numbered using IUPAC system. (B) Absorption spectra of red-shifted chlorophylls, chlorophylls d and f, compared with chlorophyll a. (C) Absorption spectra of chlorophyll b and 8-vinyl chlorophyll a compared with chlorophyll a. (modified from reference 3)
Chlorophyll b is distinguished from chlorophyll a by a formyl instead of a methyl group on ring B at C7 position, which results in a blue-shift of the longest red absorbance band (Qy) from 665 nm to 652 nm. Chlorophyll d and chlorophyll f are distinguished from chlorophyll a by replacement of a peripheral substituent on ring A by a formyl group at C3 position and C2 position, respectively (Figure 2). The consequences of those formyl group substitutions at ring A result into a red-shifted Qy absorption wavelength, from 665 nm to 696 nm (chlorophyll d) and even further to 706 nm for chlorophyll f. Both chlorophylls d and f are named as red-shifted chlorophylls. Those red-shifted chlorophylls allow the organisms to use the light beyond 700 nm efficiently compared with the organisms containing chlorophylls a and b only.
Plants using chlorophyll a and b demonstrate the decreased quantum yield of photosynthesis using wavelength >700 nm, which is known as the “red drop” (Figure 1). The reason for the red-drop at ~700 nm is that the chlorophylls that absorb longer wavelength light beyond 700 nm will not do photosynthesis as efficiently as the chlorophylls that absorb shorter wavelength light. The 700 nm photons were considered as the red-edge of oxygenic photosynthesis. However, the newly discovered chlorophyll d-containing Acaryochloris marina and chlorophyll f-containing Halomicronema hongdechloris have forced a re-evaluation of what is the minimum threshold energy for oxygenic photosynthesis. Both red-shifted chlorophyll-containing cyanobacteria are found in the environment where visible lights are depleted by above layers of oxygenic photosynthetic organisms. The red-shifted chlorophylls allow them to absorb the longer wavelength light beyond 700 nm and do oxygenic photosynthesis as efficiently as above layers of chlorophyll a-containing organisms. Accordingly, the minimum threshold energy for oxygenic photosynthesis has been at extended to at least 750 nm in those red-shifted chlorophyll-containing organisms. The PAR increment in the region of the solar spectrum of 700 – 750 nm increases the number of available light energy by 19%. The potential additional photon flux in the infrared region (700-750 nm) could improve the light-harvesting efficiency by extending the PAR coverage to 400-750 nm if those red-shifted chlorophylls could be introduced into plants and algae.
In addition for the potential enhancement for efficient light collection and transfer to the reaction centres under weak irradiation, the second functional demands for the light-harvesting process is their protecting function at exposure to strong light, which will be covered in a following case study.
Chen M, Blankenship RB (2011) Expanding the solar spectrum used by photosynthesis. Trends Plant Sci 16: 427-431
Chen M, Schliep M, Willows R, Cai Z-L, Neilan BA, Scheer H (2010) A red-shifted chlorophyll. Science 329: 1318-1319
Chen M, Scheer H (2013) Extending the limit of natural photosynthesis and implications of technical light harvesting, J Porphyrins Phthalocyanines 17: 1-15
Chloroplasts are sites of solar energy absorption and subsequent transduction into chemically usable forms. Splitting water molecules and developing a proton motive force of sufficient magnitude to drive ATP synthesis are energy-intensive processes. Consequently, photosynthetic organisms evolved with dual photosystems that work cooperatively and sequentially to extract sufficient quantum energy from parcels of absorbed photons to generate a sufficiently strong electrochemical potential gradient to synthesise the relatively stable, high-energy compounds ATP and NADPH. Such metabolic energy sustains cycles of photosynthetic carbon reduction (PCR) where CO2 is initially assimilated by one of three photosynthetic pathways, namely C3, C4 or CAM, but eventually fixed via a PCR cycle within the stromal compartment of chloroplasts. These photosynthetic pathways are described in the following chapter. Section 2.1 describes C3 photosynthesis, Section 2.2 presents C4 photosynthesis and other photosynthetic modes, and Section 2.3 covers photorespiration.
Thermodynamically, the net outcome of photosynthetic energy transduction must be viewed as long-term storage of energy in the form of a product pair, namely free oxygen and reduced carbon (organic matter), rather than as separate molecules. Plants themselves or indeed any heterotrophic organisms subsequently retrieve such energy via metabolic ‘combustion’ of the organic matter where enzyme-catalysed reactions bring this pair of products together again in the process known as mitochondrial respiration. This is described in Section 2.4.
Evans JR, von Caemmerer S (1996) Carbon dioxide diffusion inside leaves. Plant Physiol 110: 339-346
Evans JR, Kaldenhoff R, Genty B, Terashima I (2009) Resistances along the CO2 diffusion pathway inside leaves. J Exp Bot 60: 2235-2248
Kramer DM, Evans JR (2011) The importance of energy balance in improving photosynthetic productivity. Plant Physiol 155: 70-78
Sharkey TD (1985) Photosynthesis in intact leaves of C3 plants: physics, physiology and rate limitations. Bot Rev 51: 53-105
Syvertsen JP, Lloyd J, McConchie C, Kriedemann PE, Farquhar GD (1995) On the relationship between leaf anatomy and CO2 diffusion through the mesophyll of hypostomatous leaves. Plant Cell Environ 18: 149-157
Terashima I (1989). Productive structure of a leaf'. In Photosynthesis, ed. WR Briggs, 207-226. Alan R Liss: New York.
Terashima I, Fujita T, Inoue T, Chow WS, Oguchi R (2009) Green light drives leaf photosynthesis more efficiently than red light in strong white light: Revisiting the enigmatic question of why leaves are green. Plant Cell Physiol 50: 684-697
von Caemmerer S (2000) Biochemical models of photosynthesis. Techniques in Plant Sciences, No.2 CSIRO Publishing, Australia http://biology.anu.edu.au/CMS/FileUploads/file/vonCaemmerer/von%20Caemme...
Roger Hangarter and Dennis DeHart http://plantsinmotion.bio.indiana.edu/usbg/photosyn.htm