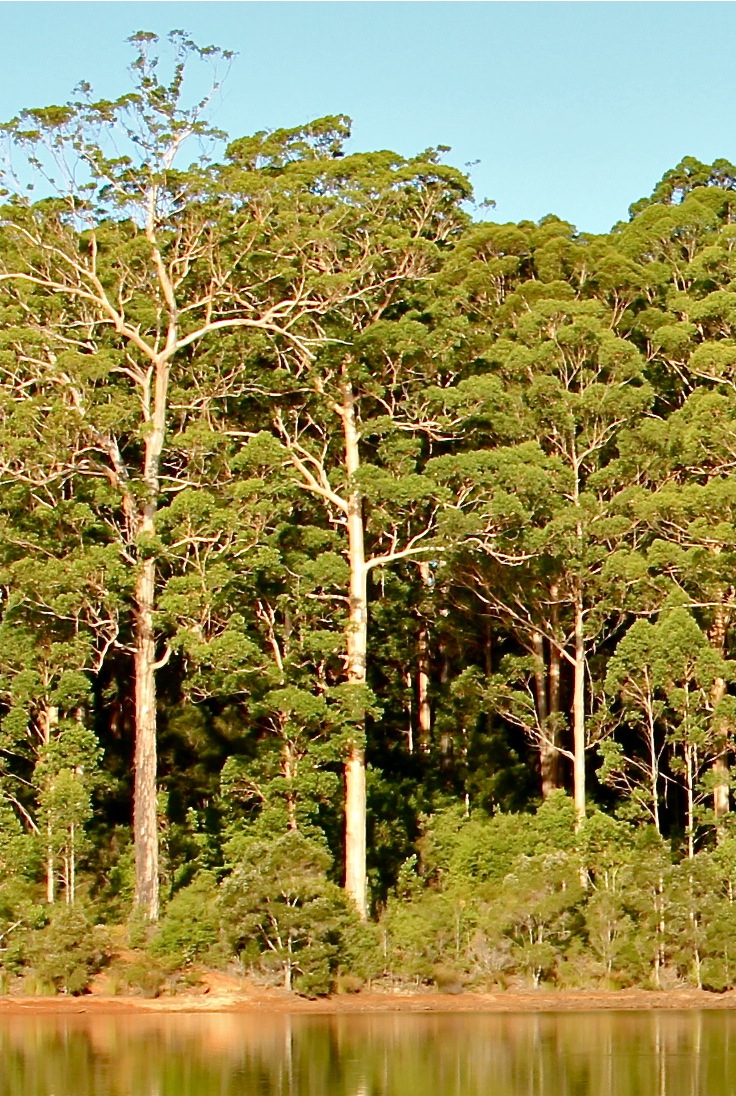
Karri (Eucalyptus diversicolor) forest in Pemberton, Western Australia. Karri may reach the height of 80 m, and is the second highest hardwood tree in the world (Photograph courtesy A. Munns)
Karri (Eucalyptus diversicolor) forest in Pemberton, Western Australia. Karri may reach the height of 80 m, and is the second highest hardwood tree in the world (Photograph courtesy A. Munns)
Chapter editors: Brendan Choat and Rana Munns
Contributing Authors: B Choat1, R Munns2,3,4, M McCully2, JB Passioura2, SD Tyerman4,5, H Bramley6 and M Canny*
1Hawkesbury Institute of the Environment, University of Western Sydney; 2CSIRO Agriculture, Canberra; 3School of Plant Biology, University of Western Australia; 4ARC Centre of Excellence in Plant Energy Biology; 5School of Agriculture, Food and Wine, University of Adelaide; 6Facutly of Agriculture and Environment, University of Sydney; *Martin Canny passed away in 2013
Evolutionary changes were necessary for plants to inhabit land. Aquatic plants obtain all their resources from the surrounding water, whereas terrestrial plants are nourished from the soil and the atmosphere. Roots growing into soil absorb water and nutrients, while leaves, supported by a stem superstructure in the aerial environment, intercept sunlight and CO2 for photosynthesis. This division of labour results in assimilatory organs of land plants being nutritionally inter-dependent; roots depend on a supply of photoassimilates from leaves, while shoots (leaves, stems, flowers and fruits) depend on roots to supply water and mineral nutrients. Long-distance transport is therefore a special property of land plants. In extreme cases, sap must move up to 100 m vertically and overcome gravity to rise to tree tops.
This chapter explains the mechanism by which water can rise to the top of a tall tree, and the cellular processes essential for plant cells to maintain turgor.

Figure 3.1 Surface view of cleared whole mount of a wheat leaf showing large and small parallel veins (mauve) with transverse veins connecting them. Lines of stomates (shown by the orange colour of the guard cells) lie along the flanks of these veins. Water evaporates from the wet walls of mesophyll cells below the stomates, drawing water from the veins. Distance between veins is 0.15 mm; scale bar is 100 µm. (Photograph courtesy M. McCully)
Water is often the most limiting resource determining the growth and survival of plants. This can be seen in both the yield of crop species and the productivity of natural ecosystems with respect to water availability.
The natural distribution of plants over the earth’s land surface is determined chiefly by water: by rainfall (\( R \)) and by evaporative demand (potential evapotranspiration, \( PE \)) which depends on temperature and humidity. This leads to such diverse vegetation groups as the lush vegetation of tropical rainforests, the shrubby vegetation of Mediterranean climates, or stands of tall trees in temperate forests. Climates can be classified according to the Thornthwaite Index: \( (R-PE)/PE \).
Agriculture also depends on rainfall. Crop yield is water-limited in most regions in the world, and agriculture must be supplemented with irrigation if the rainfall is too low. Horticultural crops are usually irrigated.
Plants require large amounts of water just to satisfy the requirements of transpiration: a large tree may transpire hundreds of litres of water in a day. Water evaporates from leaves through stomates, which are pores whose aperture is controlled by two guard cells. Plants must keep their stomates open in order to take up CO2 as the substrate for photosynthesis (Chapter 2). In the process, water is lost from the moist internal surfaces of the leaf through the stomatal pores (Figure 3.1). Water loss also has a benefit in maintaining the leaf temperature through evaporative cooling.
The ratio of water lost to CO2 taken up is around 300:1 in most land plants, meaning that plants must transpire large quantities of water on a daily basis in order to take up sufficient CO2 for normal development.
In this section we will examine plant water relations and the variables that plant physiologists use to describe the status and movement of water in plants, soil and the atmosphere.
One of the challenging aspects of understanding plant water relations is the range of pressures from positive to negative that occur within different tissues and cells. Positive pressures (turgor) occur in all living cells and depend on the semipermeable nature of the plasma membrane and the elastic nature of the cell walls. Negative pressures (tensions) occur in dead cells and depend on the cohesive strength of water coupled with the strength of heavily lignified cell walls to resist deformation. These play an important role in water transport through the xylem.

Figure 3.3 Wilted squash plants demonstrating loss of cell turgor. (Photograph courtesy of Home and Garden Information Center, University of Maryland Extension).
Well-watered plants are turgid, and their leaves and stems are upright and firm, even without woody tissue to support them. If water is lost from leaves through the stomates at a faster rate than it is resupplied by roots, then plants wilt (Figure 3.3)
Well-watered plants are turgid because their cells are distended by large internal hydrostatic pressures (Figure 3.4a). This internal hydrostatic pressure (also called turgor pressure) is typically 0.5 MPa or more. Lack of water causes cells to shrink until the pressure inside equals that of the atmosphere (zero), and the cells thus have zero turgor (Figure 3.4b). The initial shrinkage while turgor drops from 0.5 to zero MPa is determined by the properties of the cell wall: cell walls are slightly elastic, and the relation between volume change and turgor pressure depends on the “elastic modulus” of the wall. This involves little change in whole cell volume for a drop in turgor pressure to zero. However, further water loss causes the wall to shrink and deform inwards, and the whole cell volume decreases markedly.
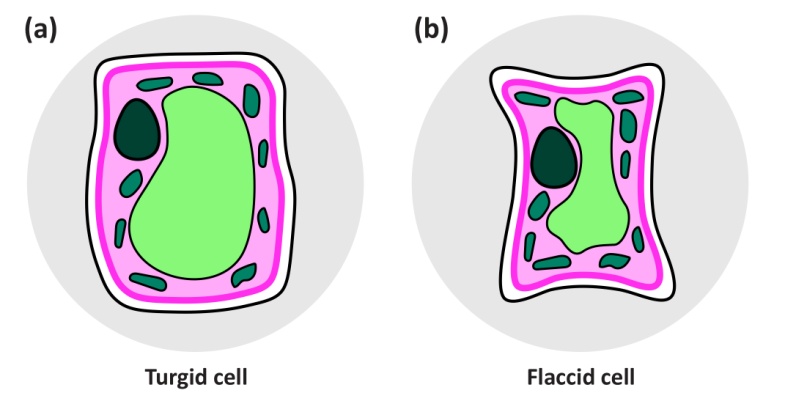
Figure 3.4 Turgid leaf cell and flaccid cell (zero turgor). (a) In the turgid cell in a well-watered plant, the cell is distended by a large internal hydrostatic pressure, usually 0.5 MPa - 1 MPa. (b) In the flaccid cell of a wilted plant, the cell wall is rather dry, and water has been lost to the atmosphere until the pressure inside is that of the atmosphere, zero.
The turgor pressure of a fully turgid cell may even exceed 1 MPa, about five times the pressure in a car tyre, and ten times the pressure in the atmosphere. In a physically unconstrained cell, the turgor pressure is borne by the cell wall, which develops a large tension within it. But in cells that are physically constrained, such as those of a tree root whose growth becomes hampered by the presence of a slab of concrete, the tension in the cell walls is relieved and the pressure is applied directly to the constraint (Figure 3.5).
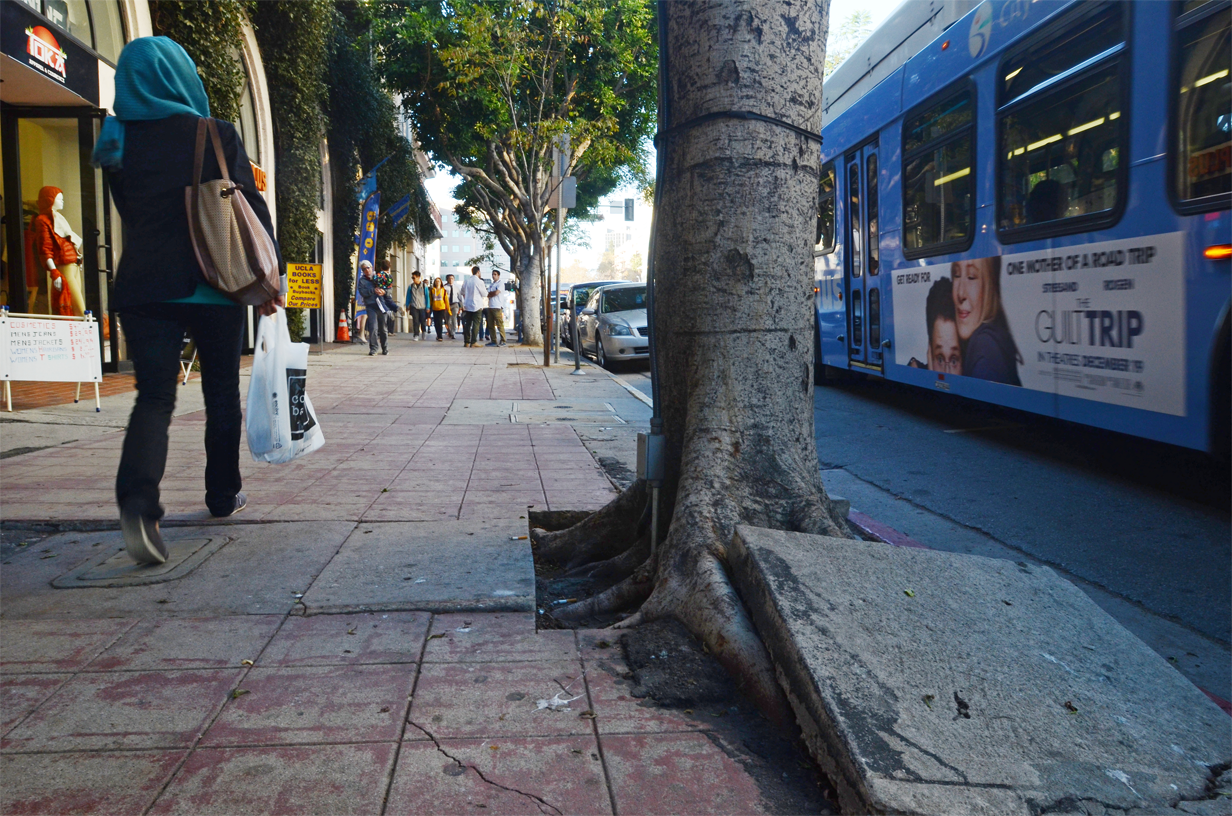
Figure 3.5 Roots lifting slab of concrete. (Photograph courtesy L. Atmore, Daily Bruin, UC Davis)
It is easy to see how a constrained tree root could eventually lift a slab of concrete: 1 MPa applied over 100 cm2 is equivalent to a weight of one tonne. Pressure is force/area, and 1 MPa is approximately equal to 10 kg weight per cm2.
A definition of all these terms is summarised at the end of this section (Section 3.1.7).
How is it that plant cells can have such large turgor pressures? The essential reason is that the cells contain large concentrations of solutes. These solutes attract water into the cells through a process known as osmosis, which involves water flowing in through semipermeable membranes that prevent the passage of solutes but not of water. The inflow of water swells the cells until a hydrostatic pressure is reached at which no more water will flow in. In cells bathed in fresh water, such as algal cells in a pond, this equilibrium hydrostatic pressure is known as the osmotic pressure (\( \pi \)) of the cell contents, and is commonly about 500 kPa or 0.5 MPa.
This osmotic pressure can be measured directly with an osmometer, or it can be calculated from the solute concentration in the cell (\( C \)) from the van‘t Hoff relation:
\[ \pi = RTC \tag{1} \]
where \( R \) is the gas constant, \( T \) is the absolute temperature (in degrees Kelvin) and \( C \) is the solute concentration in Osmoles L-1. At 25 ºC, \( RT \) equals 2.5 litre-MPa per mole, and \( \pi \) is in units of MPa. Hence a concentration of 200 mOsmoles L-1 has an osmotic pressure of 0.5 MPa.
However, land plants are different from algae in a pond. Their leaves are in air, and the water in their cell walls, unlike the water in a pond, is not free. It has a negative hydrostatic pressure (discussed further in the next section). Thus, for a given osmotic pressure (\( \pi \)) within a cell, the hydrostatic pressure, \( P \), will be lower than if the cell were bathed in free water. This difference is known as the water potential (\( \psi \)) of the cell. It is zero in an algal cell in fresh water, but it is always negative in land plants. Its value is the difference between \( P \) and \( \pi \), that is:
\[ \psi=P-\pi \tag{2} \]
An alternative notation for equation (2) used commonly by plant physiologists is:
\[ \psi_w = \psi_p + \psi_s \tag{3} \]
In this case, \( \psi_w \) is the total water potential, \( \psi_s \) is the solute potential and \( \psi_p \) is the pressure potential. Thus \( \psi_s \) is equal, but opposite in sign, to \( \pi \).
The notion of water potential can be applied to any sample of water, whether inside a cell, in the cell wall, in xylem vessels, or in the soil. Water will flow from a sample with a high water potential to one with a low water potential provided the samples are at the same temperature and provided that no solutes move with the water. Water potential thus defined is always zero or negative, for by convention it is zero in pure water at atmospheric pressure.
Positive values of hydrostatic pressure occur in the living cells of plants, in the symplast, and as explained above are induced by high solute concentrations and the resultant osmotic pressure. However, large negative values are common in the apoplast of plants and the soil they are growing in. These negative values arise because of capillary effects - the attraction between water and hydrophilic surfaces at an air/water interface, the effects of which can be seen in the way that water wicks into a dry dishcloth. This attraction reduces the pressure in the water, and does so more intensely the narrower are the water-filled pores. It accounts for how cell walls, which have very narrow pores, can remain hydrated despite very low water potentials in the tissue they are part of. For a geometrically simple cylindrical pore, the relation between the induced pressure and the radius of the pore can be derived as follows:
Take a glass capillary tube with a radius \( r \) (m) and place it vertically with one end immersed in water. Water will rise in the tube against the gravitational force until an equilibrium is reached at which the weight of the water in the tube is balanced by the force of attraction between the water and the glass. A full, hemispherical, meniscus will have now developed, i.e. one with a radius of curvature equal to that of the tube (Figure 3.6).
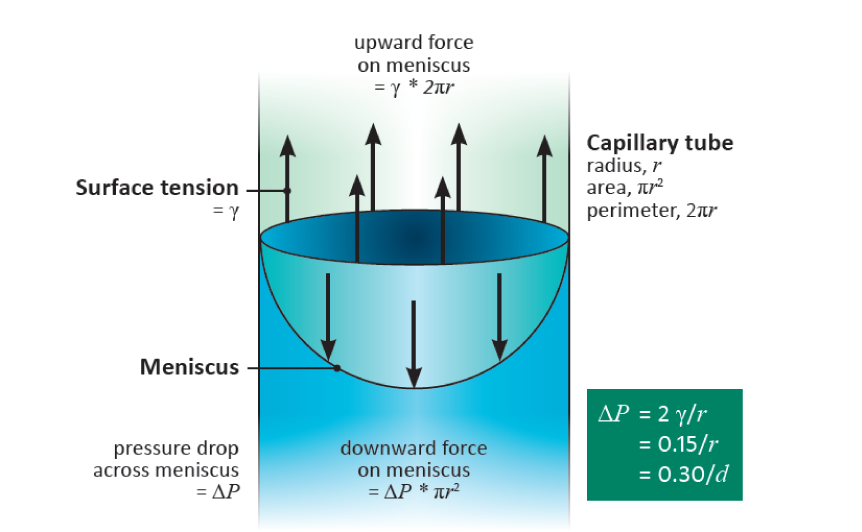
Figure 3.6 A fully-developed meniscus in a cylindrical tube showing the equality between the upward pull of surface tension and the downward pull of the suction in the water from which the relation \( \Delta P = 2\gamma/r \) can be derived.
The meniscus is curved because it is supporting the weight of the water - much as a trampoline sags when several people are sitting on it. There is a difference in pressure, \( \Delta P \) (Pa), across the meniscus, with the pressure in the water being less than that of the air. The downward acting force (N) on the meniscus is the difference in pressure multiplied by the cross-sectional area of the tube, i.e \(\pi r^2 \Delta P\). The upward acting force is equal to the perimeter of contact between water and glass (\( 2 \pi r \)) multiplied by the surface tension, \( \gamma \) (N m-1), of water, namely \( 2 \pi r \gamma \) (provided the glass is perfectly hydrophilic, when the contact angle between the glass and the water is zero, otherwise this expression has to be multiplied by the cosine of the angle of contact). Thus, because these forces are equal at equilibrium, we have \(\pi r^2 \Delta P = 2 \pi r \gamma \), whence
\[ \Delta P = 2\gamma/r \tag{4}\]
The surface tension of water is 0.075 N m-1 at about 20°C, so \( \Delta P \) (Pa) equals 0.15 divided by the radius \( r \) (m):
\[ \Delta P = 0.15/r \tag{5}\]
Thus a fully-developed meniscus in a cylindrical pore of radius 0.15 mm would have a pressure drop across it of 1.0 MPa. The pressure, \( P \), in the water would therefore be -1.0 MPa if referenced to normal atmospheric pressure, or -0.9 MPa absolute pressure (given that standard atmospheric is approximately 100 kPa).
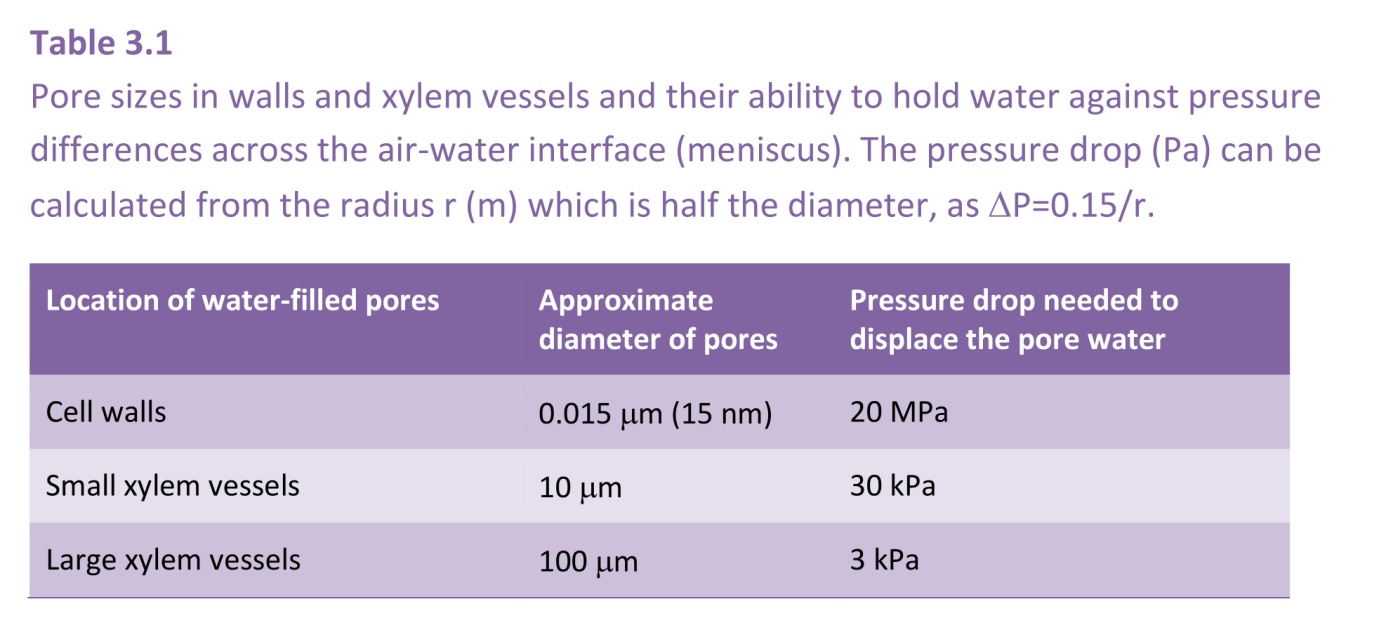
This argument applies not only to cylindrical pores. It is the curvature of the meniscus that determines the pressure drop, and this curvature is uniform over a meniscus occupying a pore of any arbitrary shape. It is such capillary action that generates the low pressures (large suctions) in the cell walls of leaves that induce the long-distance transport of water from the soil through a plant to the sites of evaporation. The pores in cell walls are especially small (diameters of the order of 15 nm), and are therefore able to develop very large suctions, as they do in severely water-stressed plants. Such pores can hold water against a suction of 10 MPa. (Table 3.1)
In plants, other water-filled pores vary in size from large xylem vessels with diameters of 100 mm or more down to a few mm, so for them to remain water-filled requires that they have no air/water interfaces.
When a cell in an intact plant growing in soil loses water, turgor declines and solute concentrations increase. As explained before (3.1.1), at turgor loss point, when turgor becomes zero, the hydrostatic pressure in the cell sap is equal to the atmospheric pressure, meaning that no net force is exerted on the cell wall, and the plant is wilting. If water continues to be lost from the cell, the pressure within the cytoplasm drops below atmospheric pressure, resulting in a force imbalance that collapses the cell wall. The deformation of living cells upon desiccation is called cytorrhysis. Note that the plasma membrane remains in close contact with the cell wall throughout desiccation ie plasmolysis does not occur, because the hydrostatic pressure in the cytoplasm remains greater than the hydrostatic pressure in the apoplast.
Plasmolysis only occurs in cells that are completely immersed in solution and have no air spaces around them, as in epidermal strips floating on water. Plasmolysis starts when the osmotic pressure of the solution is increased above that of the cells, causing the protoplast to shrink, and the plasma membrane separates from the wall (Fig. 3.7). Large gaps created between the plasma membrane and the wall fill with the bathing solution. This cannot occur in normal tissues as the cells have air spaces between them that are not filled with water. This includes root cells of intact plants growing in hydroponic solution or in waterlogged soil, as they still have air spaces.
Air cannot enter the cell through the cell walls as the small pore size, about 15 nm, would need a suction of 20 MPa to drain the pores (Table 3.1, in previous section) which is impossible.
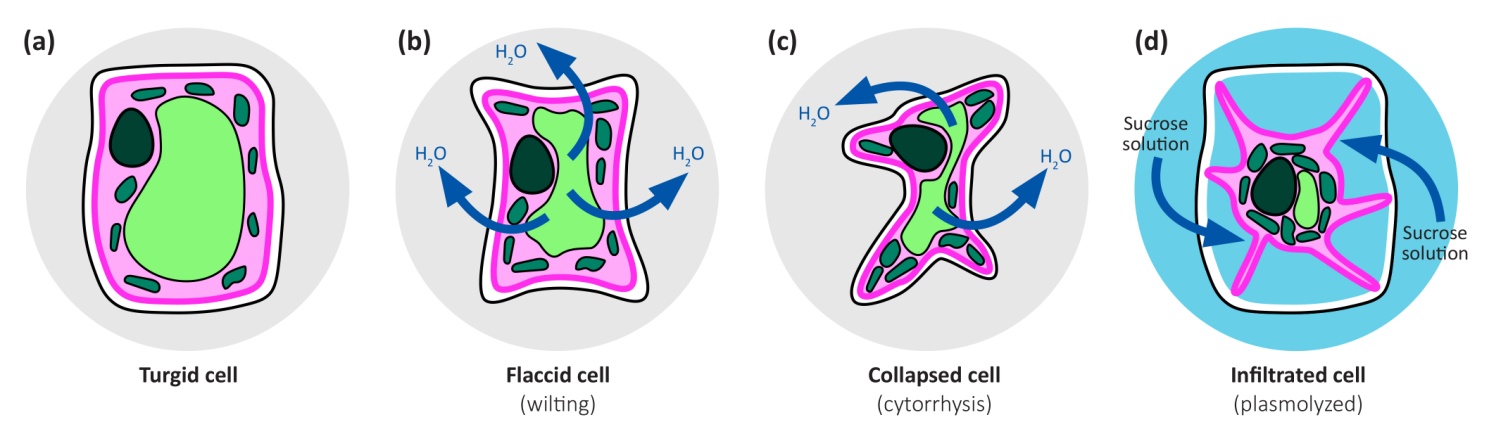
Figure 3.7. Turgid leaf cell (turgor about 0.5 MPa) and flaccid cell (zero turgor) that has lost some water. With further water loss, the cell collapses. The collapse of the wall is called cytorrhysis. Plasmolysis occurs when a cell is placed in a solution of osmotic strength greater than that of the cell. Water is withdrawn from the cell until its concentration of solutes equals that of the bathing solution. If the bathing solution is sucrose or NaCl or any small molecule (smaller than the pores in the cell wall), solution enters the cell through pores in the cell wall which prevents cytorrhysis.
During plasmolysis, the plasma membrane is stretched into strands that remain tethered to the wall at particular sites (Figure 3.8). Plasmolysis has been used by microscopists to demonstrate the tethering of the plasma membrane to specific sites on cell walls, by floating tissue such as epidermal peels of onion bulbs on high concentration of solution of sucrose (Figure 3.8). When the protoplast shrinks away from the cell wall, and solution with small molecular weight solutes pentrates the cell wall and floods into the space between the wall and the proplasts, some parts of the plasma membrane stay tethered and the rest become pulled into very fine strands.
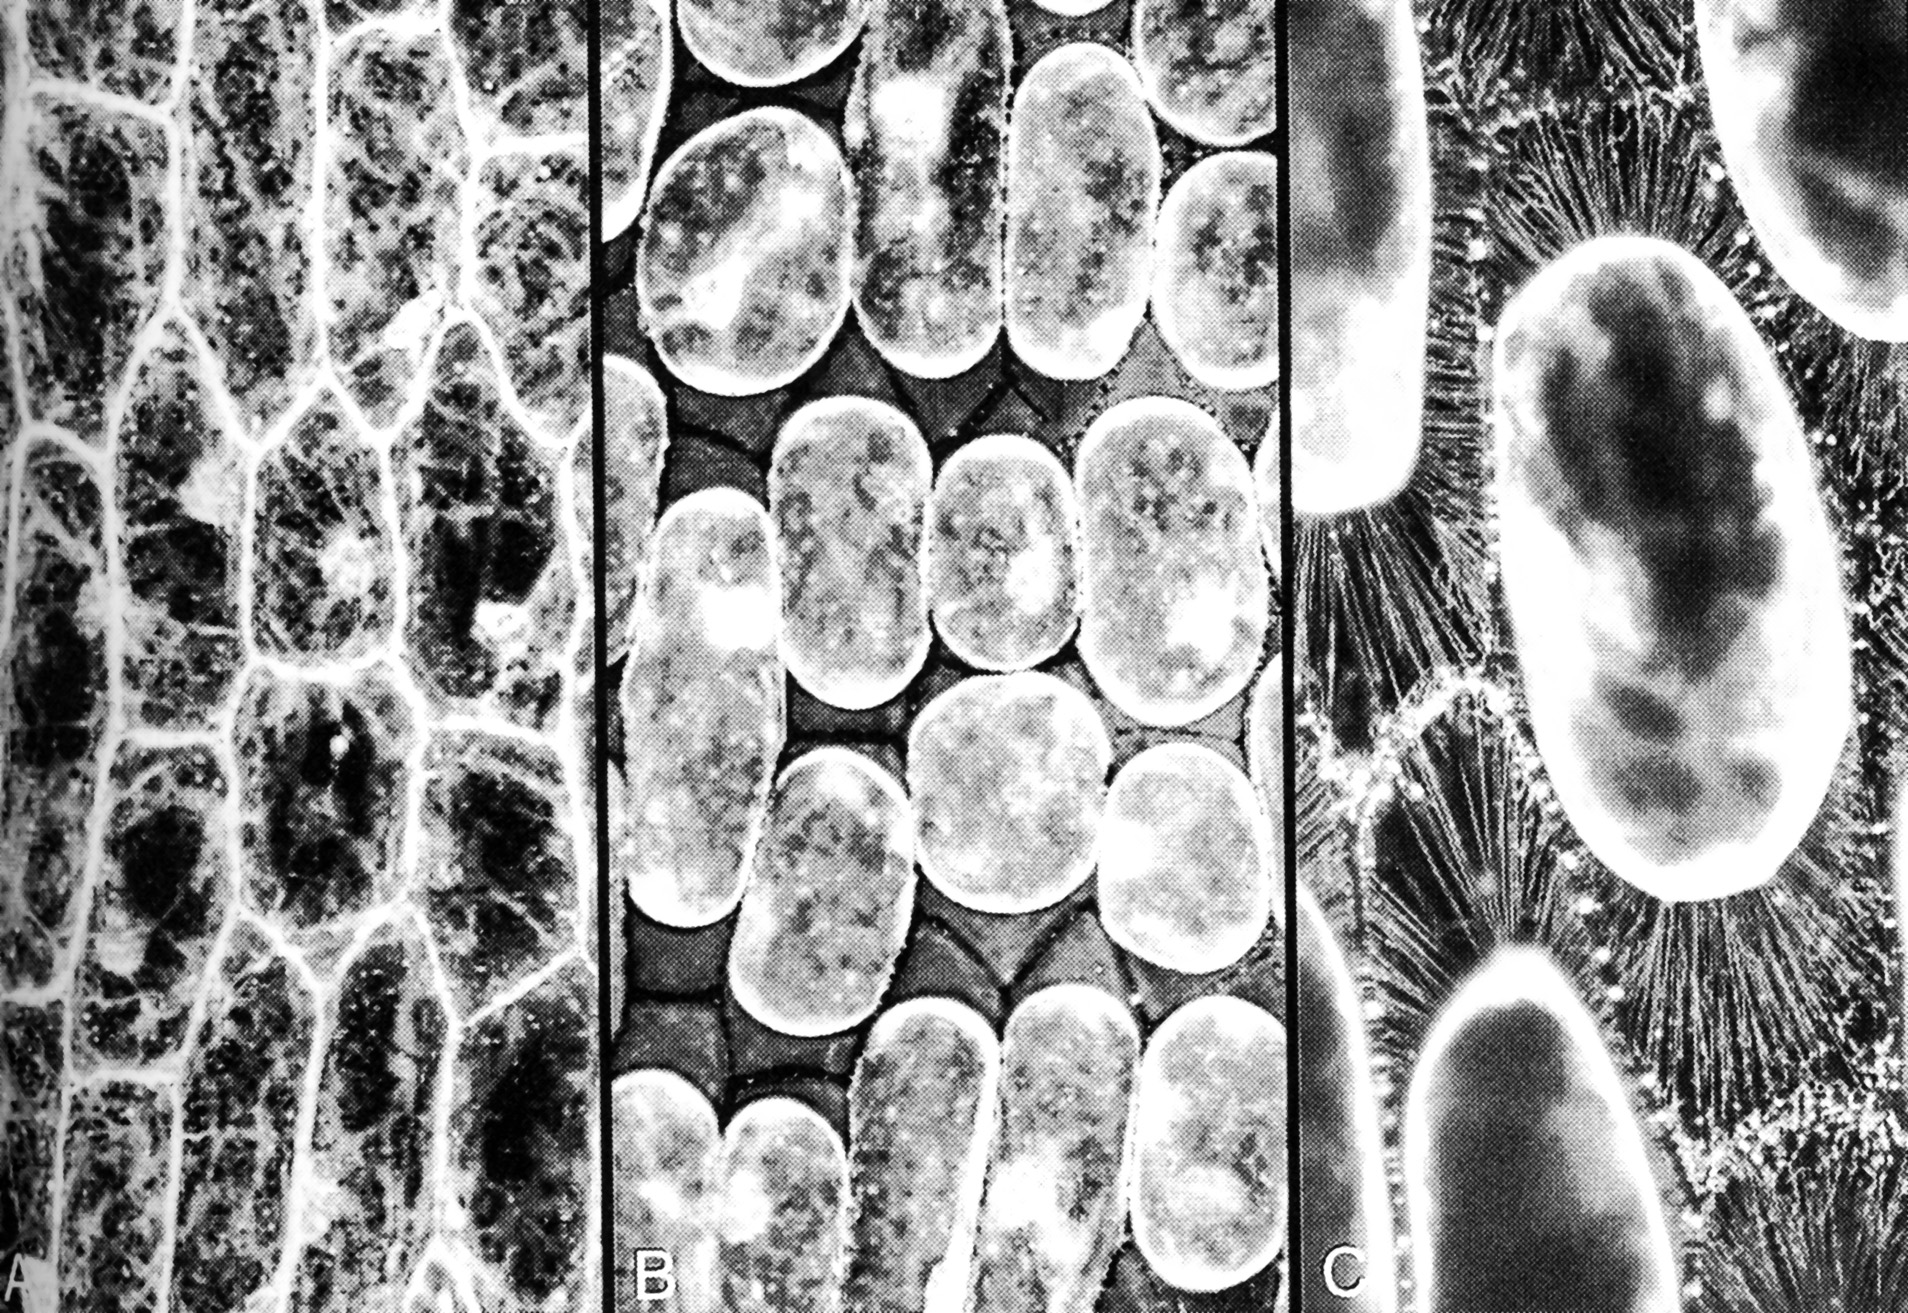
Figure 3.8. Cells in onion bulb scale leaf epidermis before and after plasmolysis, viewed by confocal microscopy and stained with fluorescent dye DIOC(6). (A) Cytoplasm is seen as pale strands at the cell surface, traversing the large vacuole. Cell boundaries are bright because the surface cytoplasm is intensely fluorescent. (B) Precisely the same field of view after plasmolysis in 0.6 M sucrose. The cell walls are now visible as dark lines between the shrunken protoplasts, which still show brightly fluorescent surfaces. (C) A reconstruction of many planes of focus at higher magnification to show some of the hundreds of stretched strands of plasma membrane that remain tethered to the wall during plasmolysis. (Micrographs courtesy B.E.S. Gunning)
The difference between cytorrhysis versus plasmolysis is most easily seen in leaves with single cell layers like mosses. Figure 3.9 shows that in the hydrated leaflet of Physcomytrella, when the central vacuole is distended, the chloroplasts line the cell wall. Rapid water loss causes a general shrinkage and eventually a collapse at the central parts of the cells. In cytorrhysis, the plasma membrane always remains in close contact with the cell wall. In contrast, when cells are bathed in a solution of small molecules like sucrose, glycerol, or low molecular weight polyethylene glycol, PEG, the solutes pass through the cell wall but not the plasma membrane, causing shrinkage of the protoplast and detachment of the plasma membrane from the cell wall. In plasmolysis, the gaps between the cell wall and the plasma membrane are filled with plasmolytic solution (Figure 3.9).
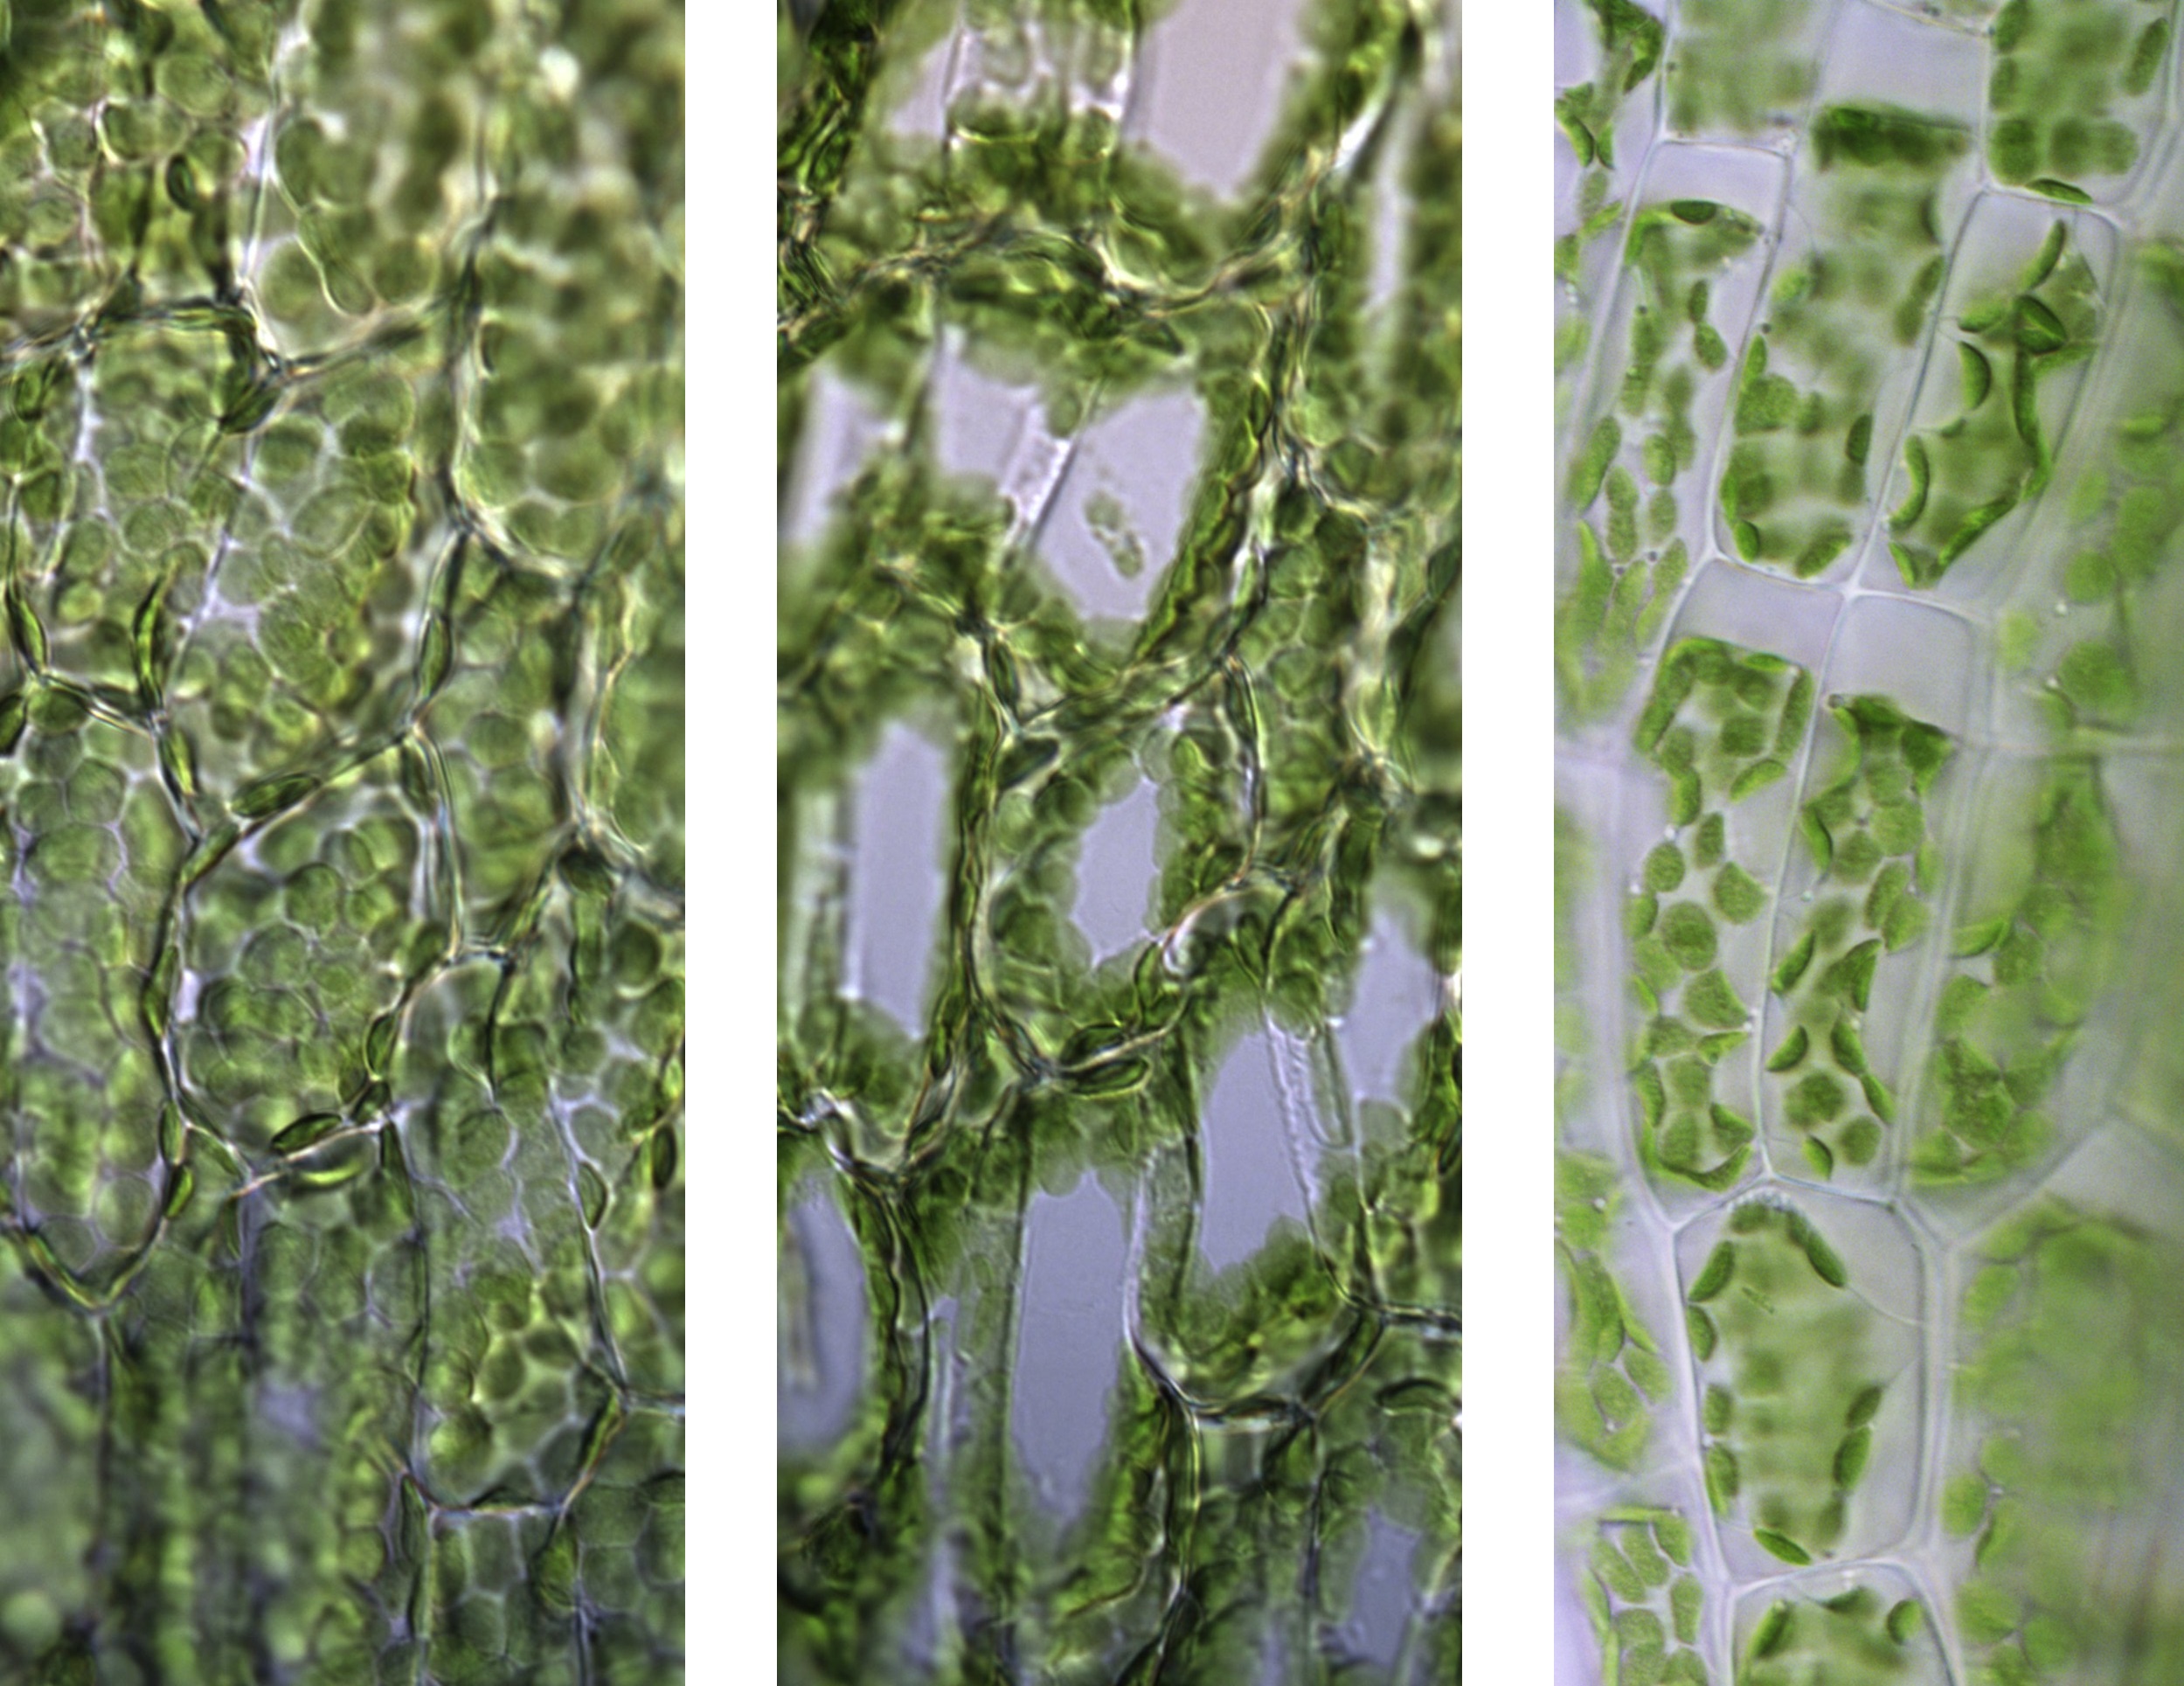
Figure 3.9. Cytorrhysis versus plasmolysis in Physcomitrella patens. Left: The single cell layer of a hydrated moss leaflet. Centre: Cytorrhysis, where water loss causes a general shrinkage and eventually a collapse at the central parts of the cells. White areas appear where the upper and lower cell walls meet; the chloroplasts are pushed towards the side walls. Right: Plasmolysis in 10% glycerol, which passes through the cell wall but not the plasma membrane. Water loss causes shrinkage of the living protoplast and the detachment of the plasma membrane from the cell wall. (Photographs courtesy I. Lang)
Cytorrhysis also occurs during freezing, when water is withdrawn from cells (Buchner and Neuner 2010).
Plasmolysis is a laboratory phenomenon and does not occur in nature. It is an experimental artifact.
Water flows throughout the plant in three different ways: (a) in bulk, (b) by diffusion in a liquid, and (c) by diffusion as a vapour. Different mechanisms are involved in these three types of flow.
Bulk flow is driven by gradients in hydrostatic pressure. It is much faster than diffusive flow because the molecules are all travelling in the same direction and hence their movement is cooperative. This is the flow that occurs in xylem vessels, in the interstices of cell walls, and in water-filled pores in soil. The resistance to such flow depends very strongly on the size of the flow channels.
Tall trees and fast-growing cereal crops like maize have large xylem vessels, of 100 µm in diameter or more. Flow rates are fast because the rate of volume flow increases in proportion to the fourth power of the radius for a given pressure gradient. Volume flow rate (m3s-1) in a cylindrical tube of radius \( r \) is proportional to \( r^4 \) and to the gradient in pressure along the tube, and inversely proportional to the viscosity \( η \) (Pa s) (Poiseuille’s Law)
\[ \text{Volume flow rate} = \left(\frac{\pi r^4}{8\eta}\right) * \left(\frac{\Delta P}{\Delta x}\right) \tag{6}\]
Where \( η \) is the solution viscosity and \( ΔP/Δx \) (Pa m-1)is the gradient in hydrostatic pressure. From equation (5) we understand that wide tubes are enormously more effective than narrow tubes. The importance of the relationship between tube radius and conductive efficiency becomes apparent when we examine long distance transport of water through the xylem (Section 3.2).
Diffusive flow in the liquid phase is driven by gradients in osmotic pressure. It is much slower than bulk flow because the net flows of solute and water molecules are in opposite directions and therefore impede each other. Where two liquid phases are separated by a semi-permeable membrane the flow of water across the membrane to the phase with the higher osmotic pressure is essentially diffusive, and the flow is driven by the difference in water potential across the membrane.
Vapour flow, for example through the stomata, is driven by gradients in vapour concentration, which are usually expressed in terms of partial pressure, but are nevertheless mechanistically concentrations.
As water in the transpiration stream moves from the soil to the roots, through the plant, and out through the stomata, all three types of flow are involved at various stages.
The potential energy of water is affected by gravity: unconstrained water runs down hill. In most plants the effect of gravity is small relative to common values of the water potential, but in tall trees it can dominate. Where the effect is important it is convenient to introduce the notion of a total water potential, \( Φ \), which is the sum of the water potential, \( ψ \), and a gravitational term, thus
\[\Phi = \psi + \rho gh = P - \pi + \rho gh \tag{7}\]
where \( ρ \) (kg m-3) is the density of water, \( g \) (m s-2) is the acceleration due to gravity, and \( h \) (m) is the height (relative to some reference) in the gravitational field. \( Φ \) is constant in a system at equilibrium with respect to water even when height varies. The value of \( g \) is approximately 10 m s-2, so the gravitational term, \( ρgh \), increases by 10 kPa for each metre increase in height. Hence, at equilibrium, when \( Φ \) and \( π \) are uniform (at least, in a system without semipermeable membranes) the hydrostatic pressure falls by 10 kPa for each metre increase in height.
In the tallest trees, for example a Eucalyptus regnans 100 m tall, equation (6) predicts that, even when the tree is not transpiring, the water potential at the top is about 1.0 MPa lower than at the base.
Pressure is force per unit area, Newtons per square meter, or N m-2. Its unit is the Pascal (Pa). 1 MPa is approximately equal to 10 kg weight per cm2.
Hydrostatic pressure is the pressure in a stationary fluid. (Note that hydrostatic pressure is usually quoted as the difference from atmospheric pressure, and is therefore taken to be zero when it equals atmospheric pressure).
Turgor pressure is the term used for the hydrostatic pressure in the cells’ contents.
Osmotic pressure (\( π \)) is the hydrostatic pressure in a compartment containing an aqueous solution that will just prevent pure water at atmospheric pressure flowing into that compartment through its membrane that is permeable to the water but not to the solutes within.
Water potential is the difference between \( P \) and \( π \).
Kramer PF, Boyer JS (1995) Water relations of plants and soils. http://udspace.udel.edu/handle/19716/2830
Nobel PS (2005) Physicochemical and environmental plant physiology (3rd edition). Elsevier Academic Press, Burlington, MA
Passioura JB (1980) The meaning of matric potential. J Exp Bot 31:1161-1169
Passioura JB (2010) Plant–Water Relations. In: Encyclopedia of Life Sciences. Wiley, Chichester. DOI: 10.1002/9780470015902.a0001288.pub2
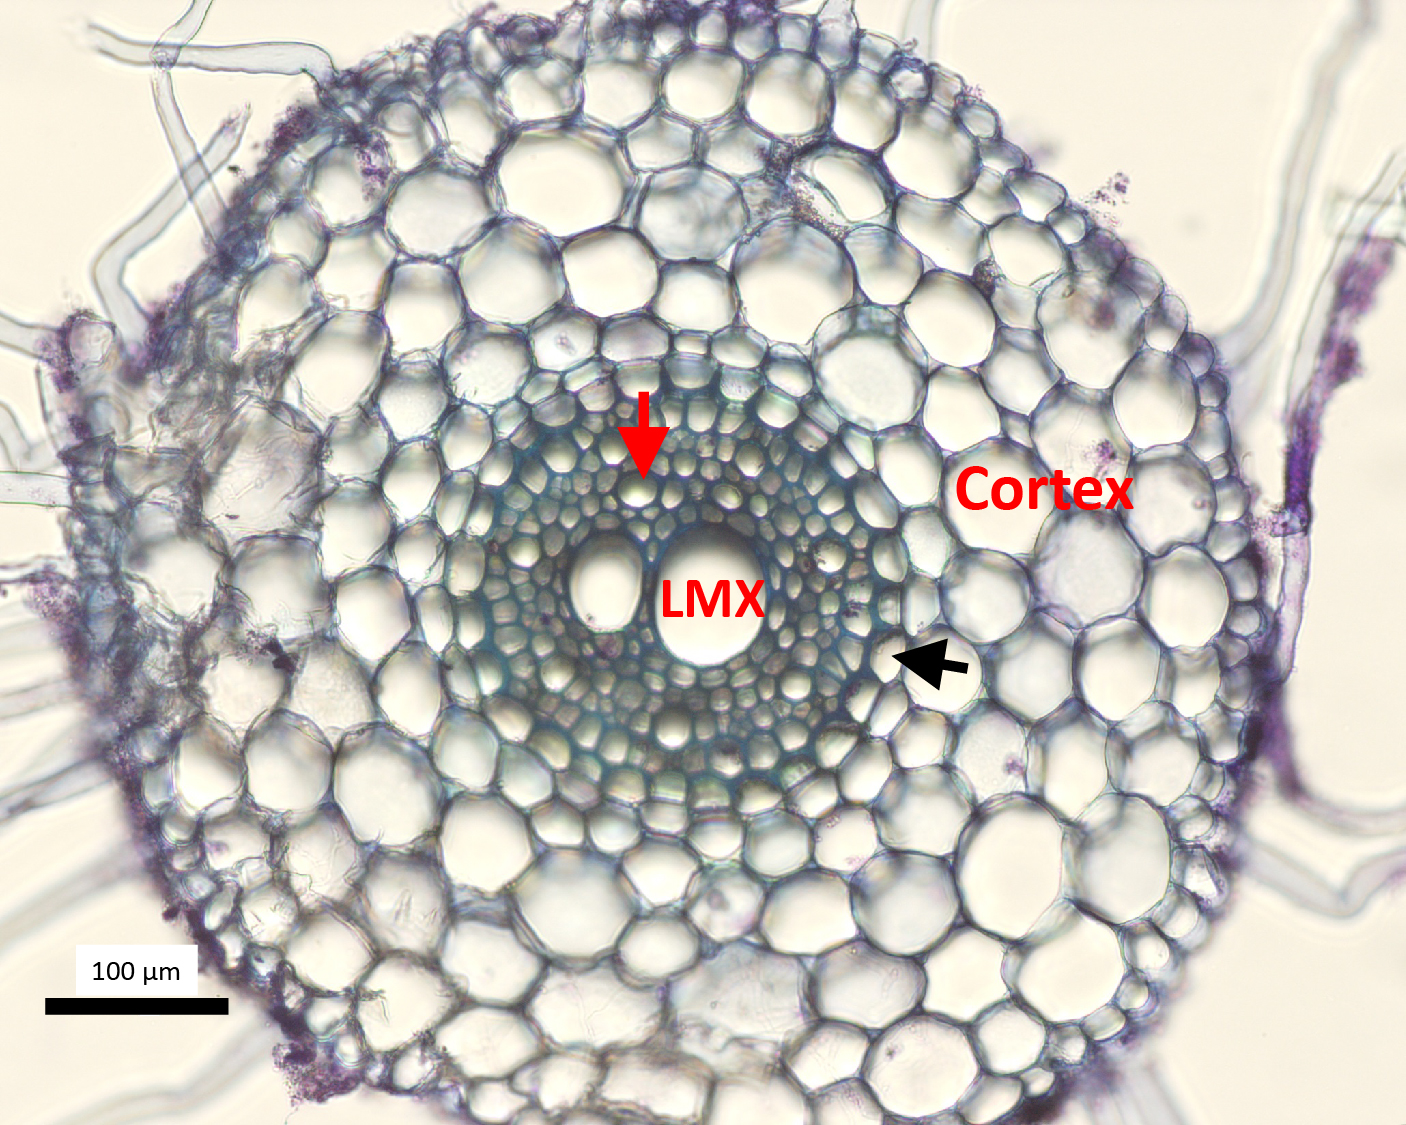
Figure 3.10 Cross section from a seminal wheat root stained with toluidine blue, showing the cortex, endodermis (black arrow), late metaxylem (LMX) central vessel, and peripheral xylem (red arrow). Many root hairs can be seen. Scale bar, 100 µm. (Image courtesy H. Bramley)
In vascular plants, water absorbed by roots is transported up the plant in the mature (dead) tracheary elements (xylem vessels and tracheids) of roots and stems (Figure 3.10).
Plants are capable of rapidly transporting water to heights in excess of 100 m, even from extremely dry soils and highly saline substrates. They can transport water from soils to leaves at velocities of up to 16 m per hour (4 mm per second) if they have wide xylem vessels in the range of 100 µm. With the more common xylem vessel size of 25-75 µm, peak velocities are 1-6 m per hour. What biophysical mechanism allows plants to achieve this? We know that plants do not possess a pump to move water to the canopy under positive pressure. Instead, plants suck!
Plants have evolved a transport system that relies on water sustaining a tensile force while under suction. The xylem sap in transpiring plants is under negative pressure. This elegant, but counter intuitive mechanism, described by the Cohesion-Tension theory, allows plants to move large quantities of water from the soil to the transpiring leaf surface with little input of metabolic energy. The following section describes the experimental history of how the Cohesion Theory came to be accepted.
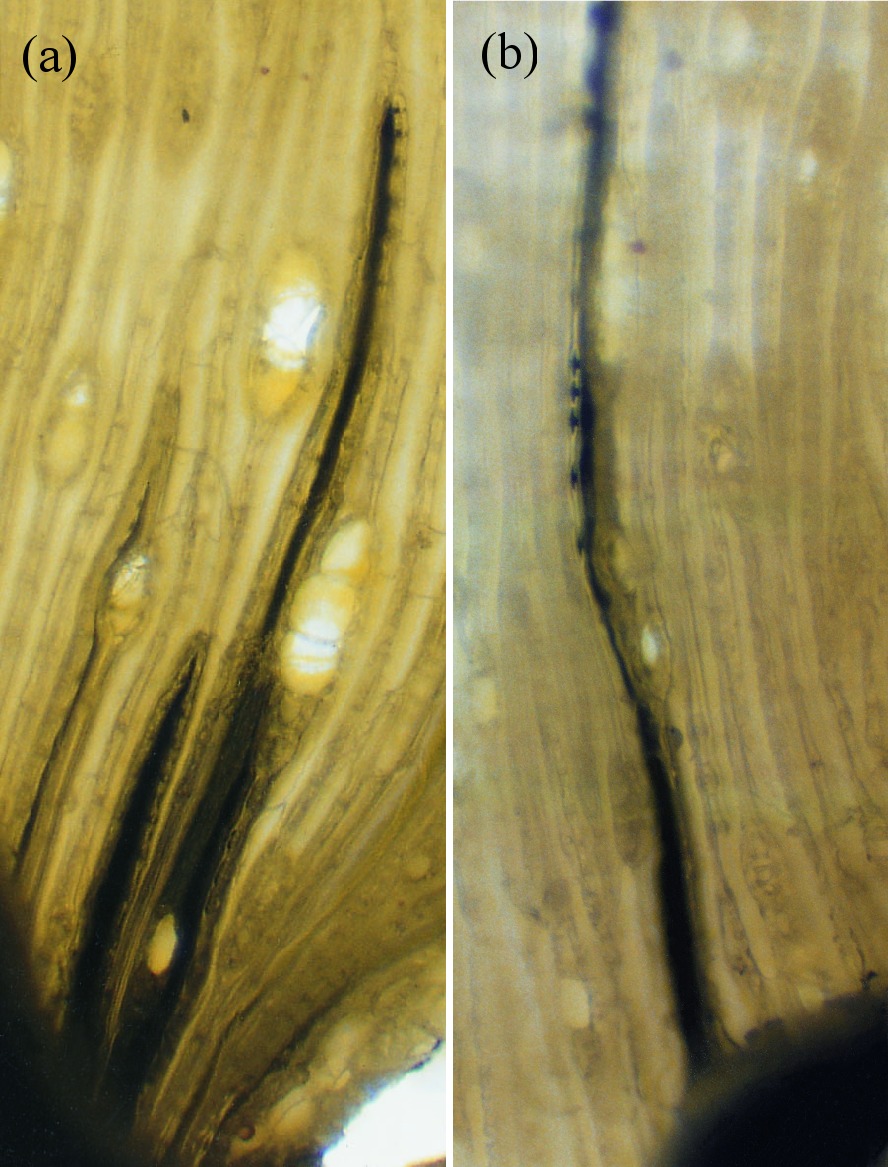
Figure 3.11 (a) Mercury (black) sucked into tracheids of pine (Pinus radiata) by transpirational pull generated in the shoots. The water—mercury interface is powerful enough to hold this vertical column of mercury in stems. The height to which the dark column of mercury rises is used to calculate suctions created in xylem vessels. Note the generally small heights, reflecting the high specific gravity of mercury. About 2 MPa suction is produced in these xylem vessels. (b) Mercury enters bordered pits but remains connected to the vertical column of mercury in xylem vessels. While mercury can pass through the pit apertures, it cannot pass the finely porous ‘pit membranes’ because it is much more cohesive than water. Seen laterally, the bordered pits appear as discs.
Around 1905, great plans were made to resolve the mystery of the ascent of sap in trees by Professor E.J. Ewart in Melbourne, using eucalypts as a model plant. At that time, Australian mountain ashes (Eucalyptus regnans) vied with American coast redwoods (Sequoia sempervirens) as the tallest trees in the world, being well over 100 m tall. Using special scaffolding, Ewart climbed eucalypt trees, removed lengths of branch and measured the pressures required to push water through these stems. These investigations led him to conclude ‘The ascent of water is, therefore, a vital problem in so far as it depends upon conditions which hitherto can only be maintained in living wood’. If water transport required living cells, it could not be supported by discovery of a pump akin to that in animals. Even roots, which sometimes could pump water by root pressure, lacked the necessary positive pressures to push water so far aloft, especially around midday when water was most needed.
Suction from the shoots was an alternative explanation, but manmade suction pumps cannot do this without inducing formation of air bubbles (embolisms) in the xylem and blocking flow. One clue to the solution came from Dixon and Joly (1894) who claimed that very pure water molecules would be held together by powerful cohesive forces provided the water was especially clean (much cleaner than in manmade pumps).
Ewart did not agree with the unorthodox proposal that the suction of pure water through xylem vessels underpinned transpiration. However, Dixon (1914) ultimately postulated the Cohesion Theory, based on those properties of water which distinguish it as an ideal biological solvent. Cohesion (due to hydrogen bonding between molecules of water), adhesion to walls of the vessels, and surface tension, are central features. In short, in the absence of microscopic gas bubbles water could withstand quite enormous tensions.
Evaporation from wet cell walls of substomatal cavities in leaves creates a large tension (also called negative pressure or suction), which is transmitted via xylem conduits, pulling more sap from roots to leaves. Fine pores in cell walls provide sufficient suction to draw water to the crown of even a lofty tree: a curved interface in a 10 nm pore can store a pressure of -30 MPa. This value can be derived from equation (5) in the previous section: DP = 0.15/r where P is in Pa and r in this case is 5 x 10⁻⁹ m.
Through the evaporative power of the atmosphere, a continuous ‘chain’ or ‘catena’ of water, well below atmospheric pressure, could be drawn up to a leaf canopy. The tensions created in this way could even suck water from the surrounding soil. We now recognise that the evaporative energy is supplied as the latent heat of vaporisation ultimately derived from solar radiation. This cohesive property of water gave rise to the ‘Cohesion Theory for the Ascent of Sap’.
Two other properties of water are also essential for long-distance water transport: surface tension, and the adhesion of water to solid surfaces such as the xylem vessels within trees. Dixon claimed that if water could ‘hang together’, the enormous evaporative energy of the air (the same power which dries the washing hanging on a line) could be harnessed to lift sap, which is mainly water, vertically. This would entail no metabolic energy on the part of the plant. This theory of sap flow accorded with earlier experiments by Professor E. Strasburger in 1893 showing that a tall oak tree trunk, severed at the base, could draw poisons and dyes up to the leaves by some wick-like action. If metabolism energised sap flow, poison should have inhibited it. This was well illustrated in later experiments (Figure 3.11a) in which mercury was drawn through fine tracheids of pine stems purely through the suction created by transpirational water loss from the shoot above. The tension required to achieve this is about 2 MPa.
However, the physical properties of plants had to be more complex than those of simple pipes conducting water. As mentioned, manmade pumps failed through embolisms if used to suck water higher than 10 m, whereas hundreds of litres of water reaches the canopies of tall trees daily. Even overlapping sawcuts in tree trunks, which should allow a massive quantity of air to flow into xylem vessels when under suction and cause trees to die from embolisms, did not stop all water flow to leaves. If water was under such suction, how could trees keep air bubbles out of the sap when the trunk was cut? This additional problem was not resolved until the very complex anatomical structures of trunks were much better understood. The highly compartmentalized, extensively redundant structure of the xylem network performs the critical role of isolating gas voids while water transport continues in adjacent conduits. In reality, the complex structure of the xylem network is what makes reliable water transport under tension possible.
Xylem is not composed merely of pipes: it is made up of partially sealed units (technically vessels, tracheids and fibres, called collectively conduits), which most effectively limit the spread of introduced gases and thus, maintain water flow in some conduits despite very severe disruption from embolisms in others.
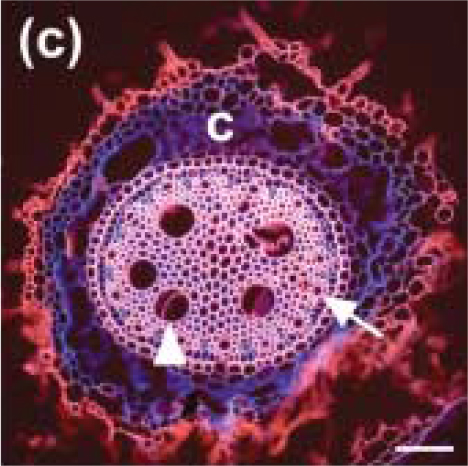
Figure 3.12 Cross section from barley root grown in soil; coleoptile node axile root, bar 100 µm. C is cortex, arrow points to peripheral xylem and arrowhead points to inner xylem. Extensions from the epidermis (red) are root hairs. Section was stained with rhodamine B and viewed with UV fluorescence optics. Micrograph, M. Watt. (Reproduced from New Phytol 178: 135-146, 2008)
The diameter of xylem vessels can be as small as 10 µm as in Arabidopsis, 60-100 µm in the roots of wheat and rapid growing annuals like maize, to over 100 µm in trees. Remembering that trees can be over 100 m in height, the conductive efficiency of xylem conduits is essentials for plants to move water to the canopy at rates that satisfy the transpirational water loss at the leaf surface. These dimensions are for the vessels with maximum diameter, the late metaxylem in the central part of the stele (e.g. Figure 3.12).
The diameter of xylem vessels in a given species varies greatly with root type (Watt et al. 2008). For example, in wheat and barley, the diameter varies from 10 to 60 µm depending on position within the stele (central or peripheral), and the type of root (seminal or nodal). Figure 3.12 shows a section of a nodal root from barley.
A wider xylem diameter translates to an increase in conductive efficiency that can be appreciated by revisiting equation (6). From the Hagen-Poiseuille Law, which shows that flow increases with the fourth power of the radius, we can see that a four-fold increase in the radius of a tube leads to a 256 fold increase in the volumetric flow rate.
In addition to allowing for high rates of water flow, the xylem must also protect the plant against formation and spread of gas bubbles. For xylem sap to sustain tensions required in tall trees, there must be no gas bubbles in the system. Cohesion breaks down if there is a single ‘nucleation site’ on which bubbles can form and enlarge. On the other hand, sap normally contains dissolved gases which, surprisingly, do not disrupt the system provided there are no nucleation sites available. Even the rigid walls of xylem vessels are compatible with high xylem tensions, attracting water by adhesion, which is essential for transport.
Surface tension acts as an interfacial water–air stopper, preventing air from being sucked into the many millions of tiny pores present in all plant cell walls. For example, water delivered to leaf cells by xylem vessels passes through these tiny menisci, which act effectively as non-return valves, so preventing air from being sucked into the xylem (Section 3.3). Surface tension also explains how water in leaves remains under strain within an essentially porous system through which water flows.
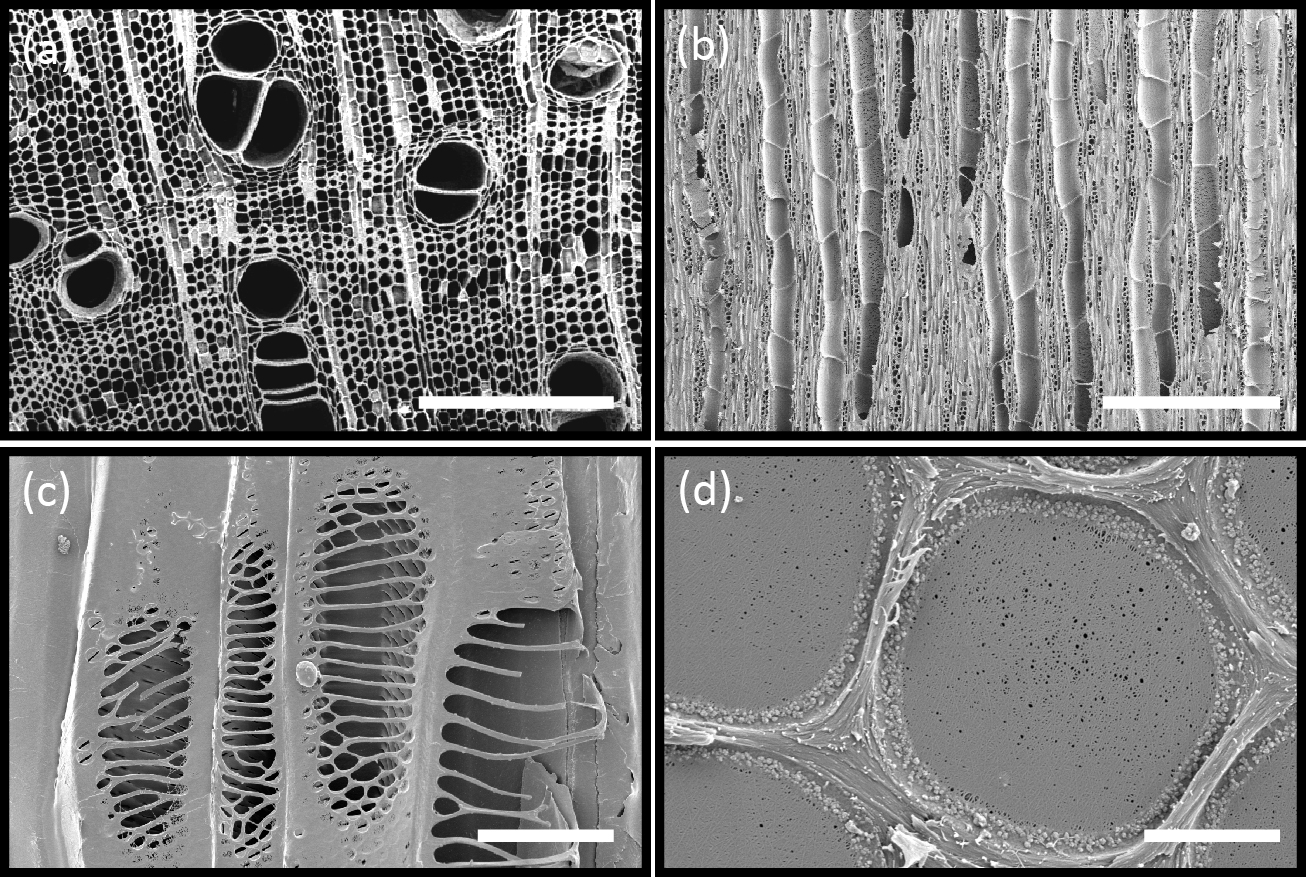
Figure 3.13 (a) Scanning electron micrograph (SEM) shows a transverse section of xylem tissue in Brachychiton australis. Large xylem vessels are surrounded by fibres and parenchyma; scale bar, 500 μm. Xylem vessels are dead at maturity and form long hollow tubes that minimise the resistance to water flow through the plant. Connecting intervessel walls contain bordered pits, cavities in the lignified secondary cell walls that allow for transfer of water between vessels. (b) Longitudinal section showing vessels in the xylem tissue of Fraxinus americana. Vessels are made up of repeated individual units (vessel elements) that are joined end to end by perforation plates; scale bar, 400 μm (c) SEM of the finely sculptured scalariform perforation plates in Betula ermanii xylem. Water passes easily from one xylem vessel to another by this route; scale bar, 20 μm (d) SEM showing surface view of the pit membrane with secondary wall removed by sectioning; scale bar, 2 μm. Tiny pores allow the movement of water between vessels but limit the movement of gas and pathogens. Bordered pits act as the safety valves of the plant hydraulic system. (Images courtesy B. Choat and S. Jansen).
Vascular transport systems have evolved to become amazingly reliable despite the metastable condition of the sap (existing as a liquid below its vapour pressure). From primitive, thickened, hollow cells, increasing specialisation has produced greater elongation and thickening of the tubes (Figure 3.13a,b). Xylem walls contain pits, in which zones of the primary wall known as ‘pit membranes’ allow water to be transmitted between vessels efficiently, while preventing a gas phase spreading through the interconnected system of vessels and blocking transport through embolisation (the blockage of a fluid channel with a bubble of gas) (Figure 3.13d). No living membrane is present in these wall structures. The efficiency with which pit membranes isolate adjacent vessels is shown in Figure 3.11b (in the previous section) where mercury, a highly cohesive liquid, is drawn into specialised bordered pits of pine tracheids without being able to exit into neighbouring tracheids.
Vascular systems have evolved from plant species possessing only fibres and tracheids, for example the more primitive Tasmannia, to more advanced plants possessing vessels which resemble the unicellular tracheids in structure but are much wider and longer and originate from a number of cell initials fused together. Lignin thickening patterns have also evolved. Some thickening designs, such as annular and spiral, allow the tubes to extend longitudinally while supplying growing organs.
When elongation growth has ceased, an organ can be provided with more efficient pipes of larger bore and with stronger thickenings, in reticulate and scalariform patterns (Figure 3.13c). Pit fields which allow water transport across vessel walls can also be simple, unreinforced structures (simple pits) or more elaborate bordered pits in which secondary cell walls mechanically support the pit membrane. All these forms of pits can prevent air in an air-filled conduit from spreading to adjacent conduits which are conducting water under strong suction. Reinforcement of the walls around pits allows pit membranes to be as large as possible and thereby maximise water exchange between vessels.
The late metaxylem carries the bulk of the water to the shoot because of its greater diameter - four-fold increase in the radius of a tube lead to a 256-fold increase in the volumetric flow rate (3.1.5). However, it does not mature until well back from the root tip, and so the younger part of the root is not functional in providing water to the rest of the plant.
Root tips take up enough water for their own cell expansion but they cannot pass this onto the rest of the plant as their xylem vessels are still alive and not able to function as a conduit. Only when they die, mature, and lose the integrity of their plasma membranes, and the cell walls in the transverse plane disintegrate, can they function as conduits.
Xylem conduits (vessels and tracheids) are dead at maturity. They do not mature until sometime after they are fully elongated, and so they remain alive long after they leave the growing zone of the root. The last-formed xylem vessels in angiosperms, the late metaxylem, may be found alive for some distance from the root tip. In Arabidopsis they remain alive until the root hair zone, but in most species they can only be seen further than 5 or even 10 cm from the root tip.

Figure 3.15 A longitudinal face 15 cm from the tip of a main root of a 21 day-old soybean. Portions of 4 developing elements of what will become a late metaxylem vessel (LMX) are shown. The face grazes a mature LMX element (upper left) with very thick wall. The base of the root is toward the left. Diameter of immature xylem is about 50 µm. SEM image, M. McCully. (Reproduced from Protoplasma 183: 116-125, 1994)
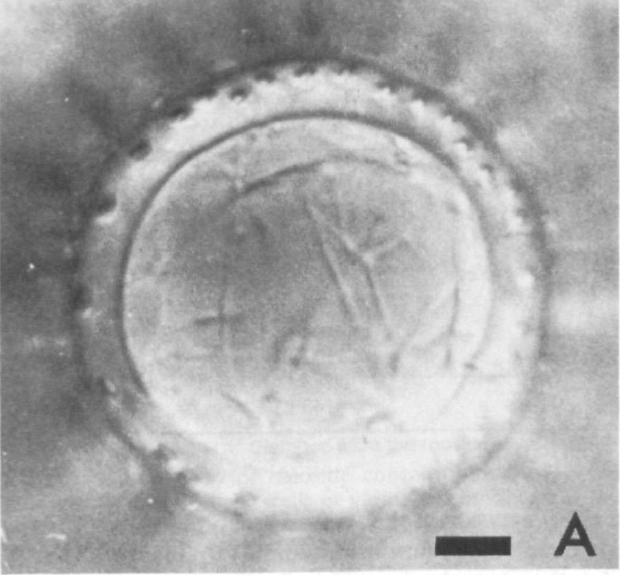
Figure 3.16 Cytoplasmic strands in differentiating LMX elements 50 mm from the root tip of barley. Scale bar, 10 µm. Hand cut section of fresh material, Nomarski optics, C.X. Huang and R.F.M. van Steveninck. (Reproduced from Physiol Plant 73: 525-533, 1988)
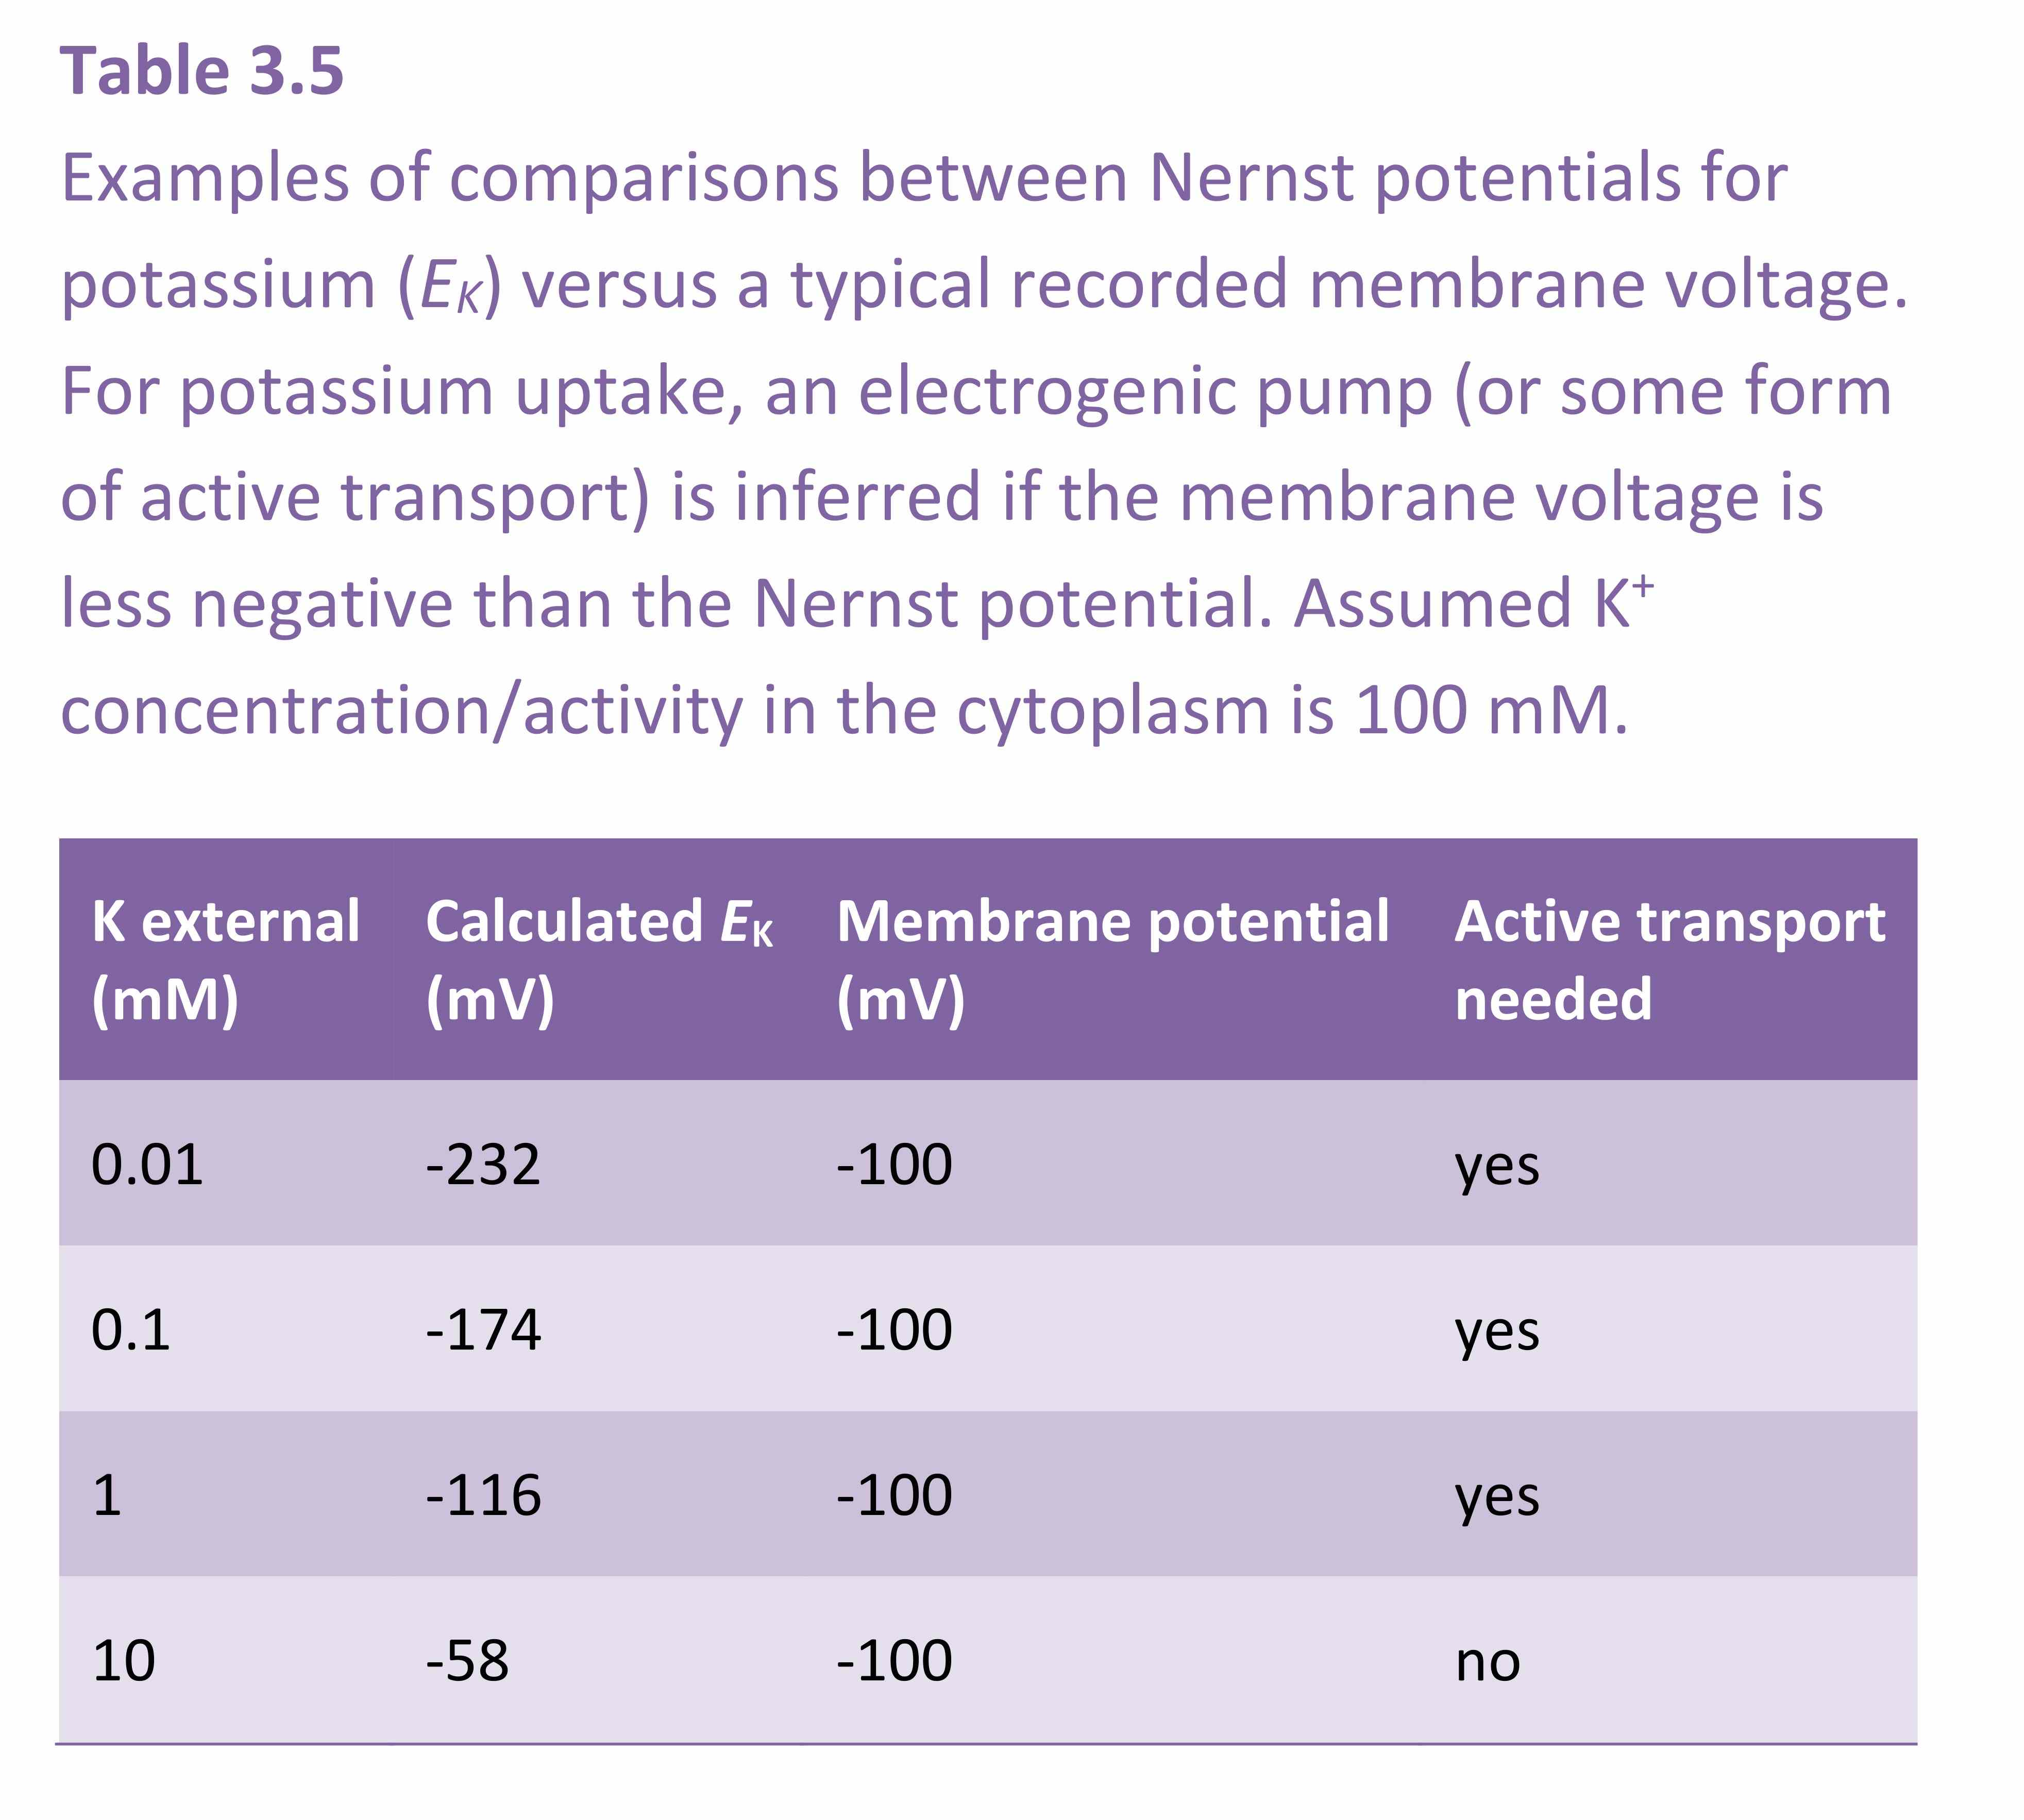
In soybeans, immature vessels were found as far as 150 mm from the root tip (McCully 1994). In barley the late metaxylem vessel (LMX) was still differentiating 100-150 mm from the tip (Huang and van Steveninck, 1988). Light microscopy of hand-cut sections showed the presence of cytoplasmic strands and intact cross walls in LMX up to 100 mm from the tip (Figure 3.16).
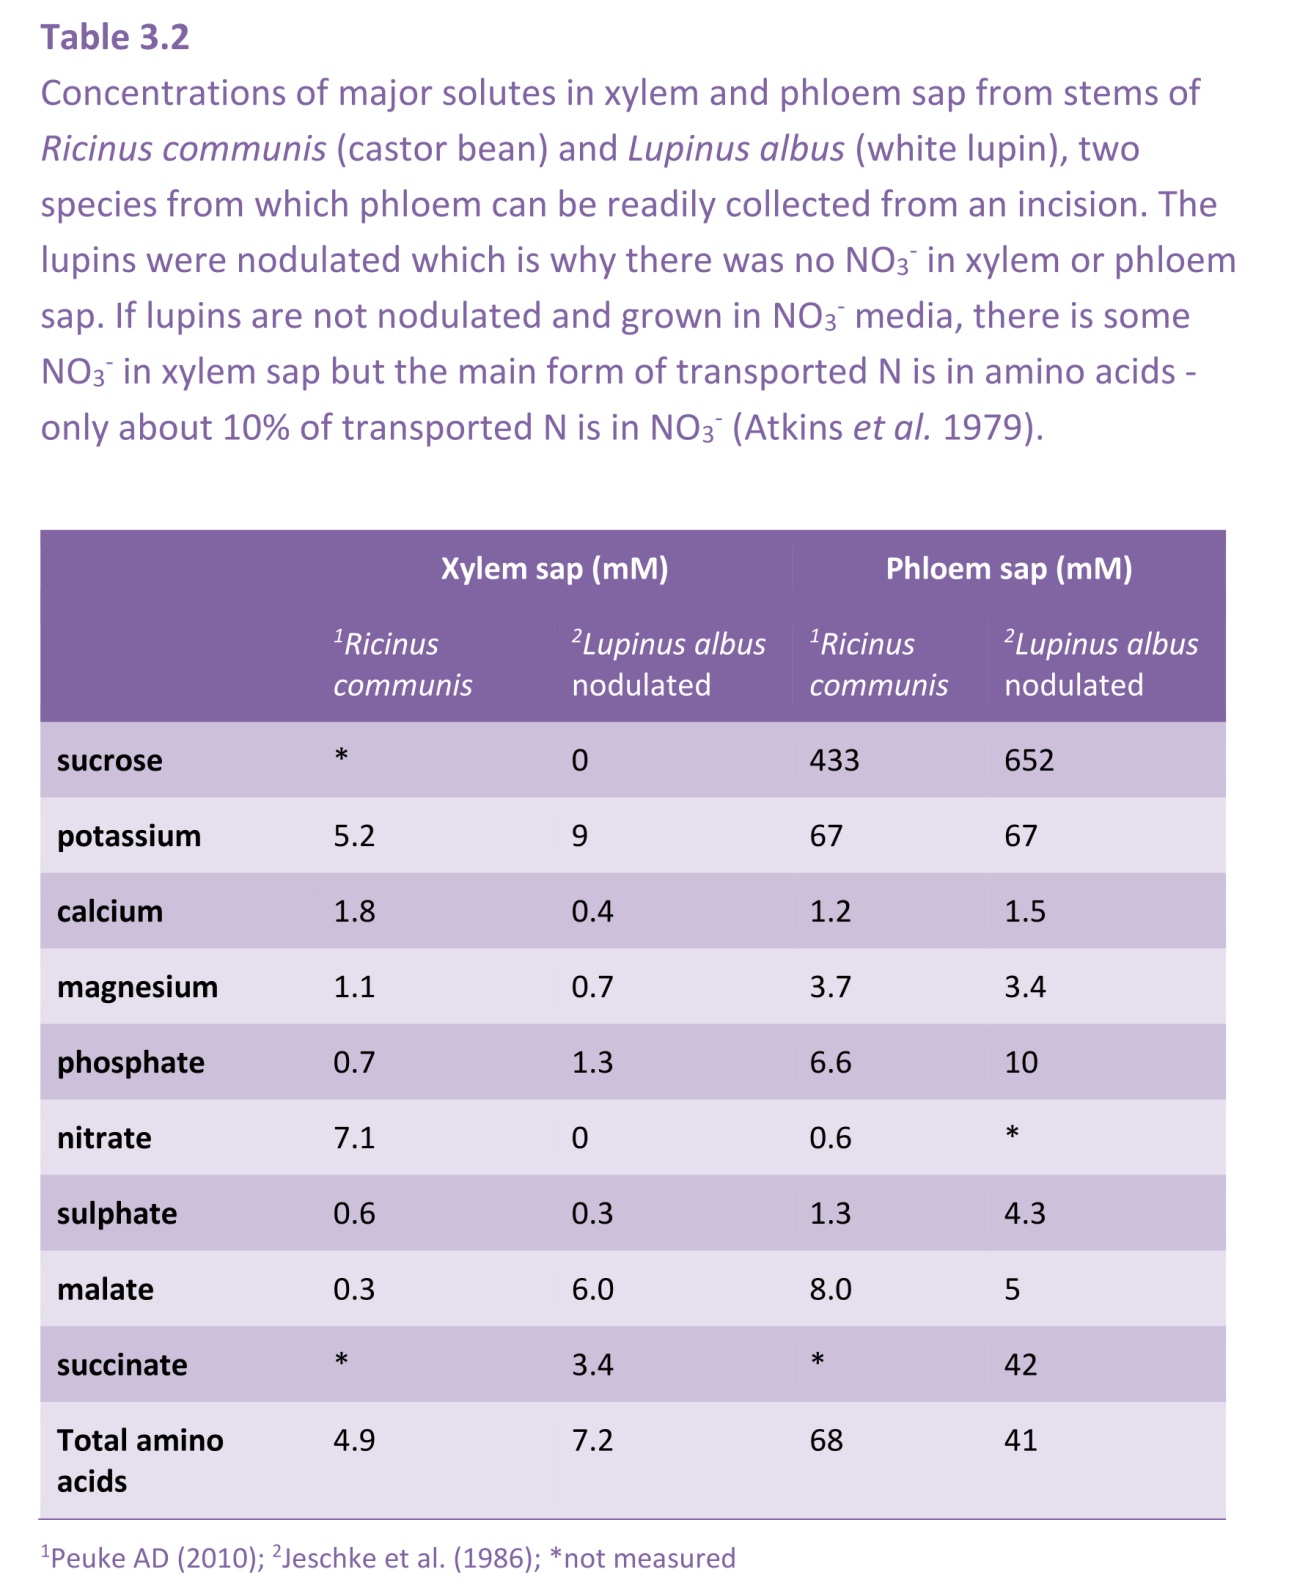
Living/immature xylem vessels can be recognised by their high K+ concentrations, 100 mM or more. In contrast, xylem sap that flows through the roots has K+ concentrations of only 5-10 mM, as shown in Table 3.2 in the following section.
When the vessels mature, and their end walls disintegrate, their cellular contents are carried away by the transpiration stream. This leaves hollow tubes that greatly increase the conductance of water flow through the xylem.
Figure 3.17 shows the effect of xylem differentiation and maturity on axial conductance in roots of two crop species, wheat and lupin. Xylem are continually differentiating in lupin within a short region of a young root, which results in dramatic increase in axial conductance. In contrast, once the central metaxylem of wheat has matured there is little change in the root’s axial conductance.

Figure 3.17 Cross sections of wheat (A) and lupin (B) roots stained with berberine-aniline blue and viewed under UV optics. Scale bars, 50 µm. Mature xylem vessels fluoresce due to lignification of their cell walls, which increases with root development (compare upper panels taken 2 cm from the root tip with lower panels taken 18 cm from root tip). (C) shows change in axial conductance as vessels mature in young roots. Images and graph, H. Bramley. (Modified from Plant Physiol 150: 348-364, 2009)
Xylem sap contains all the inorganic nutrients needed for plant growth, in the proportions in which they are needed. The concentrations of some nutrients are dilute when compared to phloem sap, in particular potassium and nitrogen-containing solutes (Table 3.2). The concentrations also vary at different times of day, being lowest in the middle of the day when transpiration is highest, and quite high at night when stomates are closed so there is very little flow of sap to the shoots. The osmotic pressure of xylem sap therefore ranges from less than 0.05 MPa during the day to about 0.15 MPa (60 mOsmol L–1) during the night. The flux of solutes (the concentration multiplied by the flow rate of the sap) is maintained at a steady rate over the whole 24 hours.
Most solutes in xylem sap are inorganic ions (e.g. nitrate, potassium, magnesium and calcium), but organic solutes are also present (Table 3.2). Organic acids and amino acids in xylem sap can be present in substantial concentrations, and sugars (but not sucrose) reaching 5 mM in some perennial species. Many trees including eucalypts are host to boring insects at particular times of the year, when sugar and nitrogen content of the sap is nutritionally valuable. Even though sugar concentrations in xylem sap are much lower than in phloem sap, the high nitrogen to sugar ratios and low osmotic pressures make it a good substrate for many herbivores. More extreme examples of the carbohydrate content of xylem sap are temperate deciduous trees such as maple, which have traditionally been tapped to yield a sugary solution in the period prior to budburst. This indicates that xylem can be a conduit for carbon remobilisation in addition to its central role as a pathway for water and nutrient transport. Xylem parenchyma cells load ions into xylem vessels in roots (Section 3.6) and also contribute to modification of ion levels along the xylem pathway. In secondary tissues, rapid transfer of solutes into and out of the xylem is partly achieved through close association of living ray cells and xylem vessels.
Other organic molecules act to transport inorganic nutrients to the shoots. Nitrate and ammonium are assimilated into organic forms, such as amino acids, in the roots of many plants. In legumes, nodules deliver an even wider selection of nitrogenous compounds to the xylem, including ureides and amides. These often constitute the dominant form of nitrogen reaching shoots and are therefore, a major component of the sap. Other examples of complexed forms of inorganic nutrients in xylem sap are metal ions such as zinc, copper and iron, which are almost exclusively chelated to organic acids.
Phytohormones such as abscisic acid and cytokinins are present in xylem sap and serve as signals from roots to shoots affecting growth and development, and other physiological responses.
A rapidly transpiring leaf can evaporate its own fresh weight of water in 10 to 20 min, though many plants such as cacti, mangroves and plants in deep shade have much smaller rates of water turnover. Leaf veins must carry this water to all parts of a leaf to replace evaporated water, and maintain cell hydration and turgor. When water supply fails to meet this demand, shoots wilt.
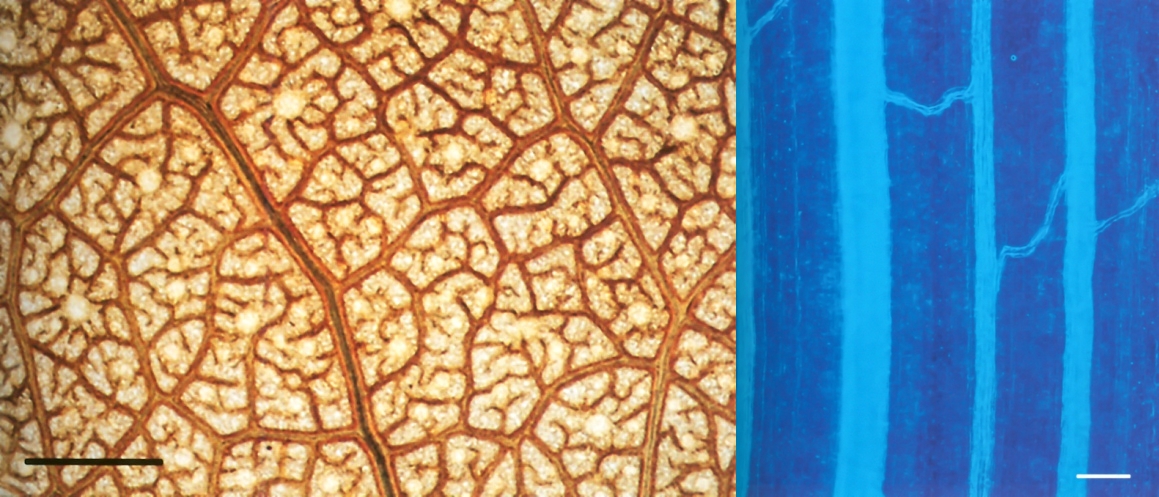
Figure 3.20 Typical leaf vein pattern of broad-leaf species versus grasses. Left: Leaf of Eucalyptus crenulata showing the arrangement of supply and distribution veins. Large veins with large vessels, in which water is moved rapidly across the lamina, surround islets of small veins with small vessels in which water is slowly distributed locally. Scale bar, 1 mm. Right: Leaf of wheat (Triticum aestivum) showing one large and three small longitudinal veins, with transverse veins connecting them. Scale bar, 0.1 mm. Distance between small veins is about 0.15 mm in both species. (Photographs courtesy of M. McCully and M. Canny)
Vein distribution patterns differ markedly between broad-leaf species and grasses. Broad-leaf species generally have a highly branched network while grass species have parallel veins (Figure 3.20).
Veins consist typically of tightly packed xylem and phloem tissues surrounded by a parenchymatous or fibrous sheath. Both xylem and the phloem contain living parenchyma cells as well as their characteristic transporting conduits: vessels and/or tracheids in the xylem tissue, plus sieve tubes in the phloem tissue. There are no intercellular air-spaces, or only very small ones.
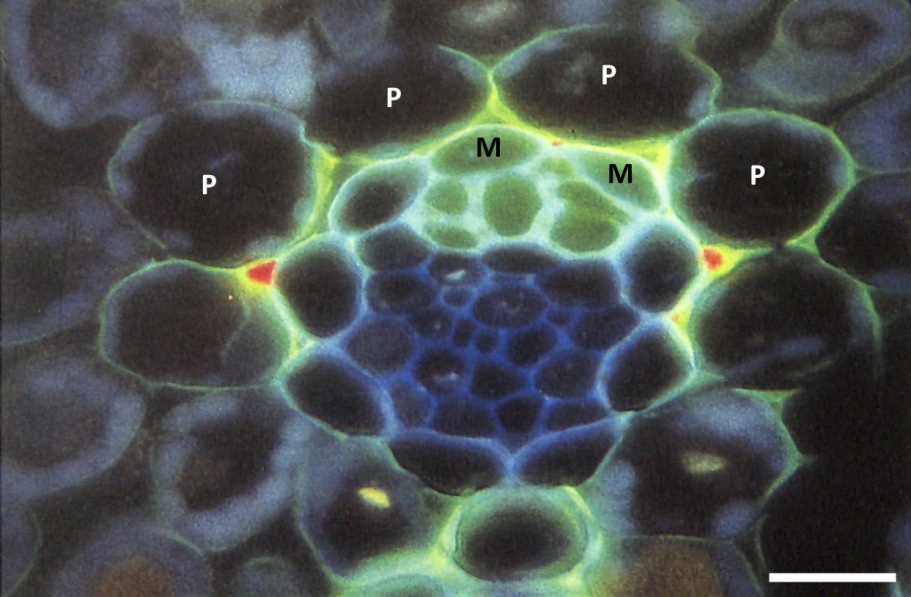
Figure 3.21 Transverse section of small intermediate vein of wheat leaf, after being fed the fluorochrome sulphorodamine, which acts as a tracer for water movement. Water passes out of the xylem through paths in the walls of the mestome sheath cells (M) and enters the parenchymatous sheath cells (P) leaving red crystals in the intercellular spaces. Scale bar, 15 µm. Image, M. Canny. (Reproduced from New Phytologist, Tansley Review No 22, 1990)
The ring of cells forming the sheath around the xylem and phloem tissue acts both as a mechanical barrier that may confine pressure within the vein, and a permeability barrier that can control rates and places of entry and exit of materials (Figure 3.21).
The simplest vein architecture is found in conifer needles where a single unbranched strand of xylem and phloem is surrounded by mesophyll (Figure 3.22).
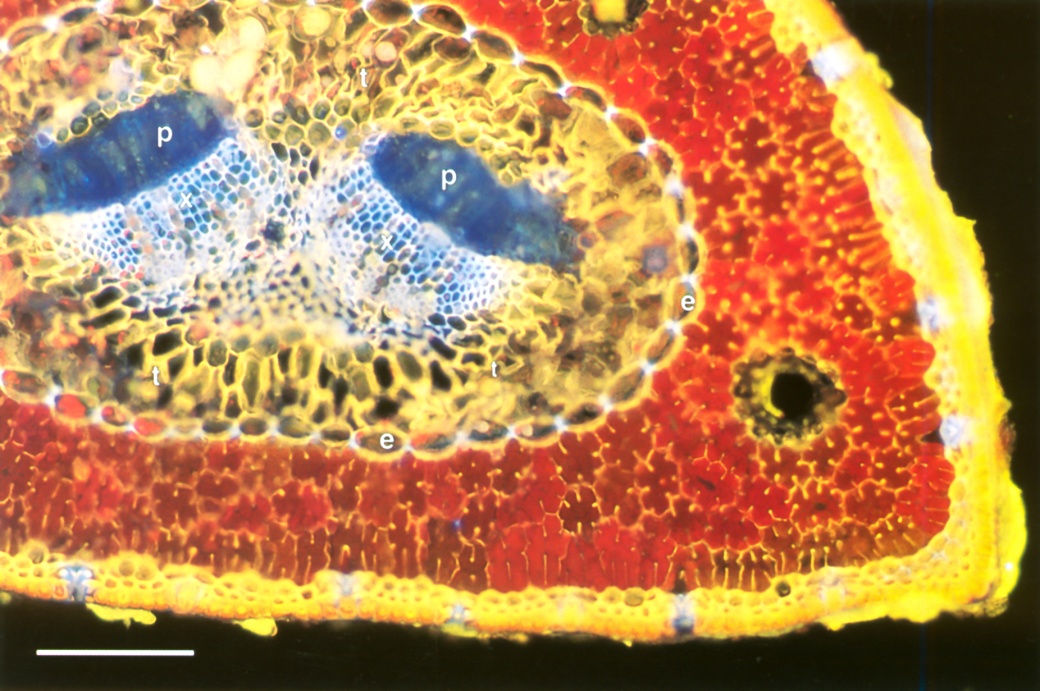
Figure 3.22 Transverse section of a pine needle. A single central vein has two strands of phloem (p) and xylem (x), embedded in transfusion tissue (t). These vascular tissues are separated from the chlorophyll-containing mesophyll (red) by an endodermis (e) with Casparian strips and suberised lamellae. Stomata in the epidermis appear bluish. Rhodamine B stain, fluorescence optics. Scale bar, 0.1 mm. (Photograph courtesy M. McCully)
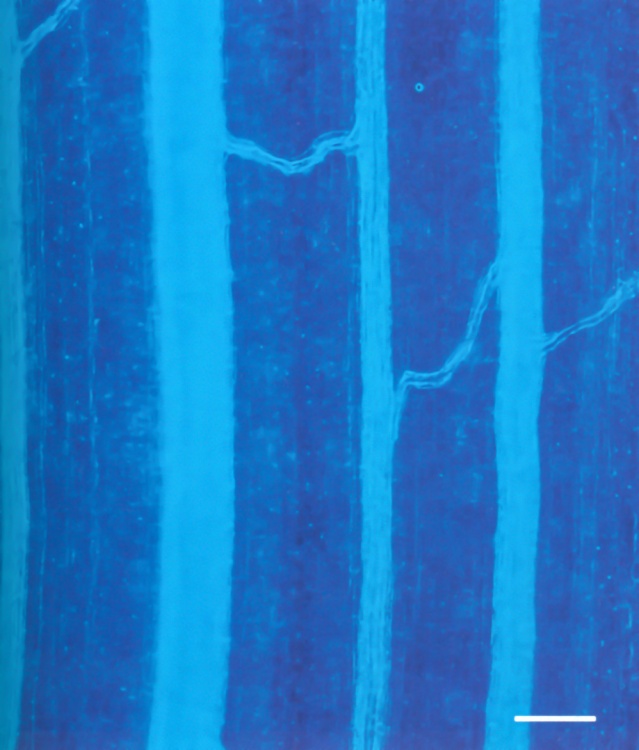
Figure 3.23 Wheat leaf showing one large supply vein and three small distribution veins, connected by transverse veins. Small veins could carry two thirds of the evaporated water. Dark-field optics, blue filter. Scale bar, 0.1 mm. (Photograph courtesy M. McCully)
Vascular strands are enclosed by an endodermis that separates them from the mesophyll, and are embedded in a mixture of parenchyma cells and tracheids called transfusion tissue. Water from the xylem permeates radially outward through transfusion tissue, endodermis and mesophyll to evaporate below lines of stomata in the epidermis.
Leaves of angiosperms have much more complicated venation than conifer needles. If you look at a grass leaf with your hand lens, parallel veins run the length of the leaf, but they are not all the same size. A few large veins have several small veins lying between them. On closer inspection with a light microscope, all these parallel veins are connected at intervals by very small transverse veins (Figure 3.23).
There are in fact two vein systems with different functions: large veins supply water rapidly to the whole length of a leaf blade while small veins and their transverse connections distribute water locally, drawing it from the large veins. Water in large veins flows only towards the tip, but in small veins it can flow either forwards or backwards along the leaf blade or transversely between adjacent parallel veins. The distinction of flow patterns in large and small veins arises as a result of different vessel sizes. Large veins have wide vessels (about 30 µm diameter), while small veins have narrow vessels (about 10 µm diameter). As the volume of water flowing along pipes is proportional to the fourth power of the radius (Equation 6; Poiseuille’s Law), volume flow in the larger vessels will be 3 to the fourth power (= 81) times greater than the flow in the smaller vessels. Put another way, pressure gradients along the leaf in large vessels will be very slight, but steep pressure gradients can develop locally in narrow vessels that will direct local flows into the mesophyll. Large veins supply water rapidly over the whole lamina while small veins distribute it locally and slowly. The slower flux along minor veins is compensated by their far greater number, which results in them having a greater length per unit leaf area than major veins.
With a hand lens, you do not see the vessels, instead you see the sheaths that surround xylem and phloem, much as an endodermis surrounds vascular strands of a conifer needle. Grass leaf veins have two sheaths of cells surrounding the parallel veins and containing the xylem and phloem tissues. In the leaf anatomical development typical of C3 species (e.g. wheat), both sheaths are parenchymatous and lack chloroplasts (Figure 3.24).

Figure 3.24 Wheat leaf showing a single large (supply) vein comprising three large vessels (V). The vein is surrounded by two sheaths of living cells, the inner mestome sheath (arrowheads), and outer parenchyma sheath (stars). The mestome sheath of these veins is impermeable to water. Water enters the symplasm at the inner boundary of the parenchyma sheath (Canny 1990). Phloem (P). Transverse hand-section, Toluidine blue stain, bright-field optics. Scale bar, 0.1 mm. (Photograph courtesy M. McCully and M. Canny)
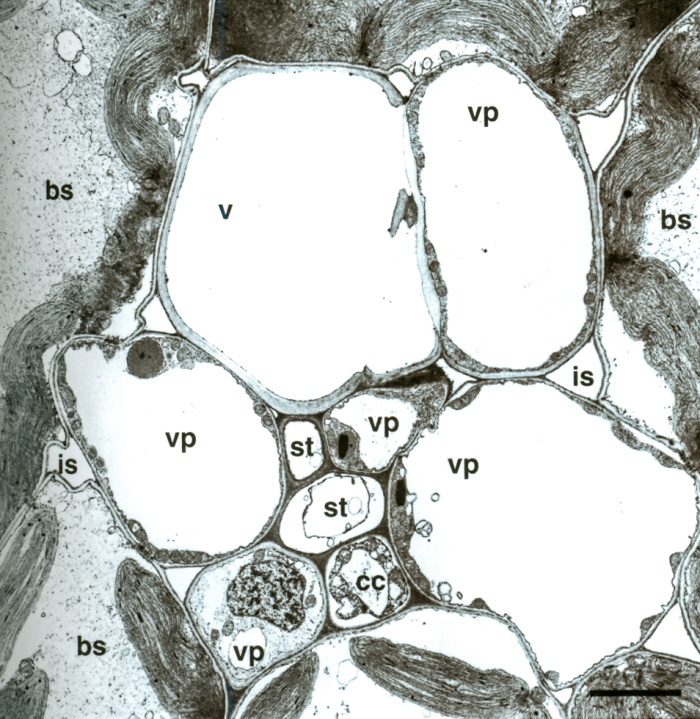
Figure 3.25 Minor vein of maize, consisting of one xylem vessel (v), five vascular parenchyma cells (vp), bundle sheath (bs), companion cell (cc), and sieve tube (st) with intercellular space (is). Scale bar, 4.2 µm. Transmission electron micrograph, R.F. Evert. (Reproduced from Planta 138: 279-294, 1978)
The large veins of a C3 species is surrounded by two sheaths of living cells, the inner mestome sheath and outer parenchyma sheath (Figure 3.24). The mestome sheath of these large veins is impermeable to water. There is no apoplastic path for water through the mestome sheath of large veins, except through a connecting transverse vein. In small veins, by contrast, two or three mestome sheath cells next to the xylem permit flow of water and solutes through the cell wall apoplasm.
In C4 species (e.g. maize), only the inner (mestome) sheath is without chloroplasts. The outer ring of sheath cells contains large chloroplasts and is known as the bundle sheath (Figure 3.25). This is the cell layer in which CO2 fixation in the Calvin cycle takes place in C4 plants. This is an essential part of the carbon concentrating mechanism, and the special anatomy of C4 photosynthesis, as detailed in Chapter 2, Section 2.2.2
A dicotyledonous leaf contains the same two vein systems as a grass leaf, but these are differently arranged. Large supply veins are prominent, comprising a midrib and two orders of branches off it, often standing out from the surface of the lamina. These contain wide vessels and carry water rapidly to the leaf margins. Between them lie distribution veins, another two branch orders of small veins dividing the mesophyll up into islets about 1–2 mm across (Figure 3.26), and within these islets a fifth and final order of branches of the finest veins. The fourth- and fifth-order branches have only narrow vessels (Figure 3.26).
In dicotyledenous leaves, as in grass leaves, these vascular tissues are enclosed by bundle sheath cells through which water and solutes must pass when leaving the xylem.
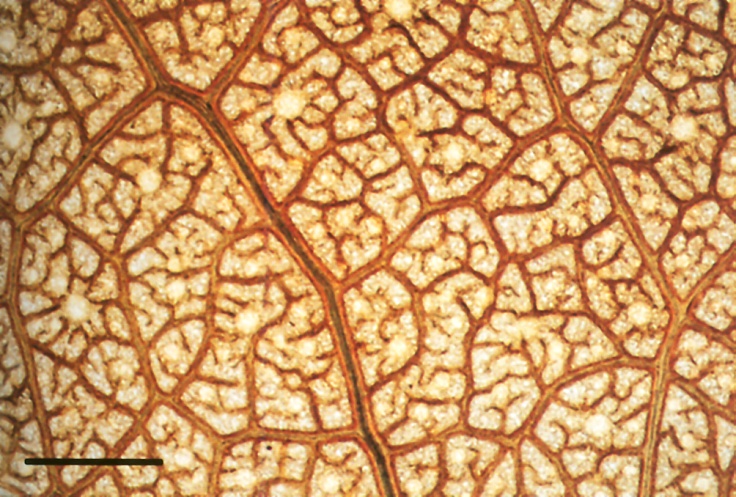
Figure 3.26 Whole mount of a cleared leaf of Eucalyptus crenulata showing the complicated arrangement of supply and distribution veins characteristic of a dicotyledonous leaf. Islands marked out by large veins with large vessels, in which water is moved rapidly all over the lamina, surround islets of small veins with small vessels in which water is slowly distributed locally to the mesophyll. Partial phase-contrast optics. Scale bar, 1 mm. (Photograph courtesy M. McCully and M. Canny)
Any distribution network such as the branching vessels of decreasing size in leaves is found to obey Murray’s Law. This states that the cube of the radius of a parent vessel is equal to the sum of cubes of the radii of the daughter vessels (e.g. a 50 µm vessel would branch into five 30 µm vessels). Such a pattern of branching produces optimal flow in several senses: minimum energy cost of driving that flow, minimum energy cost of maintaining the pipeline, constant shear stress at the walls of pipes, and rapid flow in supply pipes with slow flow in distributing pipes to permit exchange through the pipe walls (LaBarbera 1990).
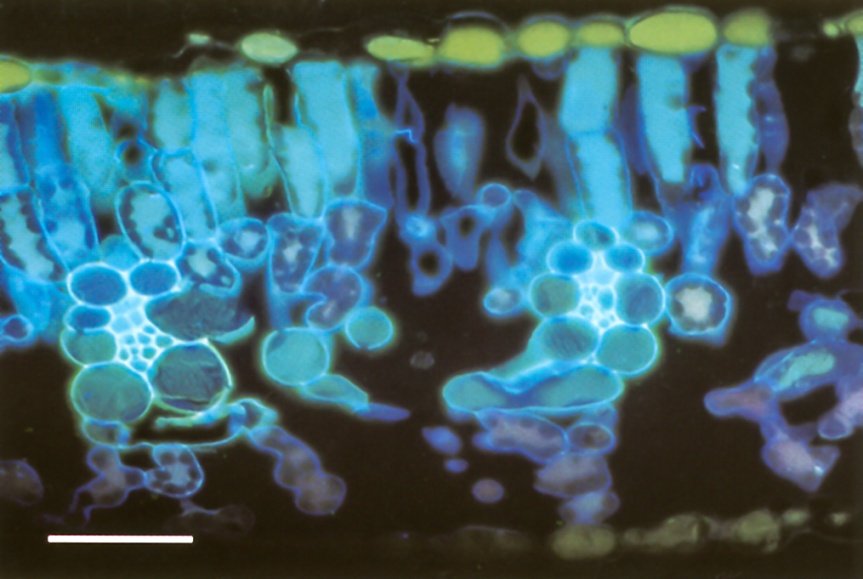
Figure 3.27 Soybean leaf showing two of the smallest veins surrounded by bundle sheath cells. Veins of this size are the end of the branching network shown in Figure 3.26, and supply most water that is evaporated. This leaf was transpiring in a solution of fluorescent dye for 40 min. The small vessels in each vein contain dye solution which has become concentrated by water loss to the symplasm and out through the bundle sheath. Dye has started to diffuse away from small vessels in the cell wall apoplasm of bundle sheath cells. Anhydrous freeze-substitution and sectioning, fluorescence optics. Scale bar, 50 µm. (Photograph courtesy M. McCully and M. Canny)
The ring of cells forming the sheath around the xylem and phloem tissue (Figure 3.27) acts both as a mechanical barrier that may confine pressure within the vein, and a permeability barrier that can control rates and places of entry and exit of materials. Exceptions are to be found at the ultimate ends of some dicotyledonous fine veins where tracheids or sieve elements may be unaccompanied by other cells, in the transverse veins of grasses which have no sheath, and in some special veins at leaf margins where the sheath is absent on the xylem side. There is evidence of a suberised layer in walls of these sheaths cells in some species, but not in others. It is uncertain whether xylem sap must traverse the cell membranes, as in the suberised endodermis of roots, or if it can travel along the cell walls.
Transpiration operates by suction, but leaves are especially liable to damage by grazing, mechanical forces, and extreme negative pressures in the xylem water column due to high rates of transpiration. Leaf vessels therefore need special protection against air embolisms spreading in the vessel network that would block liquid flow. This is achieved at all points in the leaf distal to the node (i.e. petiole, large veins, small veins) by the vessels being very short. That is, files of vessel elements joined to make a single pipe with a terminal end-wall are much shorter in the leaf than in the rest of the plant. Water flows through vessel end-walls with little extra resistance, but an air–water interface cannot be pulled through an end-wall or pit membrane because the pores are so small. The force needed to curve the interface into a meniscus small enough to pass through the end-wall is similar to that generated by evaporation from wet cell walls (Section 3.1.3). From equation (4), (DP = 0.15/r) we see that a pressure of roughly 0.3/d (MPa) is required to pull the interface through a hole of diameter d (µm). While 0.1 MPa can pull an interface through a 3 µm hole, 6 MPa is required to pull air through a 0.05 µm hole. Suctions of 6 MPa are not known to occur in transpiring plants, and cell walls have pores much smaller than 0.05 µm - in the order of 0.003 µm. So an embolism formed from cavitating water fills one vessel but does not spread beyond it.
The length of xylem vessels is demonstrated by allowing a leaf to transpire in a fine colloidal suspension that cannot pass end-walls. Latex paint, diluted 100 times with water and allowed to settle for a week or two, provides such a suspension. Leaves that have drawn up this suspension for an hour or so during transpiration can be cleared by dissolving out the chlorophyll and soaking in lactic acid. Progress of the paint is then readily seen (Figure 3.28). Very few vessels exceed 1 cm in length.

Figure 3.28 Cleared whole mount of a wheat leaf demonstrating the frequent occurrence of end-walls in leaf vessels. The leaf was fed an emulsion of green latex paint in the transpiration fluid from a cut surface 6.5 mm to the right of the picture. At the right side of the picture, two vessels in the central large vein are carrying paint. Halfway across the picture (at arrowhead) the upper vessel is blocked by an end-wall through which the paint particles could not pass, although water continued to flow. The paint in the lower vessel continued for another 3 mm beyond the left of the picture, where an end-wall in that vessel limited its further progress. Note that paint has not passed out of the large vein into transverse veins where water flowed because pit membranes (Section 3.2) filtered out paint particles. Bright-field optics. Scale bar, 100 µm. (Photograph courtesy M. McCully and M. Canny)
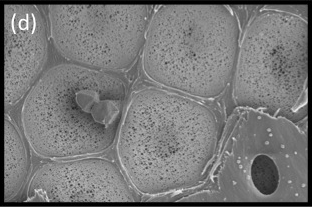
Figure 3.11d SEM showing surface view of the pit membrane with secondary wall removed from most pits by sectioning. Tiny pores allow the movement of water between vessels but limit the movement of gas and pathogens. Bordered pits act as the safety valves of the plant hydraulic system. (Photograph courtesy B Choat and S Jansen)
Xylem vessels (and tracheids) are not just pipes to carry water, they are pipes with holes in them (pits) through which water can leak out, fulfilling a principal leaf function of water distribution through the transpiration stream to places where it will evaporate. The branching network of vessels is beautifully adapted to achieve this.
Think about flow in a leaky vessel. As explained earlier, the rate of volume flow varies as the fourth power of the radius (Poiseuille’s Law). The frequency of leaks through vessel walls varies with surface area of the walls, that is, as the first power of the radius (2πr). So if the vessel is wide, forward flow is much larger than leakage. The wide vessels in large veins supply water all over the leaf without losing much on the way. As the width of a vessel becomes smaller, the forward flow (a function of r4) is reduced much more strongly than the leaks (a function of r). The proportion of water lost to leakage therefore increases as vessels become smaller. Indeed, for a fixed pressure gradient there is a critical radius at which all water entering the vessels supplies leaks, and there is no forward flow at all. The finest veins of dicotyledenous leaves have vessels of a radius that is close to this critical value. As sap disperses into the fine ramifications of the network, it moves more and more slowly forward, and leaks increasingly outwards through the sheath to the mesophyll. This is the rationale of the distributing networks of the small branched veins of both dicotyledons and grasses.
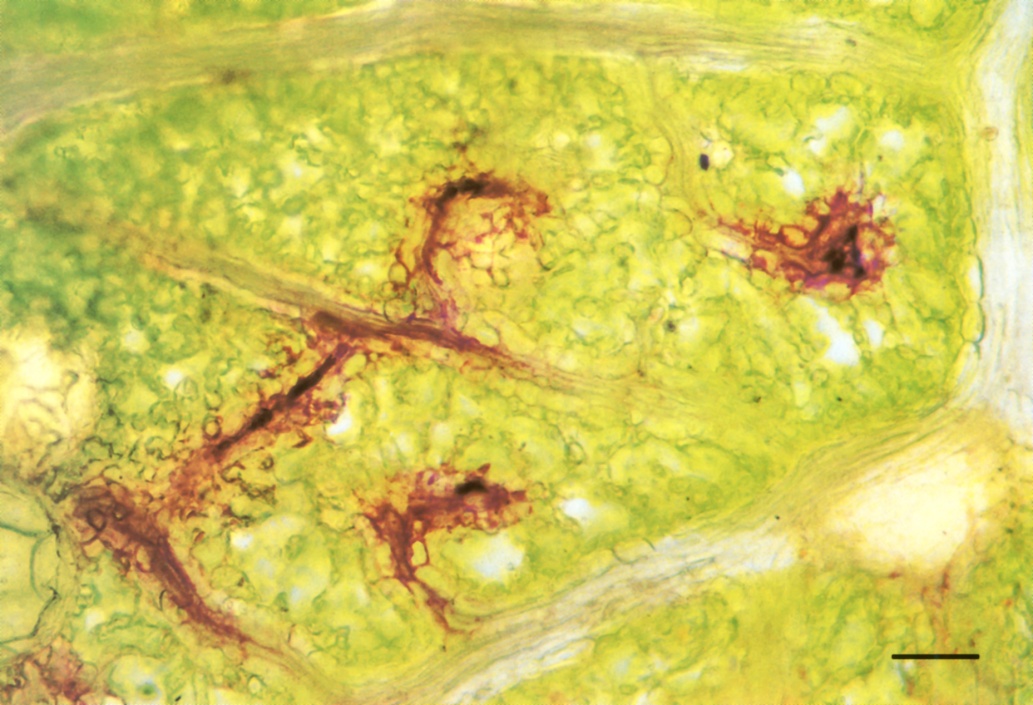
Figure 3.29 Fresh paradermal hand-section of a leaf of Eucalyptus crenulata which had been transpiring for 80 min in a solution of sulphorhodamine G. The dye solution is present at low concentration in the vessels of the larger veins, but is not visible at that concentration. In the smallest veins the dye has become so concentrated by loss of water to the symplasm that dye crystals have formed inside vessels. Sectioned in oil, bright-field optics. Scale bar, 100 µm. (Photograph courtesy M. McCully and M. Canny)
Extraction of water from fine veins can be readily demonstrated. Stand a cut leaf in an aqueous solution of dye, such as 0.1% sulphorhodamine G, and allow it to transpire for an hour. The solution moves rapidly through large veins all over the leaf in a few minutes. Then it moves increasingly slowly into the network of distributing small veins. By the end of an hour it has reached the ends of the finest veins and, as water is extracted from them, the dye becomes more and more concentrated (Figure 3.29). Movement of dyes from the finest veins to leaf surfaces 100 µm away takes about 30 min, suggesting that diffusion rather than mass flow is responsible for solute distribution to cells.
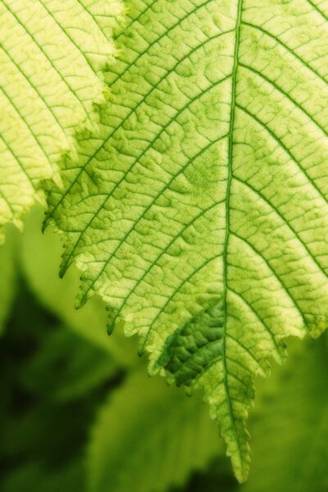
Figure 3.33 Leaf of horse chestnut, Aesculus hippocastanum, showing as with all strongly-toothed leaves, conspicuous veins running to each tooth. (Photograph courtesy M. Waters)
Potassium is known to be extracted from the xylem and re-exported via the phloem (Section 5.1). In leaves, the concentrated sap flowing through the narrow xylem vessels of fine veins is separated from sieve tubes of the phloem by only two or three parenchyma cells, frequently enhanced by transfer cells. Exchange from xylem to phloem is probably made by this direct path. Solutes travel in the phloem back to stems, either distally to younger developing leaves and the stem apex or proximally towards roots.
Recycling of solutes out of leaves can also be fed by a variety of special structures adapted for processing rather larger volumes of sap, and so suited for collecting solutes present in the stream at quite low concentrations. The transfusion tissue of conifer needles is one of these structures. As sap leaves the xylem of a vascular strand it moves through a bed of tracheids mixed intimately with transfusion parenchyma cells (Figure 3.22 shown earlier). The endodermis acts as the ultrafiltration barrier, allowing water to pass through while leaving dilute solutes to accumulate in transfusion tracheids. Transfusion parenchyma cells have very active H+-ATPases in their cell membranes which accumulate selected solutes (certainly some amino acids) back into the symplasm for return to the phloem and re-export. Such actively accumulating cells are called scavenging cells.
A tissue that acts in the same way is a special layer of cells in the central plane of many legume leaves (extended bundle sheath system or paraveinal mesophyll). It consists of scavenging cells with active H+-ATPases and accumulates amino acids, stores them and forwards them to developing seeds via the phloem.
Jagged ‘teeth’ on the margins of many leaves also contain scavenging cells (Figure 3.33). Veins carry large volumes of the xylem sap to these points, where evaporation is especially rapid. Within a ‘tooth’, xylem strands end in a spray of small vessels among a bed of scavenging cells. Scavenging cells can thereby collect amino acids and load them into the phloem.
Not all the solutes of the transpiration stream are welcome back in the plant body. Some, such as calcium, are immobilised in insoluble compounds (calcium oxalate crystals) and shed when leaves fall. Others are excreted through the surface of living leaves. A striking excretion system is found along the margin of maize leaves. Here the outermost vein has a single very wide vessel. Rapid evaporation from the exposed leaf edge cooperates with this low-resistance vessel to draw to the leaf margin all residual solutes that have not been taken out of the stream by other veins. Thus foreign material (like dyes) accumulates in this outermost vessel. The vein sheath is missing from the outer part of this vein so that vessels abut directly the airspace at leaf margins (Canny 1990). Solutes are excreted from this marginal vein, dissolved out by rain and dew, and, more actively, at night time by guttation fluid when there is positive pressure in the xylem. A similar accumulation of dye from the transpiration stream is shown along the margin of a eucalyptus leaf in Figure 3.34.
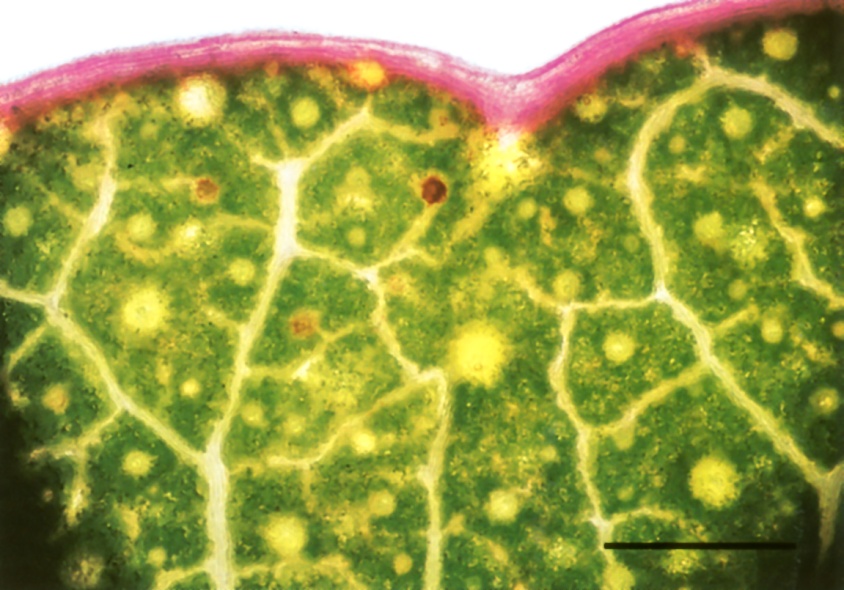
Figure 3.34 Whole mount of the living margin of the eucalypt leaf sectioned in Figure 3.11 prepared after dye had been fed to the cut petiole for 90 min. Dye has spread to the leaf margin in large veins where it accumulates at high concentrations. By analogy with maize leaves (Canny 1990) this is likely to be a system for excreting unwanted solutes. Bright-field optics. Scale bar, 1 mm. (Photograph courtesy M. McCully and M. Canny)
Plants lose water by evaporation through their leaves to the atmosphere. The loss is made good by water flowing from the soil into the roots, and thence within the xylem to the leaves. The factors that provide resistances to the flow of water from soil to root are set by the nature of the soil, the proliferation of roots within it, and the contact between the soil and the root. Root system architecture and the proliferation of lateral roots are covered in the following chapter, section 4.1.
Water removed by transpiration results in drier soil around roots compared with bulk soil. This provides the gradient in suction necessary for water flow towards roots to continue. As soil dries near the root surface, water flows radially from bulk soil to replenish it. When the bulk soil becomes drier, greater suctions are necessary to sustain the flow. The next section describes the capacity of different types of soils to hold water when wet, and release it to plants as they dry. It explains the terms field capacity and permanent wilting point. Following sections quantify the uptake of water by roots, and describe a major barrier to water uptake – the soil:root interface.
Water drains through soil due to gravity, leaving medium-sized pores still filled with water, and with thin films around soil particles. Soil is porous and holds water in its pores by capillary forces. As a soil dries, the larger pores drain and the remaining pores hold water ever more tenaciously. Water in these pores is under suction (negative hydrostatic pressure, P) and this suction typically ranges from about 10 kPa to about 1.5 MPa in soils supplying water to plants. At suctions of less than 10 kPa, water is held in such large pores that it is likely to drain quickly away; at suctions greater than 1.5 MPa, most plants are at their limit for exerting sufficient suction to extract the water.
When substantial rain falls on a freely draining soil, it may fill all the pores, even to the point of run-off. Thereafter, water quickly drains out of the largest pores under the influence of gravity into the drier soil below. This process of redistribution continues for days, even weeks, but it does so ever more slowly as the remaining largest pores continue to drain. During this time the hydraulic conductivity of the soil falls by several orders of magnitude because the resistance to viscous flow through water-filled pores depends inversely on the 4th power of their diameter.
After about 2 days of redistribution, the rate of drainage typically drops to only a few mm per day, which in the field is similar to other forms of water loss from the soil: uptake by roots, or evaporation from the soil surface. At this point there will be a suction (negative pressure) in the soil water of somewhere between 10 and 30 kPa, and the water content then is known as “field capacity” or “drained upper limit”.
Soil scientists classify soils according to particle size as:
| Gravel: | > 2 mm |
| Sand: | 0.05 – 2 mm |
| Silt: | 0.002 – 0.05 mm |
| Clay: | < 0.002 mm (2 µm) |
The structure and texture of the soil determines how much water can be held in it. Sand particles are large (50 mm - 2 mm) and hold onto little water, but a sandy soil provides good aeration. Sand holds little water because the pores between the grains are large. Therefore, its field capacity, the amount of water in the soil remaining a day or two after irrigation, can be as low as 10% (weight per volume; or 10 mL water per 100 mL soil volume).
Clay particles are much smaller (less than 2 mm) and easily compacted. That makes clay a good material for building bricks, but not so good for allowing water, air, and plant roots through. Clay particles have stacked platelets which provide large amounts of surface area. Clay soils store large amounts of water and have a field capacity above 40%, though much of that may be in pores too small for plants to extract water, as shown in the table below.
Silt is the medium size particle (2-50 mm), with better water retention than sand, but less nutrients than clay. Loam is a soil comprised of roughly equal amounts of sand and silt and a little less clay.
Different types of soil are comprised of various proportions of these particle sizes, as illustrated in Figure 3.37.
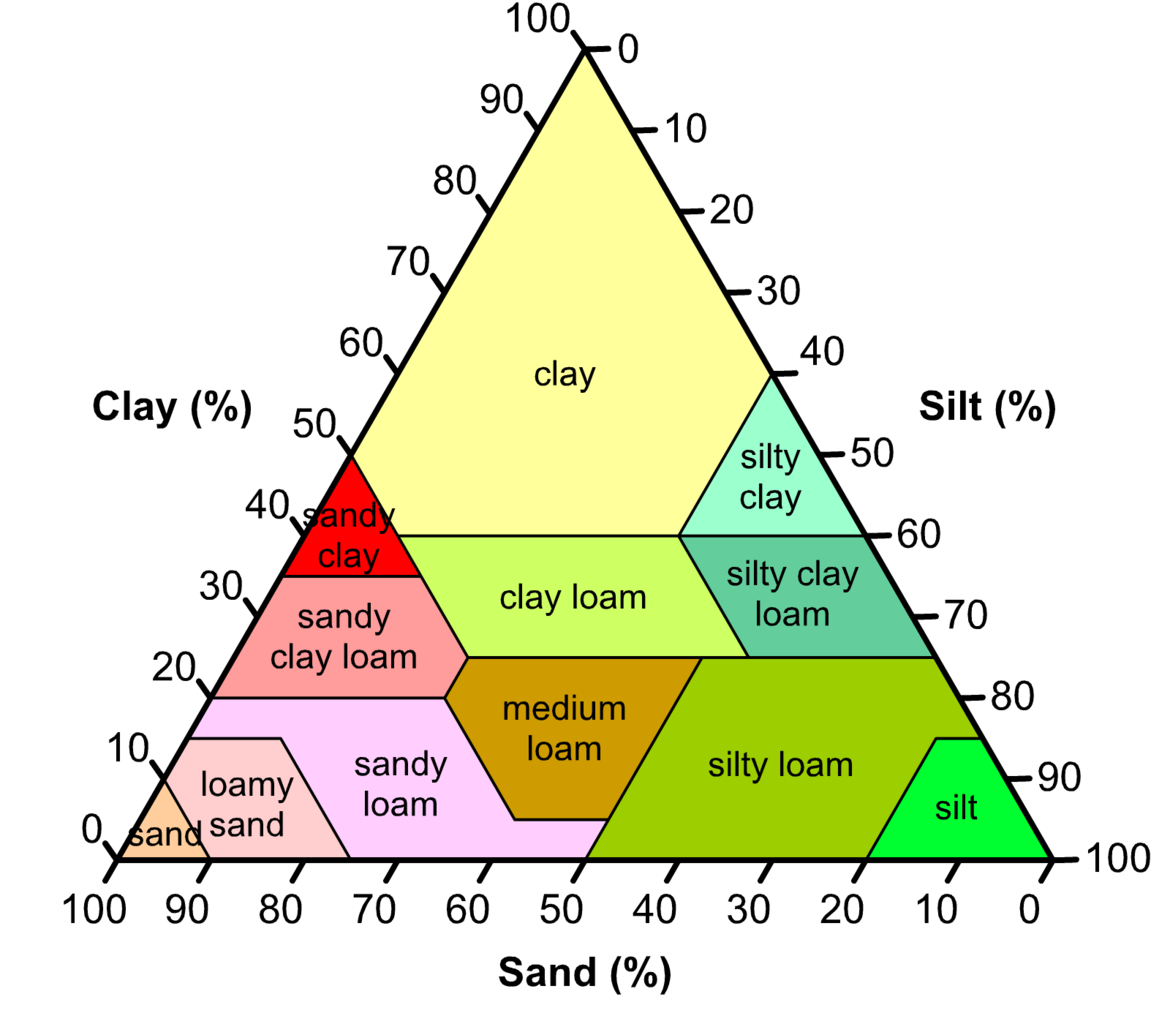
Figure 3.37 Textural classification of soils. Loam is a soil comprised of roughly equal amounts of sand and silt and a little less clay. http://imgkid.com/soil-texture-triangle.shtml
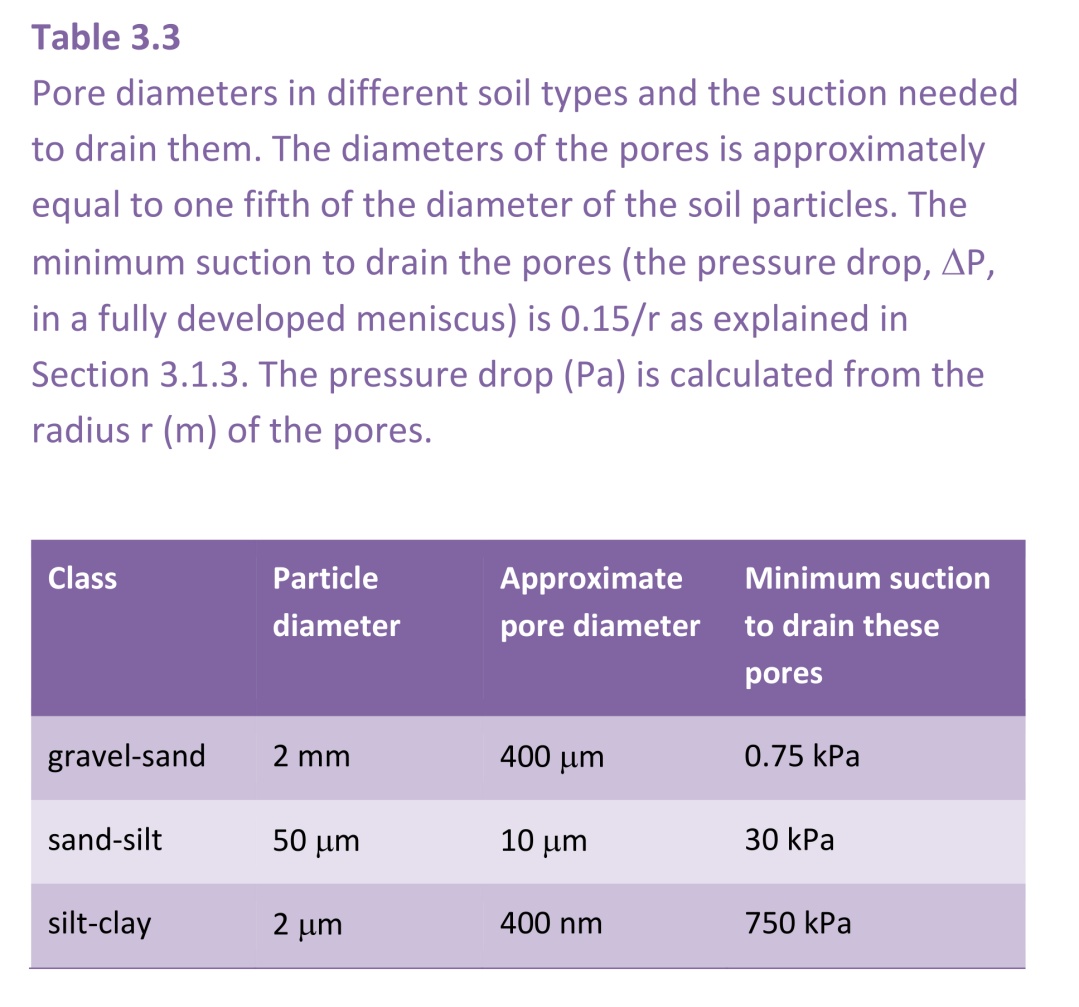
The diameter of pores in soil is roughly equal to one fifth of the diameter of the soil particles. Thus, at the boundaries between these classes, the approximate diameters of the pores would be as shown in Table 3.3 with the suction needed to drain them.
This table shows that many pores in a gravelly soil would drain at a suction of only about 1 kPa, but that a clay soil would need ten times this suction, close to 1 MPa, to drain many pores. Transpirational pull by plants can provide suctions above this, but there is a limit at which plants can maintain suction without the risk of embolism.
This term is used by crop physiologists, and often called the “lower limit of water extraction” by agronomists and crop modellers. When the water content of a soil is below the wilting point, plants have difficulty accessing it, as they cannot generate a sufficiently low water potential. In practice, this critical water potential has been found to be about -1.5 MPa, which effectively marks the lower limit of the available soil water.
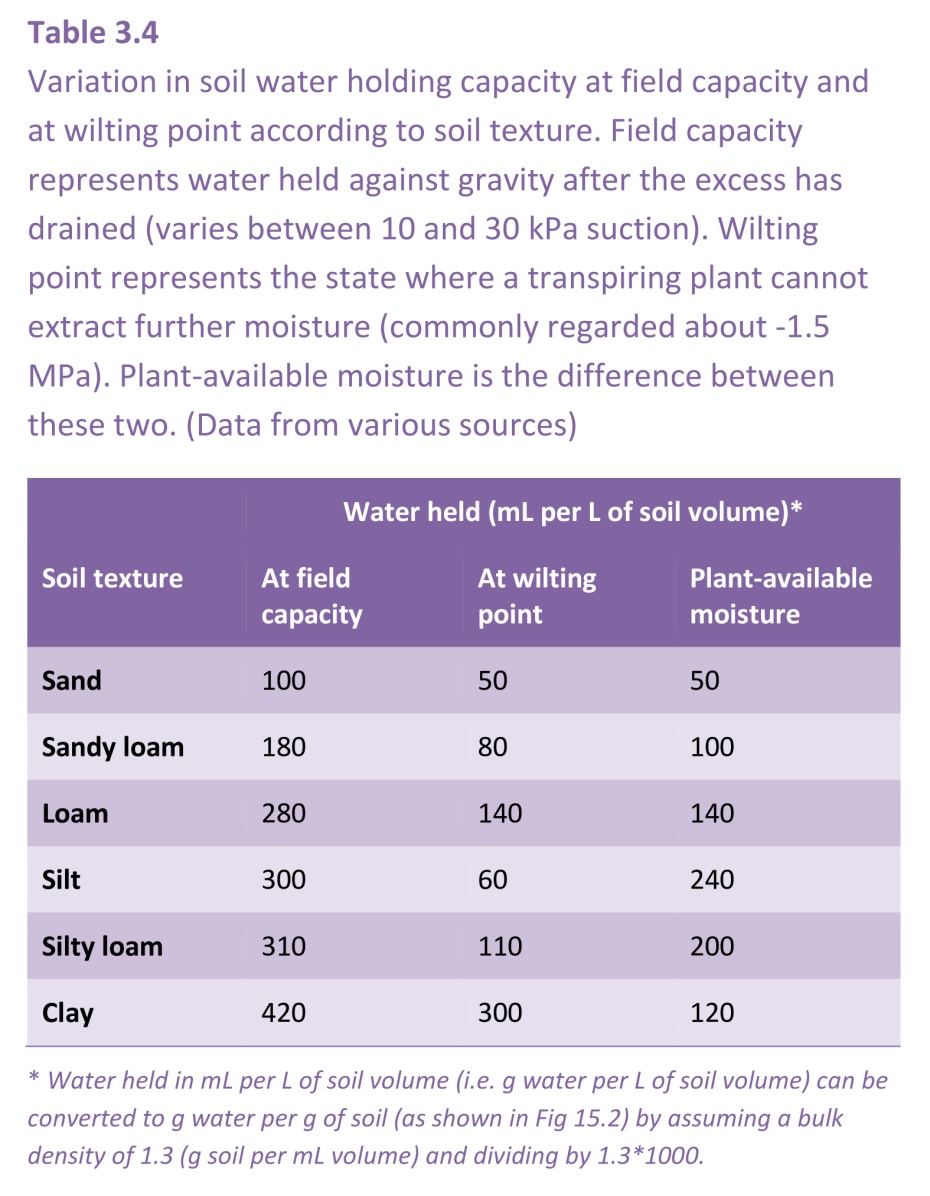
Soil at wilting point is not dry. Different soil types hold very different amounts of moisture at their wilting points. As plant remove water and the soil starts to dry, the small pores make it difficult for roots to extract all the water, so clay soils hang onto their water more strongly than sandy or loamy soils, and results in the plant available water being less for clay soils than for loamy soils which have a lower clay content (Table 3.4). Silt contains pore sizes intermediate to clay and sand, and makes up about 50% of the composition of loamy soils (Figure 3.37) and give it the favourable property of retaining more water than sand as the soil but releasing it more easily than clay.

Figure 3.38 Clay soils are fine textured and have a greater water-holding capacity than do sandy soils that are composed of larger particles. Clay soils hold a greater amount of plant-available water between field capacity (Ψsoil about -0.02 MPa) and wilting point (Ψsoil about -1.5 MPa) than do sandy soils. In both situations, water is held with progressively stronger forces as the soil mass dries out. (R O. Slatyer and I.C McIlroy, 1961).
The relationship between soil water content and soil water potential (Ψsoil) is shown in Figure 3.38 for the three different soil types. Water is held with progressively stronger suctions as the soil dries, and at the permanent wilting point of -1.5 MPa clay soils retain much more water than sands or sandy loams that is not available to plants.
Another feature of clay soils that makes them less desirable for agriculture or horticulture is that root length density (length of roots per unit volume of soil) tends to be lower than in the lighter textured loamy and sandy soils. Despite their substantial moisture reserves, fine-textured clay soils are generally less hospitable to plant roots than loamy or sandy soils. As a result, plant-extractable moisture in clay soils is somewhat less than the soil’s physical properties alone would imply.
Field capacity is not a term relevant to pot experiments, unless they are very tall. After irrigation, a drained pot will contain much more water than soil in the field.
The soil at the bottom of a freshly watered and drained pot is inevitably saturated with water; if the pot is short the whole of the medium may have such little air-filled porosity that it becomes hypoxic. This is a special problem with field soils used in pots, for these typically do not contain many pores large enough to be drained at the small water suctions that prevail. Such suctions are zero at the bottom of a freshly drained pot and rise by 1 kPa for every 100 mm increment in height, leading to suctions at the top of a typical pot that are much less than the 10–30 kPa that occurs in soils in the field that have drained to ‘field capacity’ (Passioura 2006).
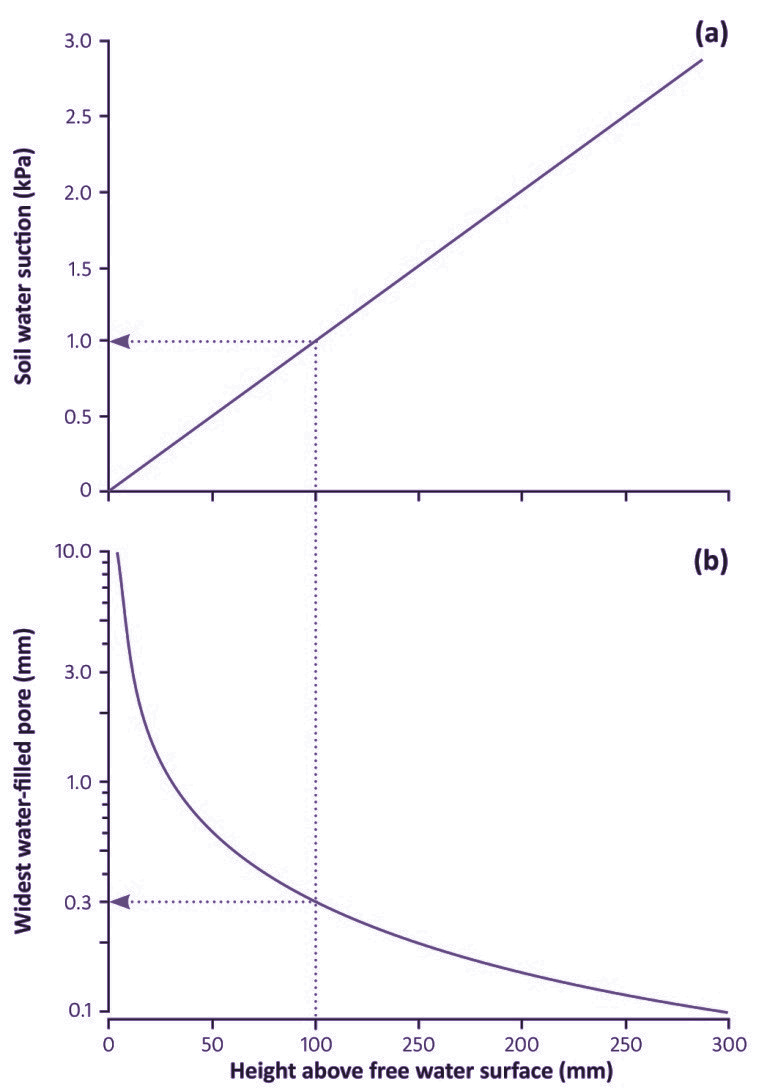
Figure 3.39 The relationships, at equilibrium, between soil water suction (a), effective diameter of largest water-filled pores (b), and height above a free water surface, such as a water table within the soil or the bottom of a recently drained pot. The dotted lines exemplify conditions at a height of 100 mm. (J.B. Passioura, Funct Plant Biol 33: 1075–1079, 2006)
When a pot has finished draining, the soil at the bottom is saturated: it has zero water suction. The suction varies linearly with height, as illustrated in Fig. 3.39, from zero at the bottom of the pot, to 10 H Pa, where H is the height of the pot in mm. Thus, a freshly watered and drained pot that is 100 mm high has a water suction at its top of 1 kPa, very much less than the 10–30 kPa that occurs in a freshly watered and drained soil in the field. Similarly, a pot that is 200 mm high has a suction of 2 kPa at the top. Thus the average suction and thence average soil water content of a freshly watered and drained pot depends on its height.
It is worth noting that the size and number of drainage holes in the bottom of the pot have no bearing on the distribution of suction with height at equilibrium. The rate at which equilibrium is attained will also depend little on the number and size of the drainage holes — just one hole of a few mm diameter is adequate.
The implication of these small suctions is that much larger pores contain water than in a drained soil in the field. For example, at the top of a pot that is 100mmhigh, and where the suction is 1 kPa, all pores less than 0.3 mm wide will contain water. This contrasts greatly with the field soil, in which the suction will be at least 10 kPa and the diameter of the largest water-filled pore will be 0.03 mm or even less.
This has considerable implications for doing pot experiments on the availability of soil water to plants using field soils. Standard watering techniques, which result in adding excess water that then drains from pots, lead to initial soil water contents that are much more than they would be in the freshly drained soil in the field. To match what happens in the field, it would be necessary to water the pots by weight to reproduce a water content consistent with a suction somewhere between 10 and 30 kPa. Further, the large initial water content can produce problems with aeration.
The plant nursery industry is well aware of the difficulties in adequately aerating pots. That is why their potting mixes contain peat or vermiculite or other bulky materials that create large pores of 1mm or more in diameter, which contain air at heights greater than 30mm above the bottom of a freshly drained pot. These large pores protect the roots from hypoxia in a material that might otherwise have a dangerously small air-filled porosity. Nevertheless, despite these large air-filled pores giving the roots growing in them access to oxygen, the interior of aggregates in the soil or potting mix will still be essentially saturated and possibly hypoxic.
Data for three different types of potting mix are shown in Figure 3.29: horticultural topsoil, commercial potting mix is designed for growing plants for sale in garden nurseries, and fine potting mix designed for growing Arabidopsis thaliana in small pots. The topsoil is the worst aerated, with the bottom 150mm of a freshly drained pot in danger of becoming hypoxic. It is notable that in the small pots (70 mm tall) often used for growing Arabidopsis, all of the medium is in danger of becoming hypoxic, for the porosity ranges from 0 to only 7%within the pot (Figure 3.40). With a frequent watering regime, say twice daily, the medium could be permanently hypoxic. Commercial potting mixes overcome this problem by using coarse materials in the mix, which create many large pores (>1 mm diameter) that drain at small suctions.
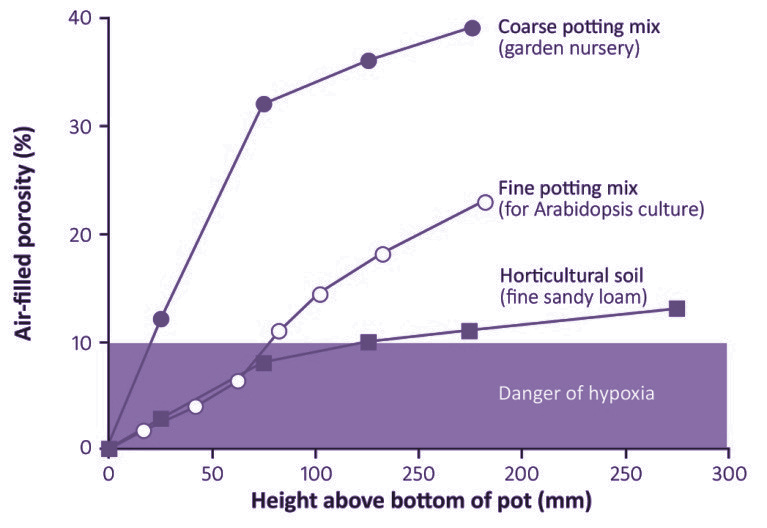
Figure 3.40 Air-filled porosity of three examples of potting media as functions of height above a free water surface such as the bottom of a freshly drained pot. There is danger of hypoxia at air-filled porosities less than 10%. (J.B. Passioura, Funct Plant Biol 33: 1075–1079, 2006)
Field capacity should therefore not be confused with the water content of a drained pot, which should be called “pot capacity”.
Flow of water through soil is induced by gradients in hydrostatic pressure, P. The rate of flow, F (m s–1), depends on both the gradient in P and on hydraulic conductivity, K (m2 MPa–1 s–1), of the soil:
\[F=K \frac{dP}{dx} \tag{8}\]
where x (m) is distance. This equation is Darcy’s Law. Conductivity, K, varies enormously, by about a thousand-fold, over the range of available water content. The reason for this large range is that water flows much more easily in a large pore than in a small one. As explained earlier (Section 3.1), the flow rate varies according to Poiseuille’s Law — the flow in capillary tubes depends on the fourth power of the diameter. As the soil dries, the large pores are empty and water is drawn from smaller and smaller pores.
Water removed by transpiration results in drier soil around roots compared with bulk soil. As soil dries near the root surface, water flows radially from bulk soil to replenish it. Calculated distributions of water content and pore water pressure with radial distance from an absorbing root predict a pronounced increase in suction adjacent to the root.
Roots are cylindrical, so the flow of water to them is radial. This has considerable consequences: the flow lines converge as they approach the root, which requires increasing gradients of pressure in the soil water to keep the water flowing (Figure 3.41).
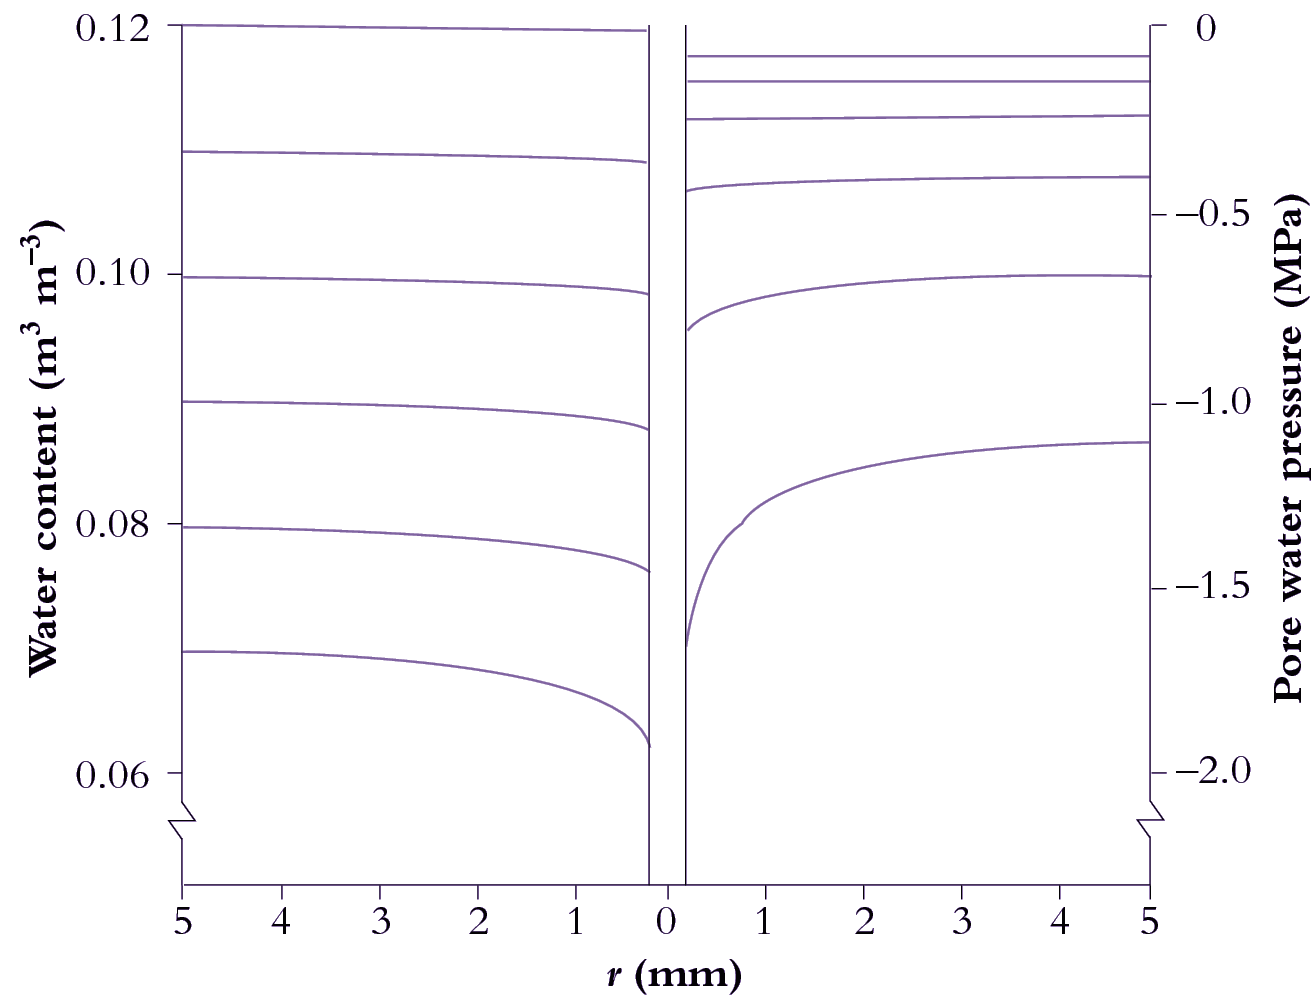
Figure 3.41 Calculated distributions of volumetric soil water content (left) and pressure in water-filled pores (right) as functions of distance from a model root. Pressures become more negative over time, indicating increasing suction. Horizontal lines denote water status on each of six successive days (day 1 is uppermost). The steepening of curves at later times reflects how transport of water from bulk soil to the root surface becomes increasingly difficult as the soil dries. r = distance from central axis of root.
A radial flow of water from the bulk soil towards roots of transpiring plants is generated by suction at the root surface. However, because K decreases with falling water content, there is a limit to how fast roots can extract water from soil. Once this limit has been reached, increasing suction by roots simply steepens the gradient in P to match the fall in K close to root surfaces so that the product of the two (Equation 3.1) remains the same.
Although soil water is driven by gradients of pressure, it is necessary when water content is changing to describe this flow in terms of gradients in volumetric water content, θ (m3 m–3). The coefficient relating flow rate to the gradient in water content is known as diffusivity, D (m2 s–1), and the appropriate equation is formally analogous to Fick’s First Law of diffusion:
\[F=D \frac{d\theta}{dx} \tag{9}\]
This equation can be elaborated to allow for the cylindrical flow, and then solved to derive an approximate relationship for the uptake of water by a population of roots:
\[Q \approx 2D*\Delta \theta * L \tag{10}\]
where Q is the flow rate of water through the soil, (m3 m–3 s–1), now expressed as the overall rate of change of θ in the sample soil, and L is the rooting density, average length of absorbing root per unit volume of soil (m m–3).
Like K, D varies with the soil water content, although not so widely. Laboratory measurements of D, which are so far the only ones that have been made with some accuracy, show that D is about 10-7 m2s-1 when the soil is fairly wet, and falls to about 10-9 m2s-1 once the soil has dried far enough for the soil water suction to exceed about 300 kPa. Where D is of the order of 10-9 m2 s-1 one can calculate from eqn 3.3 that wherever the density of roots exceeds about 1 cm per cm3 of soil (104 m m-3) the flow of water through the soil is not likely to limit uptake until there is almost no available water left in the soil. But where there is less than about 1 mm of root per cm3 (103 m m-3) of soil, uptake is likely to be sufficiently limited by flow through the soil that it would take several days for the roots to extract most of the available water.
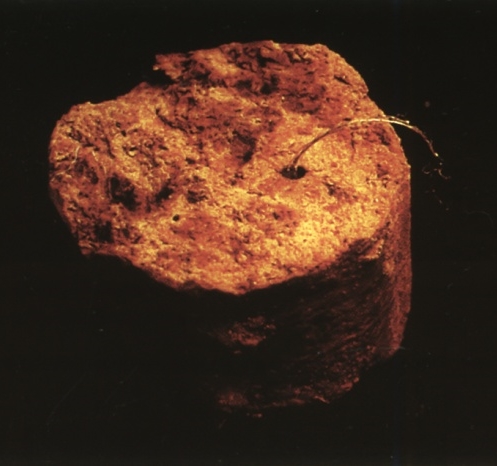
Figure 3.42 Sample of dense subsoil containing a biopore occupied by a root. Such biopores are passages for roots through otherwise almost impenetrably dense soil.
Many experiments have been done to explore this theory, with mixed results. Most have involved growing plants in repacked soil in controlled laboratory conditions. Some have confirmed the theory, many have not. The most likely reasons for the discrepancies is that interfacial effects - at the junction between the surface of the root and the soil - come into play. These are discussed in the next section.
In field soil, the concentration of roots in the topsoil is usually so high that the local rate of uptake of water is unlikely to be ever limited by the properties of the soil. It is in the subsoil that the rooting density drops to a level at which flow through the soil may limit the rate of uptake. Further, the rate of uptake is often much lower than what the simple theory would predict, even when the often sparse rooting density is taking into account.
In subsoil, there are other possible reason for the discrepancy between theory and observation. One is that, in contrast to disturbed soil, either in ploughed topsoil or repacked in lab experiments, roots in the subsoil do not ramify more or less randomly through the soil. Subsoils are usually dense and difficult to penetrate. Roots grow predominantly in pre-existing fissures or in continuous large pores, biopores, made by previous roots or soil fauna (Figure 3.42).
A second reason is that it may be wrong to extrapolate laboratory measurements of D in repacked soil to undisturbed soil in the field. The undisturbed structure of the soil may inhibit the flow of water. For example, the formation of aggregates of particles in the soil often results in particles of clay (which are usually in the form of small plates) becoming oriented parallel to the surface. Such orientation is likely to increase greatly the flow path for the water, but so far no reliable measurements of D have been yet made on undisturbed subsoil.
In summary, the dense root systems common in topsoils extract water effectively from surface soil layers. Extracting water from subsoil layers is more difficult. Australian subsoils are typically inhospitable to roots. They are dense, have a large resistance to penetration. They are often sodic, that is, sodium dominates the exchange complexes on soil particles, altering the soil structure so that it sets like concrete when dry, and becomes impermeable to water when wet. Moreover, subsoils can be acutely deficient in some nutrients that are required locally by roots. Native vegetation overcomes these difficulties by forming deep biopores in the subsoil. For example, roots of jarrah trees can create and maintain a path to water deep in the subsoil, possibly even as far as a water table 20 m below the surface.
The junction between root and soil is more than just two surfaces touching. It is often marked by a mucilaginous layer, rich in bacteria and fungi, that may be a few hundred micrometres thick, and in which adjacent soil particles are half or even wholly embedded. This is called the rhizosphere (Chapter 4). The hydraulic conductivity of this layer is not known, but there are two properties of this interfacial zone that may influence the flow of water across it. The first is that extensive gaps may occur within it, which strongly impede the flow. The second is that any exclusion of ions from the soil solution may result in large increases in the concentrations of these ions at the surface of the roots and this, because of the osmotic effects, would also impede the flow of water.
Water usually flows from soil to root as liquid, carrying with it dissolved nutrients. But there may be times when the hydraulic continuity between root and soil is so poor that a substantial proportion of the flow of water is as vapour. So far, nobody has managed to measure such flows, or even the relative importance of liquid and vapour flow, but their possible importance can be appreciated with the help of a few calculations.
The flow of vapour through soil is by diffusion, in contrast to that of liquid water, which moves in bulk. The consequence of this, and the fact that the vapour pressure of water is close to saturated in moist soil so that gradients in it are slight, is that water flows as vapour many times more slowly, in response to a given difference in water potential, than it does as liquid.
There are two main reasons why a root may be in poor hydraulic contact with the soil. The first is that it may be growing in a pre-existing pore larger than itself, so that it makes only glancing contact with the wall of the pore (see Figure 3.42 above). The second is that it has shrunk within a pore that it had itself made and which it had previously fitted snugly. What would induce a root to shrink? A fall in the water potential of the cortex would do so, for the cells there are thin-walled and separated in part by intercellular gas spaces, so they are likely to buckle. Observations made in rhizotrons (glass-walled tunnels for observing the behaviour of roots in the field) clearly show a diurnal shrinkage in cotton roots of up to 40% where the roots are growing in large pores, but we still do not know, because they are so difficult to observe, whether roots growing in intimate contact with the soil are similarly prone to shrink. A few observations made using neutron autoradiography have shown no shrinkage in roots growing in the field.
Because of the small size of the interfacial zone, it is very difficult to measure concentrations of ions within it. Rough estimates have been made by carefully separating the roots from the bulk of the soil, leaving only tenacious soil attached, then shaking off this remaining soil and analysing it. Such analyses do show somewhat higher concentrations (compared with those in the bulk soil) of ions such as sodium that we would expect to be largely excluded by the roots. But because the gradients in concentration are likely to be very large close to the root, these analyses are hard to assess for their consequences on the water relations of the plant. The gradients are likely to be especially large when the soil is becoming fairly dry, for the diffusion coefficient for the solutes falls by a few orders of magnitude as the soil dries, so that any excluded solutes will diffuse away from the root surface only very slowly.
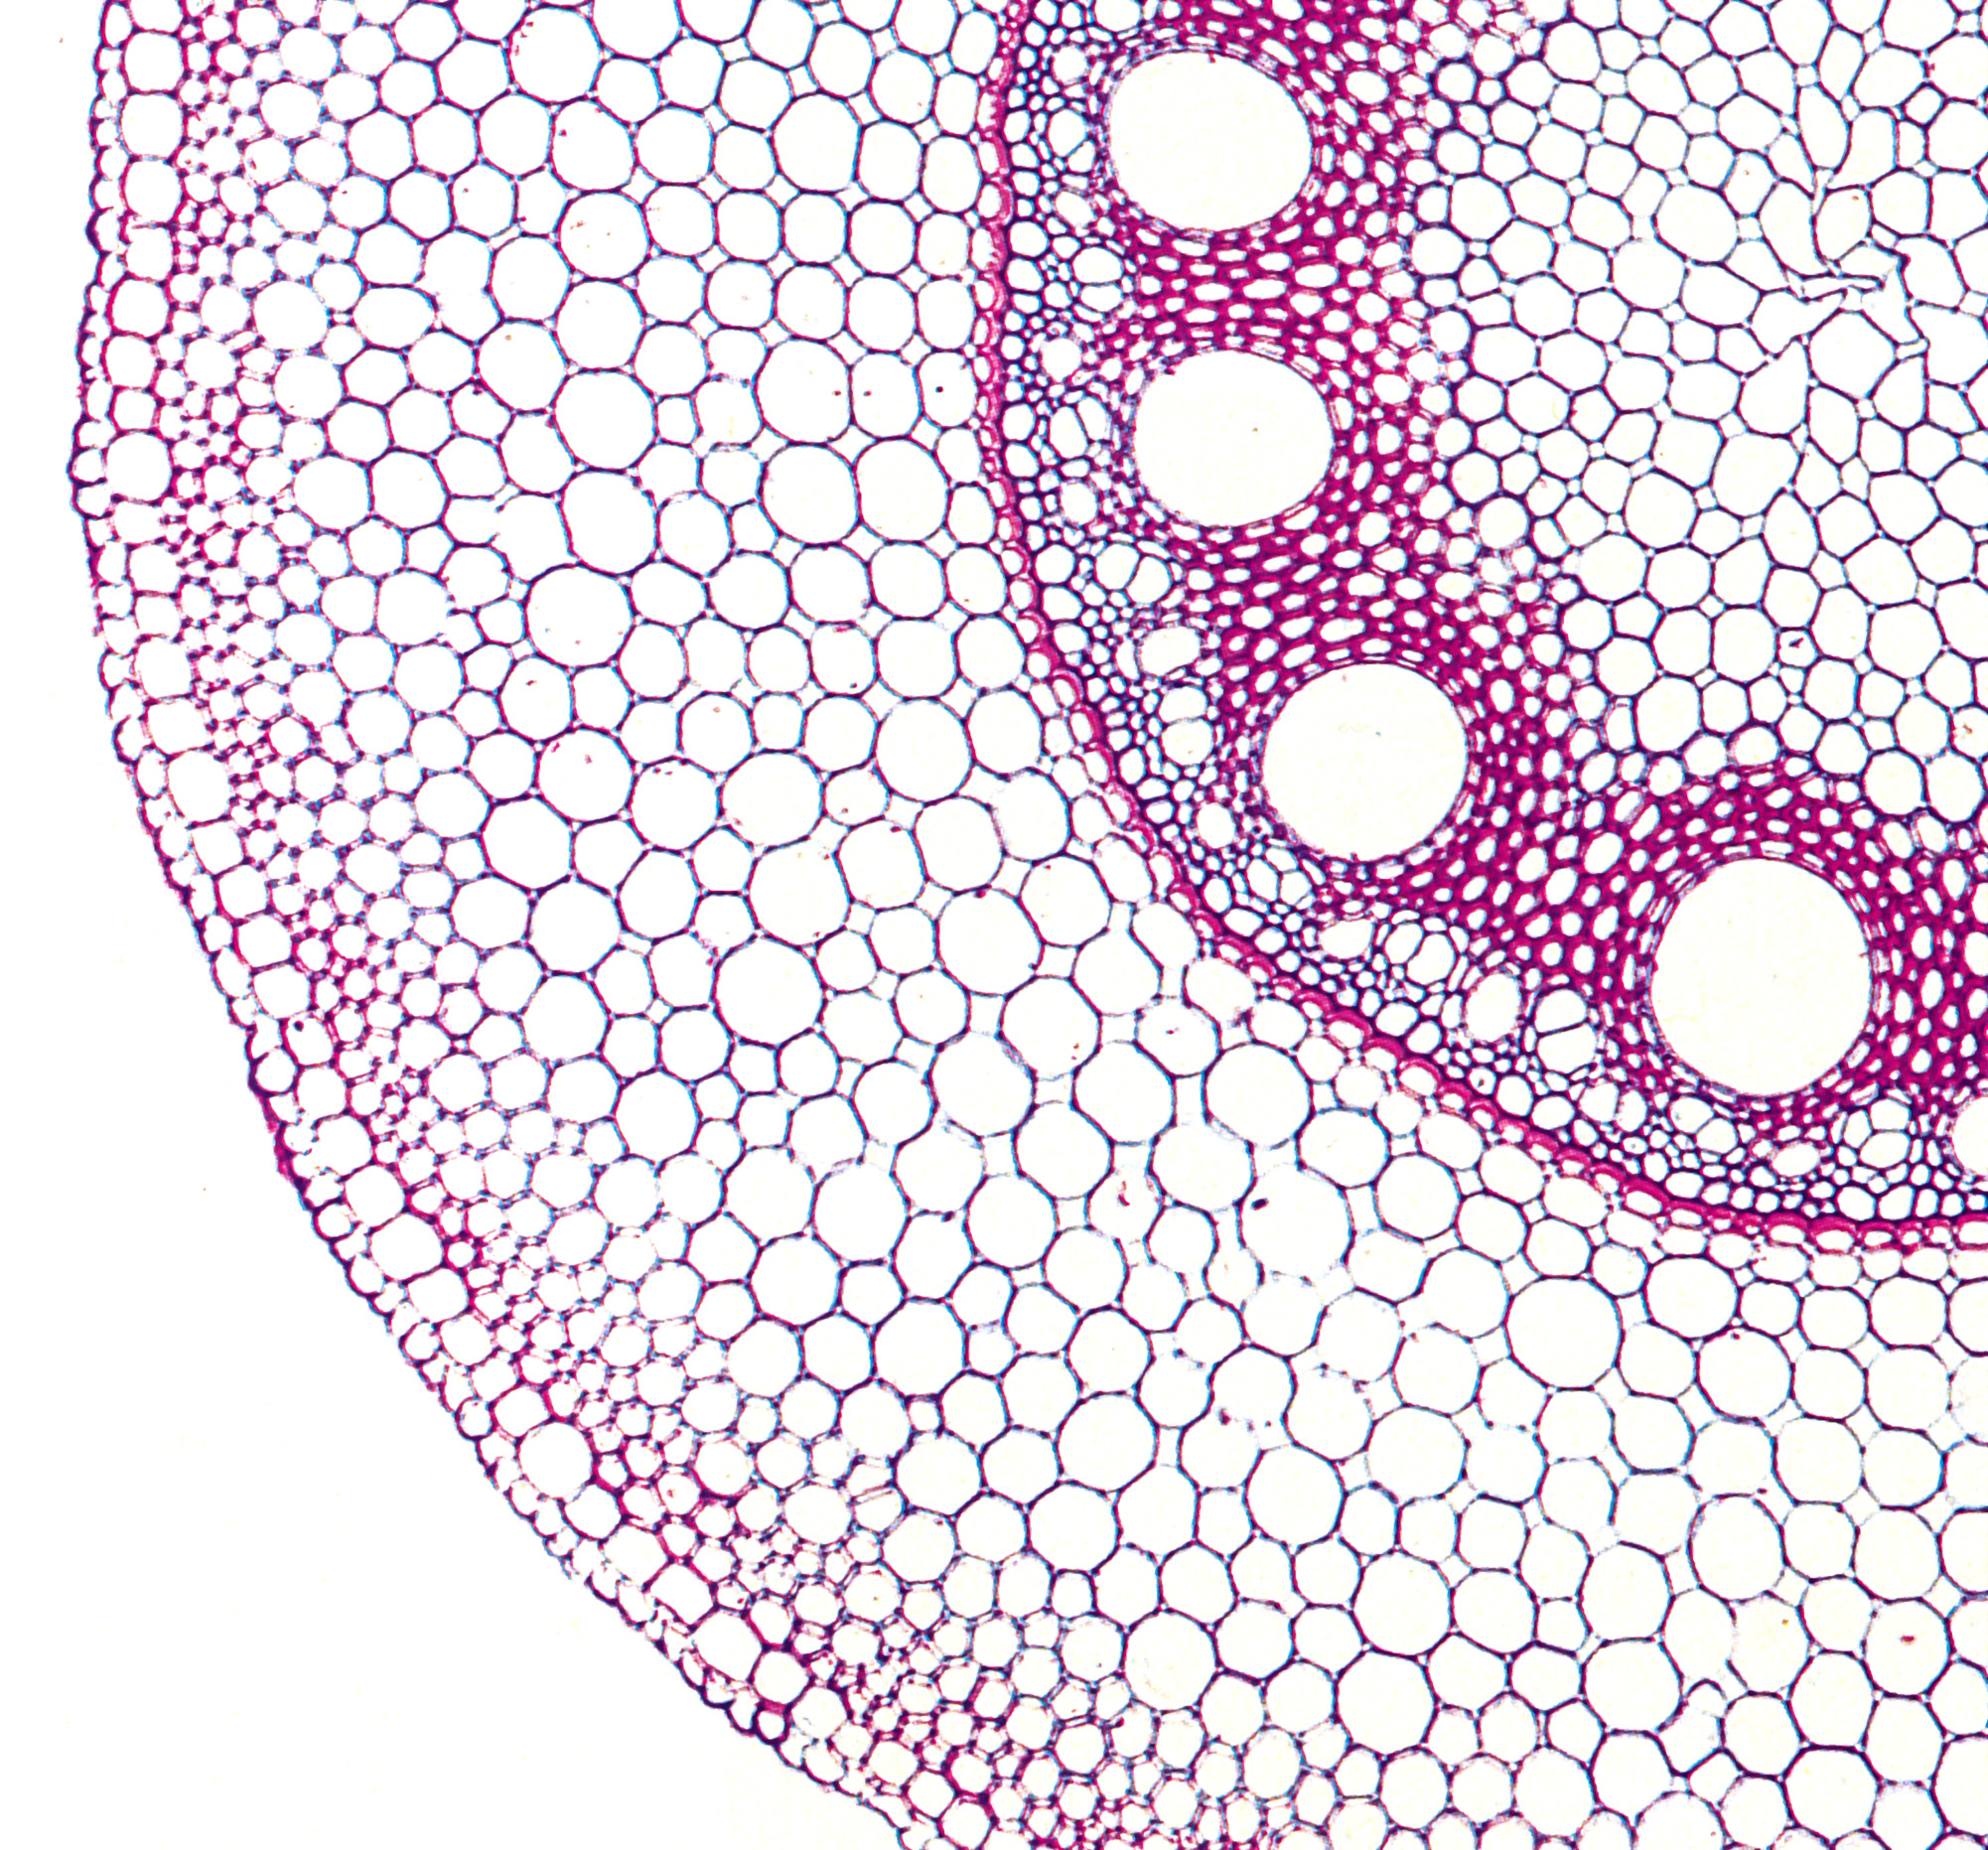
Figure 3.46. Transverse section of a mature maize root, showing many layers of cortical cells outside a distinctive suberised endodermis bounding the stele. Late metaxylem vessels with large diameters are the dominant feature of the stele. Note a hypodermal layer underlying the epidermis. Pink Toluidine blue staining characterises suberised cells. (Photograph courtesy A.W.R. Robards)
Water and nutrients travel radially across roots from the soil to the xylem vessels and from there, they travel axially to the shoot. Anatomical and morphological features determine how effective roots are at absorbing and transporting water and nutrients from the soil to the shoot. Root tissue needs to form a low resistance pathway for transport, but also minimise the loss of water to the soil under adverse conditions.
The complexity of the root tissue that water and nutrients must cross is shown below in Figure 3.46. Notable features are the many layers of cortical cells, and the stele containing large and small xylem vessels. The stele is enclosed by the endodermis, a cell layer that contains deposits of suberin and lignin in the anticlinal walls between cells, called a Casparian strip, which blocks diffusion of water and solutes from the cortex into the stele. All roots have an endodermis, except at the tip where they are still growing.
Figure 3.46 also shows a layer of cells beneath the epidermis, which is often suberised and called exodermis. The suberin forms in older roots of many species or under drought conditions. Water and solutes cannot flow across the suberised cells of the exodermis and are restricted to passage cells that are not suberised.
Across the cortex, water could flow along cells walls and through interstitial spaces, the so-called apoplastic route. Alternatively it could enter the epidermal or hypodermal layer and flow symplastically across the cortex. Another alternative is the transmembrane (or transcellular) route. These three pathways are described in the following section. The solutes in the soil solution may also take the same route, or move independently of water.
Radial root conductance to water varies with stage of root development. The radial pathway is considered as more limiting than the axial pathway, and in the younger part of the root where the endodermis and hypodermis are not suberised, the radial conductance to water is higher than when these cell layers are suberised.
Within the stele, water and solutes move symplastically from the endodermis to the adjacent layer of pericycle cells, which are not suberised, so water can then move apoplastically to the xylem vessels. Solutes would most likely stay within the symplasm and be transported via plasmodesmata to the xylem parenchyma cells, from where they are loaded into the xylem vessels. If the xylem vessels are mature and the plant is transpiring, the solutes are carried swiftly to the shoots. If the xylem vessels are immature, the solutes are later released after rupture of the end walls of the immature xylem elements.

Figure 3.47. Sketch of a transverse section of a young root showing three proposed pathways of ion and water flow across roots. 1. Apoplastic, via cell walls. 2. Transmembrane (transcellular), via cytoplasm within cells and crossing membranes via efflux and influx membrane transporters. 3. Symplastic, via cytoplasm all the way, crossing cell walls via plasmodesmata. (Drawing courtesy B. Berger, based on Plett and Moller 2010). Note that at this stage the endodermis is not suberised and has just a Casparian strip (red). Deposition of suberin in the endodermal wall, and the development of an exodermis, will restrict the apoplastic and transcellular pathways.
Water and ions may move through root tissues along one of three routes: symplastic, apoplastic, or transmembrane, the latter also known as the “transcellular pathway” (Figure 3.47). An update on the anatomical and molecular bases of these pathways in Arabidopsis is given by Barberon and Geldner (2014).
The proportion of water flowing through the different pathways undoubtedly varies with the plant’s rate of transpiration.
Water and soil solutes might move through the cell walls of the cortical cells until the endodermis, where they would cross the plasma membrane of the endodermal cells. Water would cross via aquaporins, and solutes via ion channels or transporters (see Section 3.6). This is possible in roots without a suberised hypodermis and when the endodermis is in the primary stage of development, as described in the following page. Entry of anions to deep layers of the cortex is likely to be restricted by charge repulsion from dissociated, negative carboxyl groups in cell walls (Donnan Free Space). In general, cations also pass through cell walls more readily than anions, particularly if many of the carboxyl groups in cell walls are not occupied by Ca2+ ions. Nonetheless, apoplastic flow of water through roots can sustain large ion fluxes during periods of high transpiration.
It is likely that the bulk of the soil water taken up by the plant moves in the apoplast across the cortex, but that solutes are taken up by epidermal or outer cortical cells and then move in the symplasm across the cortex.
When the endodermis is suberised, water and solutes cannot enter from the apoplast and instead are taken up into the adjacent cortical cells and move via plasmodesmata into the endodermis.
Symplastic flow occurs when water or solutes are taken up by the epidermis or an outer cortical cell, and then subsequently cross the rest of the cortex via plasmodesmata. Plasmodesmata are extensions of the plasma membrane that cross cell walls and provide cytoplasmic continuity between cells, allowing neighbouring cells to communicate and exchange materials more freely. Water and ions can move through the cortex via a series of plasmodesmal connections, thereby remaining in the cytoplasm until reaching the stele. Rate of water and nutrient transport is largely regulated by plasmodesmal resistance, which depends on size and frequency of plasmodesmata in the cell membranes. Alternatively, water and some ions enter vacuoles and are therefore, subject to transport properties of the tonoplast.
A third possibility is the transmembrane or transcellular route, in which water and nutrients cross membranes, passing repeatedly between symplasm and apoplasm as they are transported from one cell to the next. For nutrients, this form of transport is facilitated by carriers that are distributed in a polar fashion, with influx carriers located on the outer walls and efflux carries on the inner walls. Water transport across cell membranes is via aquaporins for which there is no “rectification”, or intrinsic directionality of transport. They are therefore most likely to be distributed evenly along the plasma membrane.
This pathway may increase resistance to flow of water, but also provides a more effective mechanism for controlling the flow of solutes and water across the root than the purely symplastic route via plasmodesmata when only the first membrane crossing is available to control ion and water transport.
The epidermis and root hairs probably mediate most of the selective uptake of solutes from the soil solution. Nutrients are selectively taken up, and potential toxins excluded. The cortical cell layers continue this selective uptake if solutes travel apoplastically towards the stele.
The endodermis is the innermost cortical layer that surrounds the central vasculature, and forms a barrier preventing water flow and free diffusion of solutes in the apoplast because of its Casparian strip and suberin lamellae. It thus, prevents soil solution moving into the stele without crossing a membrane, and also prevents water from within the stele being lost back to the soil at night. Although, in some regions of the endodermis that are opposite xylem poles, water and solutes may bypass the endodermis through unsuberised “passage cells”. The endodermis also functions in structural support for the stele, particularly in drying soil, and minimises shrinkage or swelling of the cells of the stele. Its role in ion selectivity is minor compared to the cells of the cortex and epidermis.
In many plants, the cortical layer under the epidermis (the hypodermis) develops Casparian bands and suberin lamellae, and develops into the exodermis. This forms another barrier for the apoplastic movement of water and solutes. Just like in the endodermis, some passage cells in the exodermis may be free of suberin and can take up water and solutes.
An endodermis with a Casparian strip is a feature of roots of all land plants from ferns upwards. As the innermost cortical layer that surrounds the central vasculature of roots, the endodermis acts as a barrier to the free diffusion of solutes from the soil into the stele, and the stele into the soil. The protective functions range from efficient water and nutrient transport to defence against soil-borne pathogens. The genes and regulation mechanisms that drive the differentiation of this intricately structured barrier have been reviewed by Geldner (2013).
The development of the endodermis has three stages: the primary stage in which the Casparian strip forms, the second stage when suberin lamellae encases the entire endodermal cell, and the tertiary stage when the inner tangential walls thicken and a layer of cellulose is deposited over the suberin lamellae.
The Casparian strip is made of lignin and suberin and deposited as a ring in the radial walls of the endodermal cells, like a hoop around a barrel of beer. It reaches from the plasma membrane to the outermost part of the wall and adjoins adjacent cells so there are no air spaces between the cells at this point. It therefore blocks the flow of water through the cell walls. It differentiates as root cells mature about 5-10 mm from the tip, and so an entirely apoplastic pathway from soil to central stele can occur only in very young root parts or at sites where the Casparian strip is disrupted such as site of lateral root development, which starts at the pericycle, the cell layer beneath the endodermis.
In the first stage of endodermis development, the Casparian strip in the primary wall prevents flow of water and solutes through the wall from inner cortex to stele. Any solutes remaining in the apoplastic water must enter the endodermis via membrane transporters. Water in the apoplast must enter the endodermis via aquaporins as illustrated in the lower pathway shown in Figure 3. 50.

Figure 3.50. The alternative pathways for water and nutrient solute flow across roots with the endodermis at Stage 1 of development, with a primary wall with Casparian strip (c). The apoplastic pathway is blocked at this point, and water, along with any nutrients still in the walls, enters the endodermal cells via membrane transporters (lower panel). If the hypodermis also has a Casparian strip, water and nutrients must also enter via membrane transporters. Alternatively, water and nutrients can move via the symplastic (dotted red line, lower panel) or transmembrane pathways (upper panel). (Diagram courtesy H. Bramley)
In the second stage of development, the endodermis becomes suberised as the secondary walls develop, and suberin lamellae are formed all over the cell, underneath the primary wall that contains the Casparian strip. This occurs at varying distances from the root tip depending on species and is often induced under drought to form in younger parts of the root.
Suberin is a hydrophobic polymer, deposited in the secondary cell wall in lamellae. It therefore seals off the plasma membrane from solutes, as water and ion channels are sealed. So the transcellular and apoplastic pathways are curtailed, and water and solutes enter the endodermis only through plasmodesmata from neighbouring cells (Figure 3.51). Any function in selective control of particular nutrients into or out of the endodermal cell through the suberin lamellae is unclear.
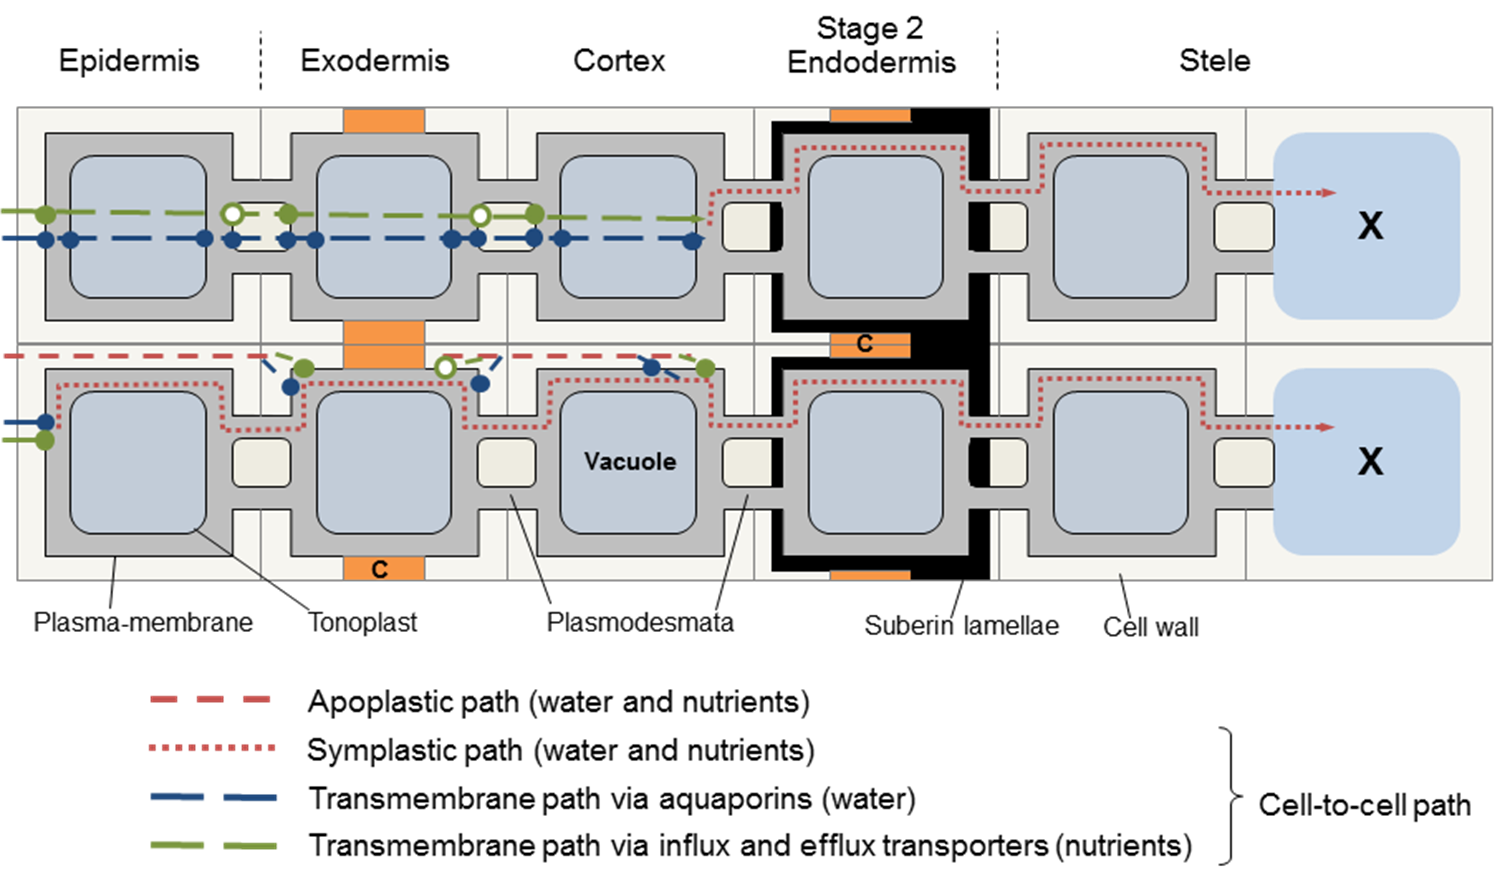
Figure 3.51. Alternative pathways for water and nutrient flow across roots with a suberised (Stage 2) endodermis. A complete layer of suberin around the endodermis means that water and solutes can enter only via plasmodesmata from the inner cortical cells. (Diagram courtesy H. Bramley)
Some endodermal cells remain at the primary stage even late in root development, and are called passage cells.
Stage 3 of the endodermis involves further deposition of cellulosic wall material, further impeding flow of solution through walls.
Exodermis is the name given to a hypodermis with Casparian strips and suberised lamellae.
Roots of most species form an exodermis with time. First, a Casparian band is laid down in the primary wall of the hypodermis, then all the wall is suberised especially the inner wall, as for the endodermis. Some cells in this hypodermal layer (‘passage cells’) remain unsuberised.
The development of the exodermis is very common in the plant kingdom (Perumalla et al. 1990). In a study of 180 angiosperm species, the great majority (89 %) showed a clearly suberised exodermis with Casparian strip. It was found in roots of primitive and advanced plant families, from hydrophytic, mesophytic and xerophytic habitats, but was lacking in some Poaceae. It was notably absent in oat, barley and wheat (Perumalla et al. 1990), but generalizations within cereals cannot be made as subsequently maize was found to have an exodermis (Hose et al. 2001),
The Casparian band can develop close to the root tip. For example, in aeroponically grown maize a complete exodermal layer formed 30 mm above the root tip. In roots elongating more slowly due to abiotic stress or low temperature, it can be found closer to the tip. The extent at which apoplastic barriers form depends on the stage of development of the root system and also the habitat: drought, waterlogging, salinity, nutrient deficiency or toxicity may strongly influence the degree of suberisation (Hose et al. 2001).
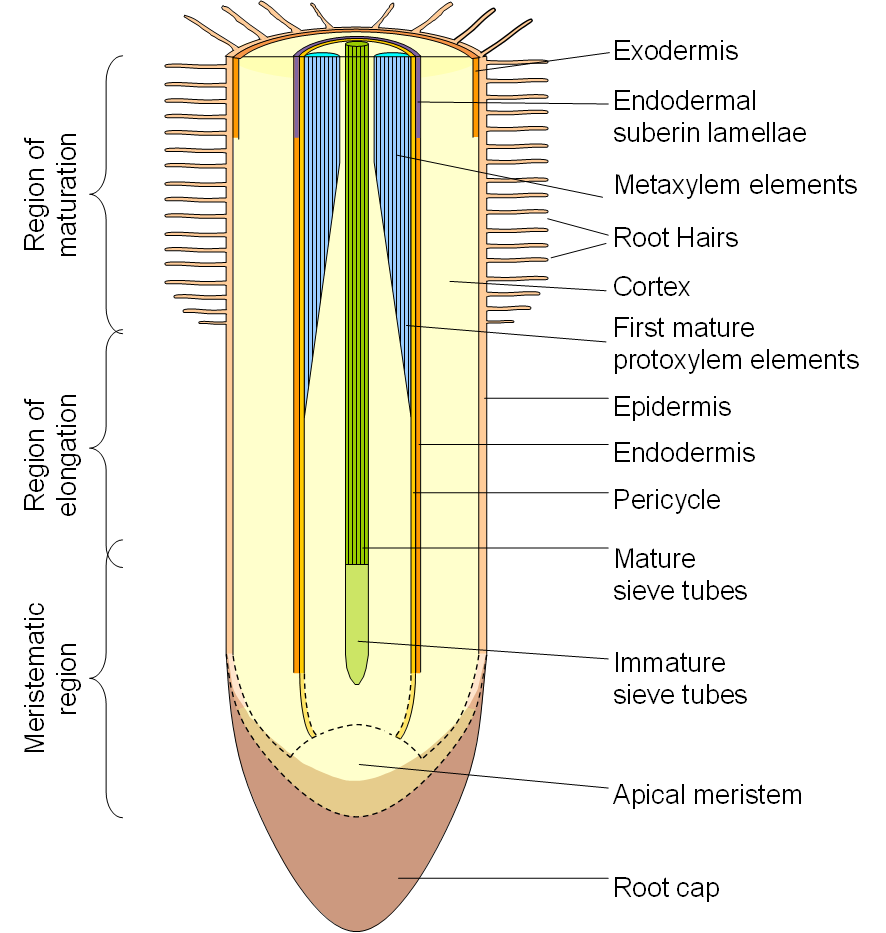
Figure 3.54. Schematic diagram of a longitudinal section through a root indicating the stage at which the critical structures in radial and axial transport of water develop. Not to scale. (Diagram courtesy H. Bramley)
When an exodermis forms, it also imposes a restriction to radial transport. Complete layers of suberin constrain water and solute flow only via plasmodesmata from the epidermis and inner cortical cells. Whether or not it can be considered as a barrier depends on the degree of suberisation and the number of passage cells within it. Its properties as a barrier are variable (Hose et al. 2001).
The exodermis represents a resistance to the radial flow of both water and solutes, much like the endodermis in Stage 1 development. It restricts radial apoplasmic movement and may also restrict transmembrane transport of nutrients. Exodermal layers become functionally mature 20–120 mm from the apex, where lateral roots are initiated, and therefore constitute a barrier to apoplastic ion flow only in root zones where an endodermis is already present. In a similar way to the endodermis, maturation of an exodermis involves further deposition of suberin and cellulosic wall material, further impeding flow of solution through walls.
The exodermis is not totally impermeable to water or nutrients and may have a differential selectivity that varies with the environment. How much the root is sealed off depends on the type of exodermis: (1) uniform exodermis where the cells are uniform in shape (suberin deposition is patchy and develops late) or (2) dimorphic exodermis, which consists of long and short passage cells (the former of which are suberised). Suberin lamellae enclosing the long cells disrupt the cytoplasmic continuity through plasmodesmata and the cell dies, but suberin lamellae in the uniform-type exodermis do not affect plasmodesmata. Individual passage cells allow passage of solutes and water via uptake carriers, not via the apoplast as flow there is blocked by the Casparian strip. They have an active role in ion uptake and often become the only plasmalemma facing the soil solution especially when the epidermis dies. Some families (e.g. irises) have large numbers of passage cells while others have very few.
The diagram of a root to the right (Figure 3.54) indicates the stage of development at which the various structures are functional.
The anatomy of roots and the alternative pathways of water and solute flow across roots and into the xylem indicates that the relationship between water and nutrient flow to the shoots could be quite complex. Water may take different pathways than nutrients. The distribution of water in the different pathways depends not only on the age of the root, but may also vary with the flux of water moving through, that is, the rate of transpiration.
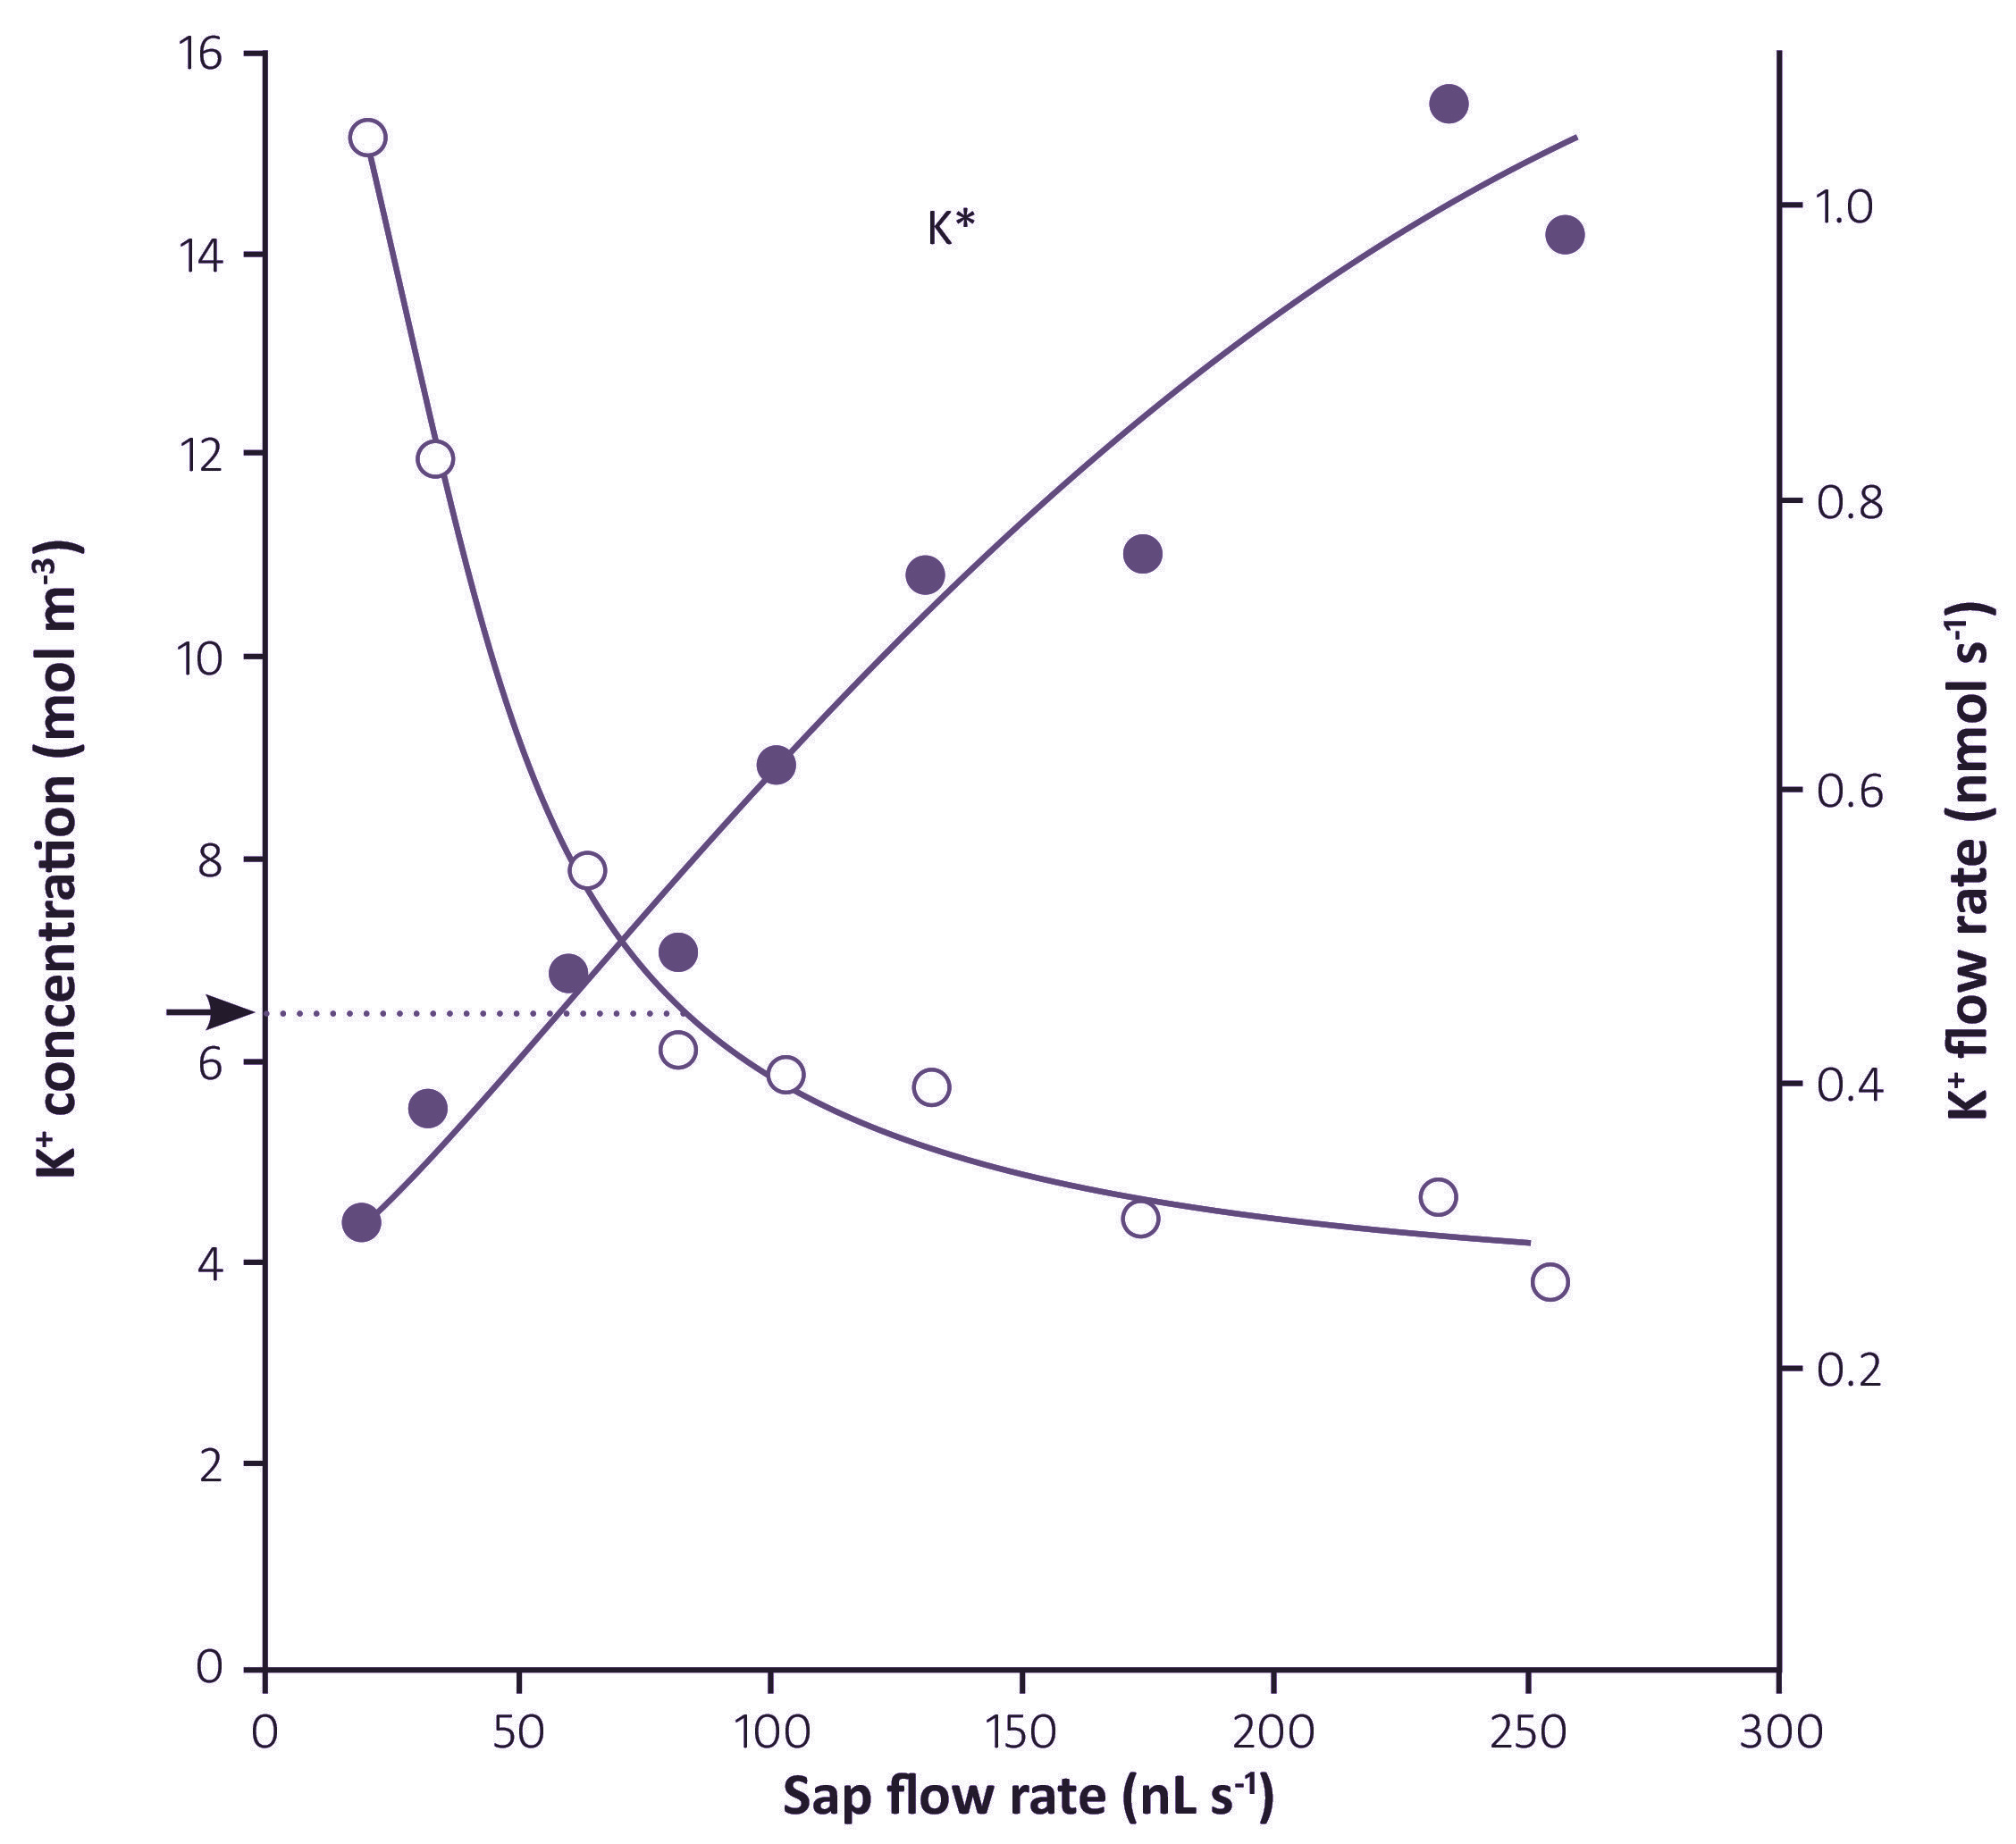
Figure 3.55. Effect of volume flux (sap flow rate) on K+ concentration and K+ flux in xylem sap from barley. Arrow indicates the external K+ concentration, and dotted line indicates the range of sap flow rate for which K+ in the sap was at a higher concentration than the external solution. (Munns, 1985)
The various pathways taken by water and nutrients, and the environmental factors that influence them, are not well understood. The fundamental processes governing the relationship between water and nutrient flow through roots are complex. One thing is clear: nutrients do not move passively with the transpiration stream. But neither is their movement entirely independent of it.
This section looks at the relation between water and solute fluxes to the shoot: how the rate of transpiration affects solute concentrations in the xylem, and how active solute transport affects water flow rates at night (root pressure).
Solute fluxes in the xylem usually respond to changes in transpiration rate, although the relationship is not proportional. The figure below (Figure 3.55) indicates an apparently strong relation between water flux and K+ flux, but it must be noted that the flux of K+ is already high at very low flow rates, increases linearly with moderate increases in flow rate, but then tapers off at high flow rates.
A similar relation has been found for other nutrients like nitrate.
The importance of transpiration in carrying nutrients to the shoot has long been debated. However, experimental evidence showed that transpiration was not necessary to get nutrients to the shoot, as growth rates and net nutrient transport rates were unaffected by humidity and other environmental conditions that would reduce transpiration (Tanner and Beevers 2001). Transpiration was not a prerequisite for long-distance transport of nutrients, as root pressure (see below) in the absence of transpiration can supply the shoot with the required nutrients.
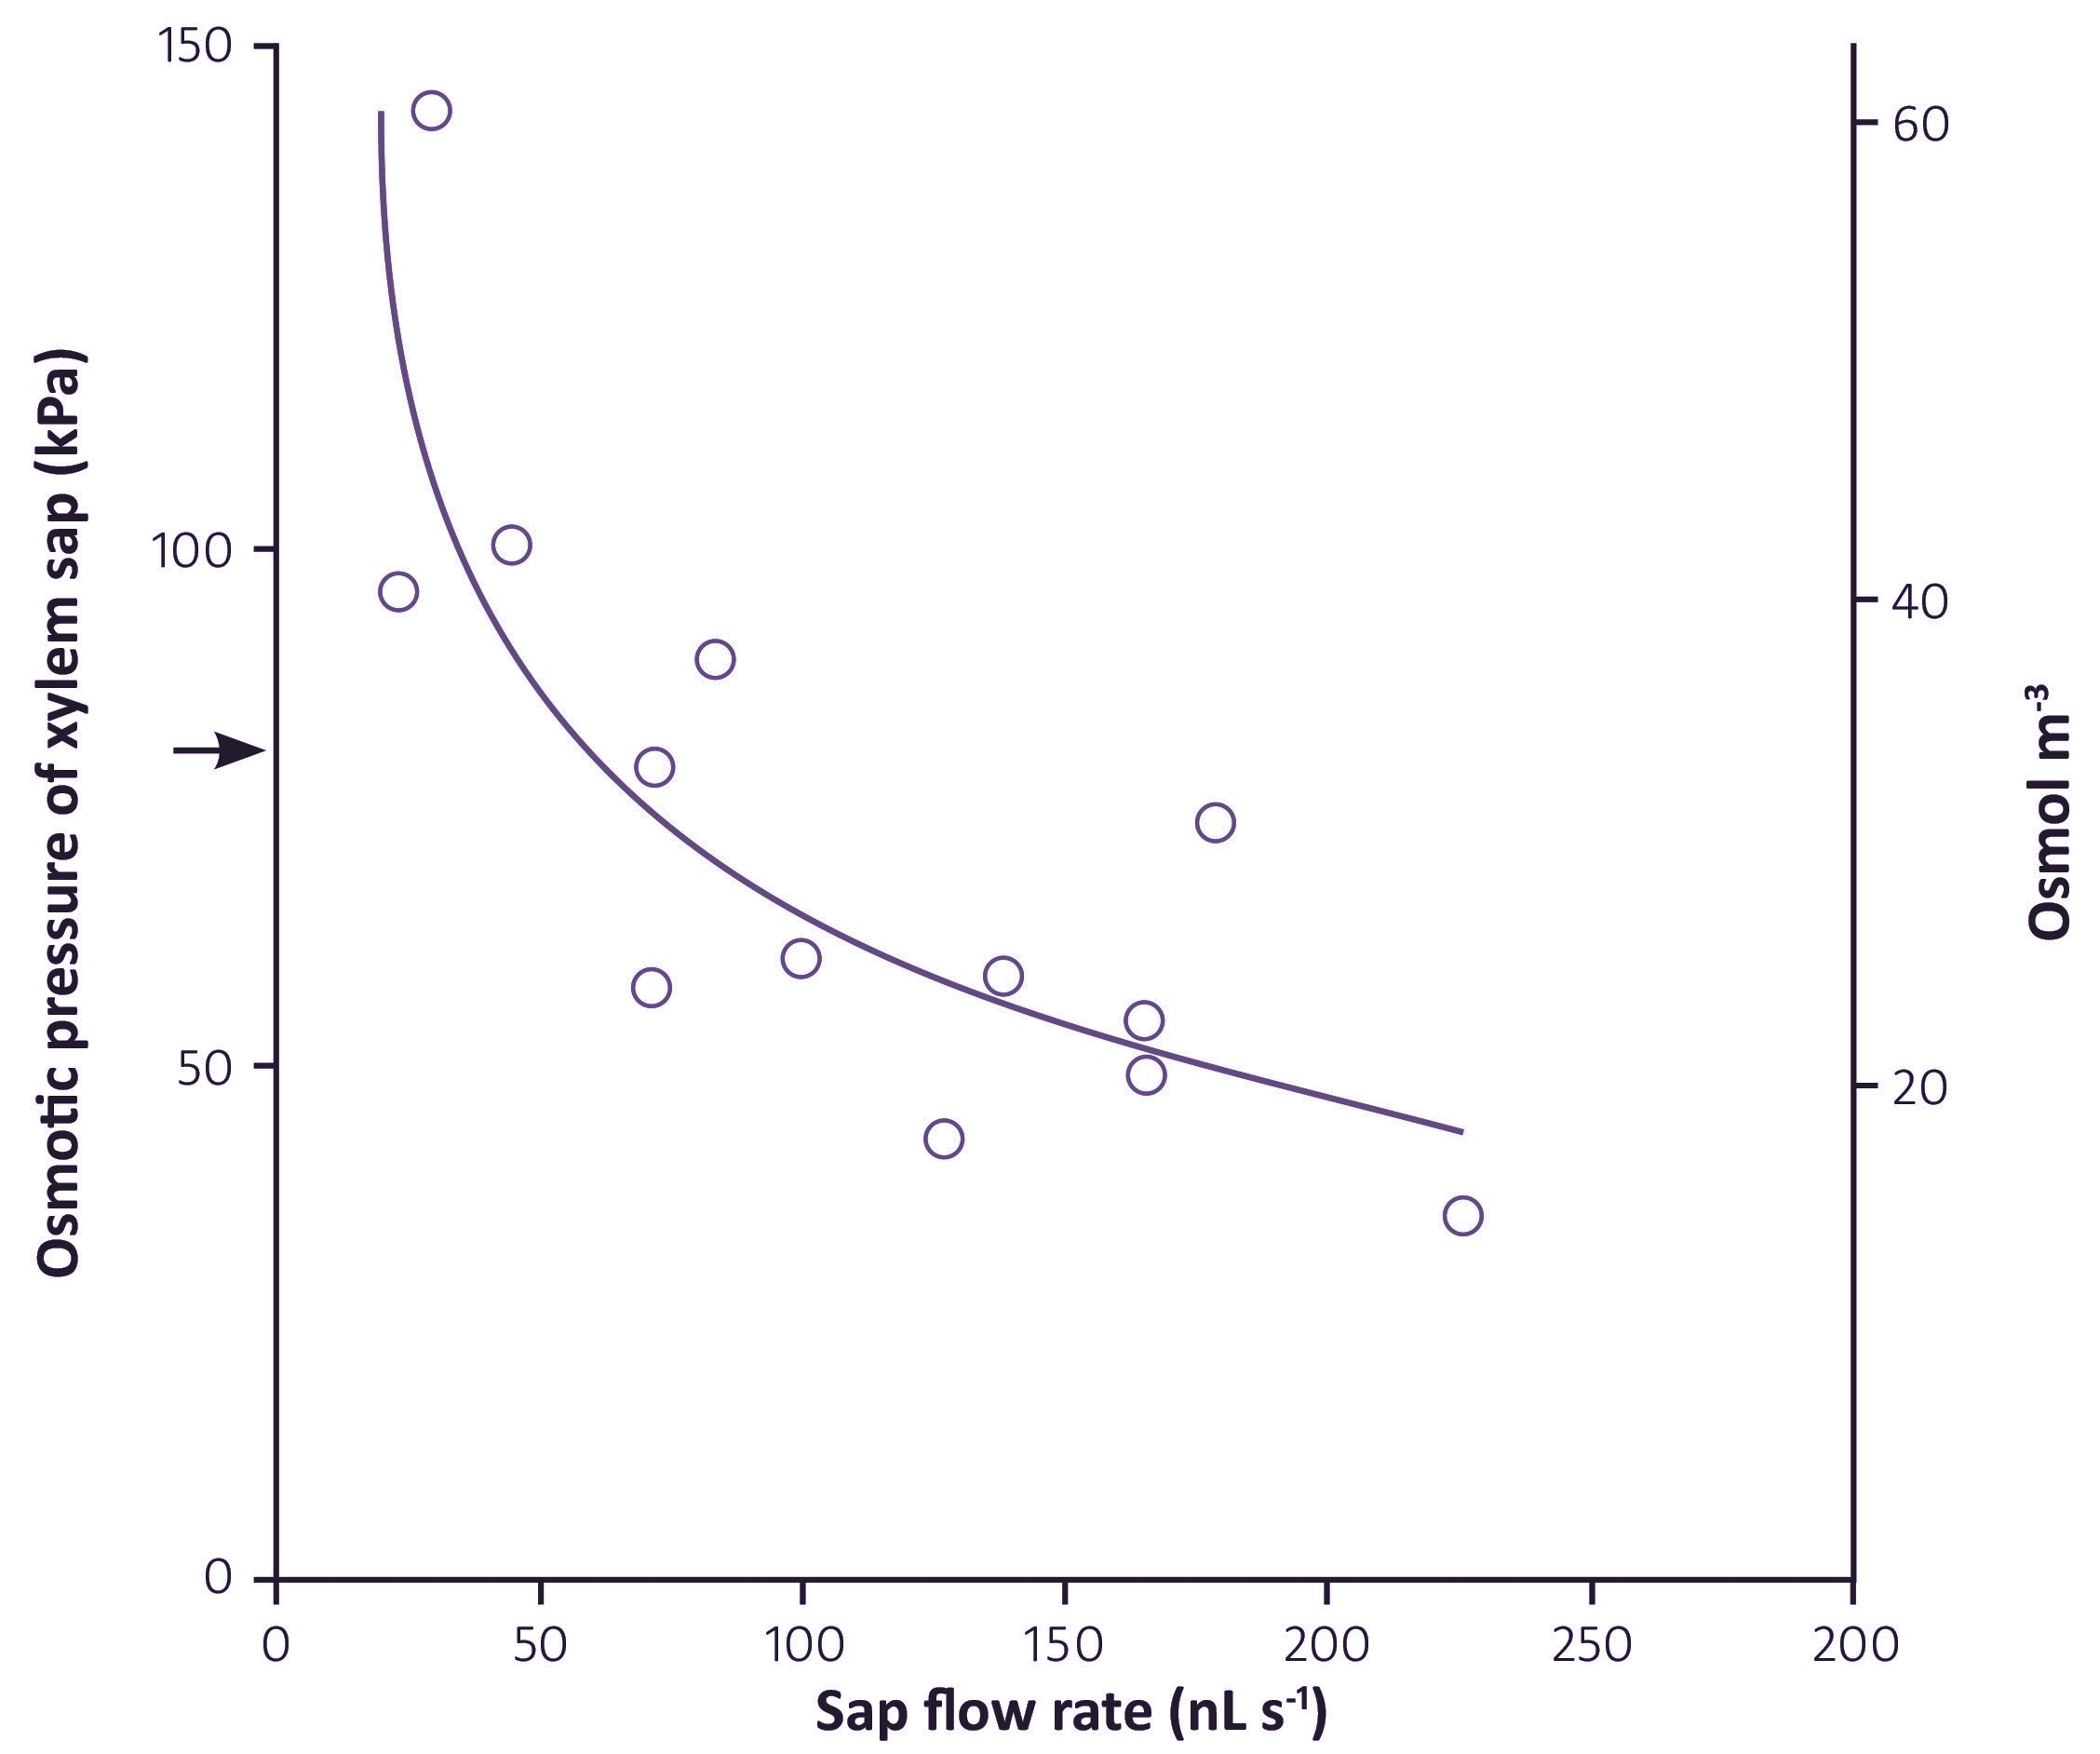
Figure 3.56. Effect of transpiration rate on osmotic pressure (left hand axis) and the corresponding solute concentration (right hand axis) of xylem sap of young barley plants. Transpiration rates were imposed by varying vapour pressure deficit around the shoots and xylem sap was sampled by applying sufficient pressure to roots to cause a cut leaf tip to bleed. Arrow indicates the external osmotic pressure. (Munns and Passioura, 1984)
Transpiration rate (the volume flux in the xylem) has a marked effect on the concentration of solutes in the xylem sap. Plants which are transpiring rapidly have a low concentration of nutrients in their xylem sap compared with slowly transpiring plants. This relationship between concentration and volume flux holds for most nutrients, see example with K+ (Figure 3.55 above) in which increasing flow rates decreased the concentration of K+ in xylem sap.
The data also shows that an apoplastic or diffusive uptake of K+ is not important because the concentration of K+ in the xylem was greater than the external K+ over a range of volume fluxes which produced an increasing flux (Figure 3.54). These data strongly suggest that ion concentrations in xylem sap are a result of either a single variable pump, or more likely of several sequential processes. The composition of the transpiration stream could be modified after the first passage across a membrane as it flows towards the stele or upwards through the stele by either active or passive ion fluxes from cortical or xylem parenchyma cells. K+ could be pumped in (or diffuse in) at rates which increase with increasing volume flux.
Similar relationships occur between most solutes in the sap and transpiration rate, as shown in Figure 3.56.
This shows how much influence the transpiration rate has on the concentration of solutes in the xylem, and that concentrations in sap collected from exuding cut stumps are not typical of concentrations in transpiring plants.
Plants that have had shoots removed have very concentrated xylem fluid, which exudes from the cut stumps under positive hydrostatic pressure from the roots (‘root pressure’). Root pressure is also responsible for the droplets of water seen on the margins of guttating leaves early in the morning (Figure 3.57).
Figure 3.57. Guttation droplets from a eucalypt leaf, E. tetragona. (Photograph courtesy C. Hooper)
This occurs because nutrient uptake is an active process, independent of water uptake from the soil, and continues during the night – the rate of nutrient uptake varies little over 24 h. When nutrients are pumped into the stele, water flows in by osmosis, and the pressure builds up. Positive pressures of 30-300 kPa can be achieved in this way.
The Casparian strip and the suberisation of the endodermis is important as it provides a barrier to prevent back-flow of water and also structural support so that the root can contain a positive pressure at night. The pathways of nutrient and water flow across the root cortex may change at night, for instance the apoplastic pathway may be of lesser importance at low rates of transpiration. At zero transpiration induced by a root pressure probe and when the shoot is removed, pathways may be different again.
Root pressure is not just a phenomenon, it is an essential process responsible for moving nutrients to the shoot during the night when transpiration is low. It may also have a function in dissolving gas bubbles that might have caused cavitation in the xylem during the day.
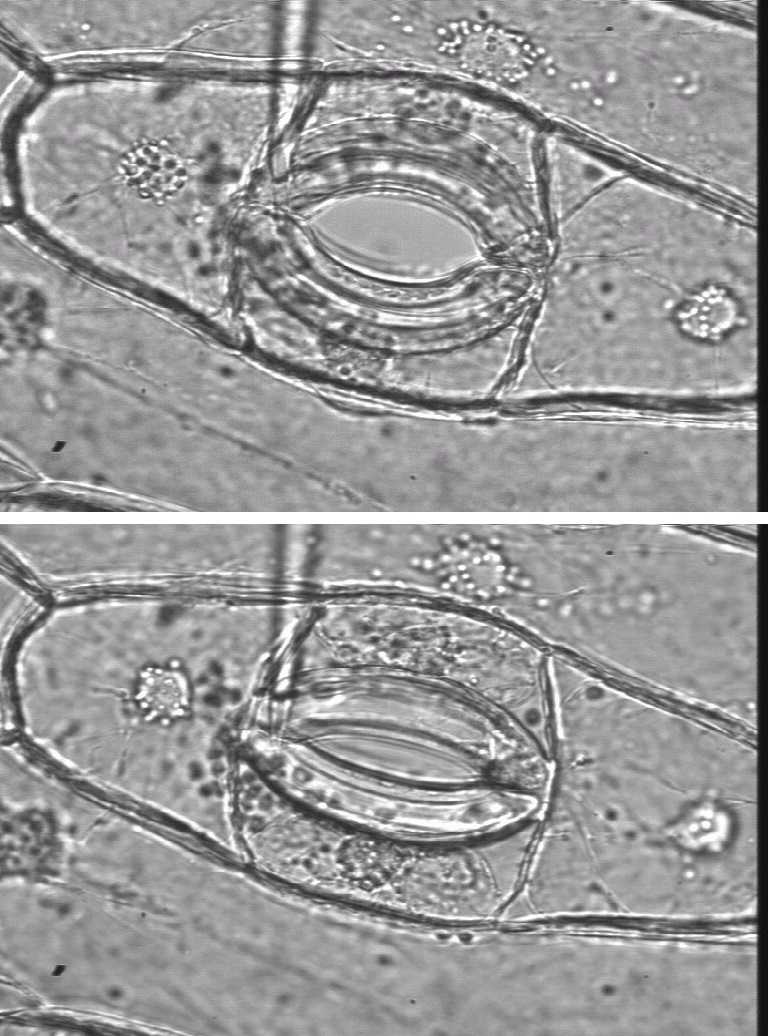
Figure 3.61. Guard cells are structured so that high turgor pressure opens the stomatal pore, and low turgor pressure closes the pore. Left (Lower image), Partially open Tradescantia virginiana stoma with 0.2 MPa guard cell turgor, as measured directly with a guard cell pressure probe (shown). Right (upper image) same stoma showing the aperture almost fully open, with 3.6 MPa guard cell turgor. (Images and data courtesy P. Franks).
Water uptake by cells is driven by solute uptake. Osmotically-driven water uptake generates the turgor pressure needed for maintenance of cell volume, and for specific cell functions that depend on controlled changes in turgor. The rapid influxes or effluxes of water that cause rapid changes in cell volume in key cells are brought about by ion influxes or effluxes.
Rapid changes in turgor cause the swelling or shrinking of guard cells in leaves that controls the opening and closing of stomata. The cell walls of guard cells are structured so that high turgor pressure pushes them apart and opens the stomatal pore. Low turgor pressure allows them to collapse and close the pore (Figure 3.61). Influxes or effluxes of K+ along with accompanying anions causes the osmotically-driven water uptake or loss
Whole leaves or parts of leaves can move quickly. Changes in the turgor of a group of cells at the base of leaves, the pulvinus, cause leaves to fold quickly in response to touch, as in the ‘sensitive plant’ Mimosa pudica, (Figure 3.62)
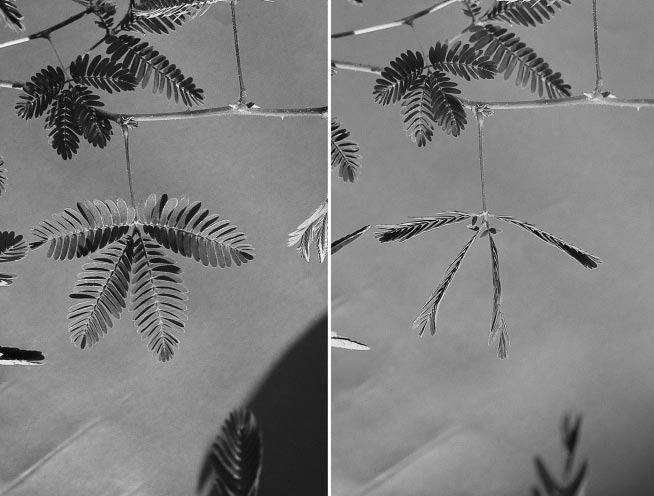
Figure 3.62. Seismonastic movement of pinnae and pinnules in leaves of the sensitive plant (Mimosa sensitiva) (a) before and after touch stimulation. (Photographs courtesy J.H. Palmer)
Turgor changes also change the curvature of hairs of insectivorous plants. In the case of the Venus fly trap, sensory hairs coupled to an electrical signalling system require stimulation at least twice within a 30 s period (Simons 1992). This appears to allow the plant to discriminate single pieces of debris from an insect crawling within the trap. Most seismonastic movements result from the explosive loss of water from turgid ‘motor’ cells, causing the cells temporarily to collapse and inducing very quick curvature in the organ where they are located.
Similar mechanism causes the slower folding of leaves at night into special positions to reduce heat loss, as in the prayer plant. This also occurs in many legumes. Charles Darwin measured the folding of leaves at nightfall in white clover, and wrote: “The two lateral leaflets will be seen in the evening to twist and approach each other, until their surfaces come into contact, and they bend downwards. This requires a considerable amount of torsion in the pulvinus. The terminal leaflet merely rises up without any twisting and bends over until it forms a roof” (Figure 3.63).
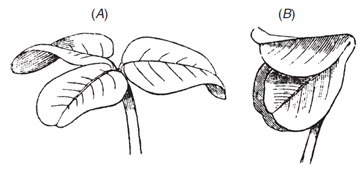
Figure 3.63 The nictitropic movements of leaves of white clover (Trifolium repens) from daytime (A) to ‘sleeping’ position (B). (Charles Darwin, The Power of Movement in Plants, 1881). (Diagram courtesy R. Purdie)
Movement of some plant organs can be staggeringly fast. The firing of the reproductive structure (“column”) of trigger plants (Stylidium genus) in response to the landing of a pollinating insect may take only 15 msec (Figure 3.64).
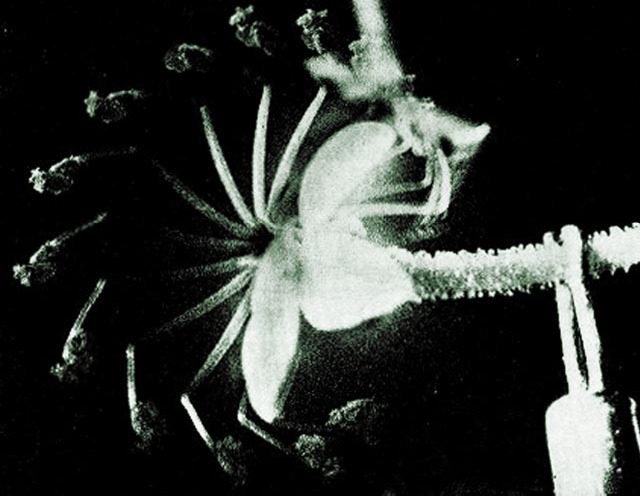
Figure 3.64 Sequence of superimposed images captures the flower column of a trigger plant (Stylidium crassifolium) as it ‘fires’ in response to a physical stimulus (insect landing, seen on upper right). The column rotates through 200° from a ‘cocked position’ to a relaxed position in 20 ms (photographs taken at 2 ms intervals). (Findlay and Findlay 1975)
The kinetic energy manifested in this rapid firing is derived from events controlled at a membrane level. Ions transported into specialised cells cause hydrostatic (turgor) pressure to develop which is suddenly dissipated following mechanical stimulation
Water transport into a cell anywhere in the plant is governed by solute uptake which in turn is governed by the permeability of membranes to water as well as solutes.
This section covers diffusion of molecules, and permeability of cell membranes, essential to the process of osmosis. Cell membranes are bilayers of phospholipids in which transport proteins are embedded (Figure 3.65).
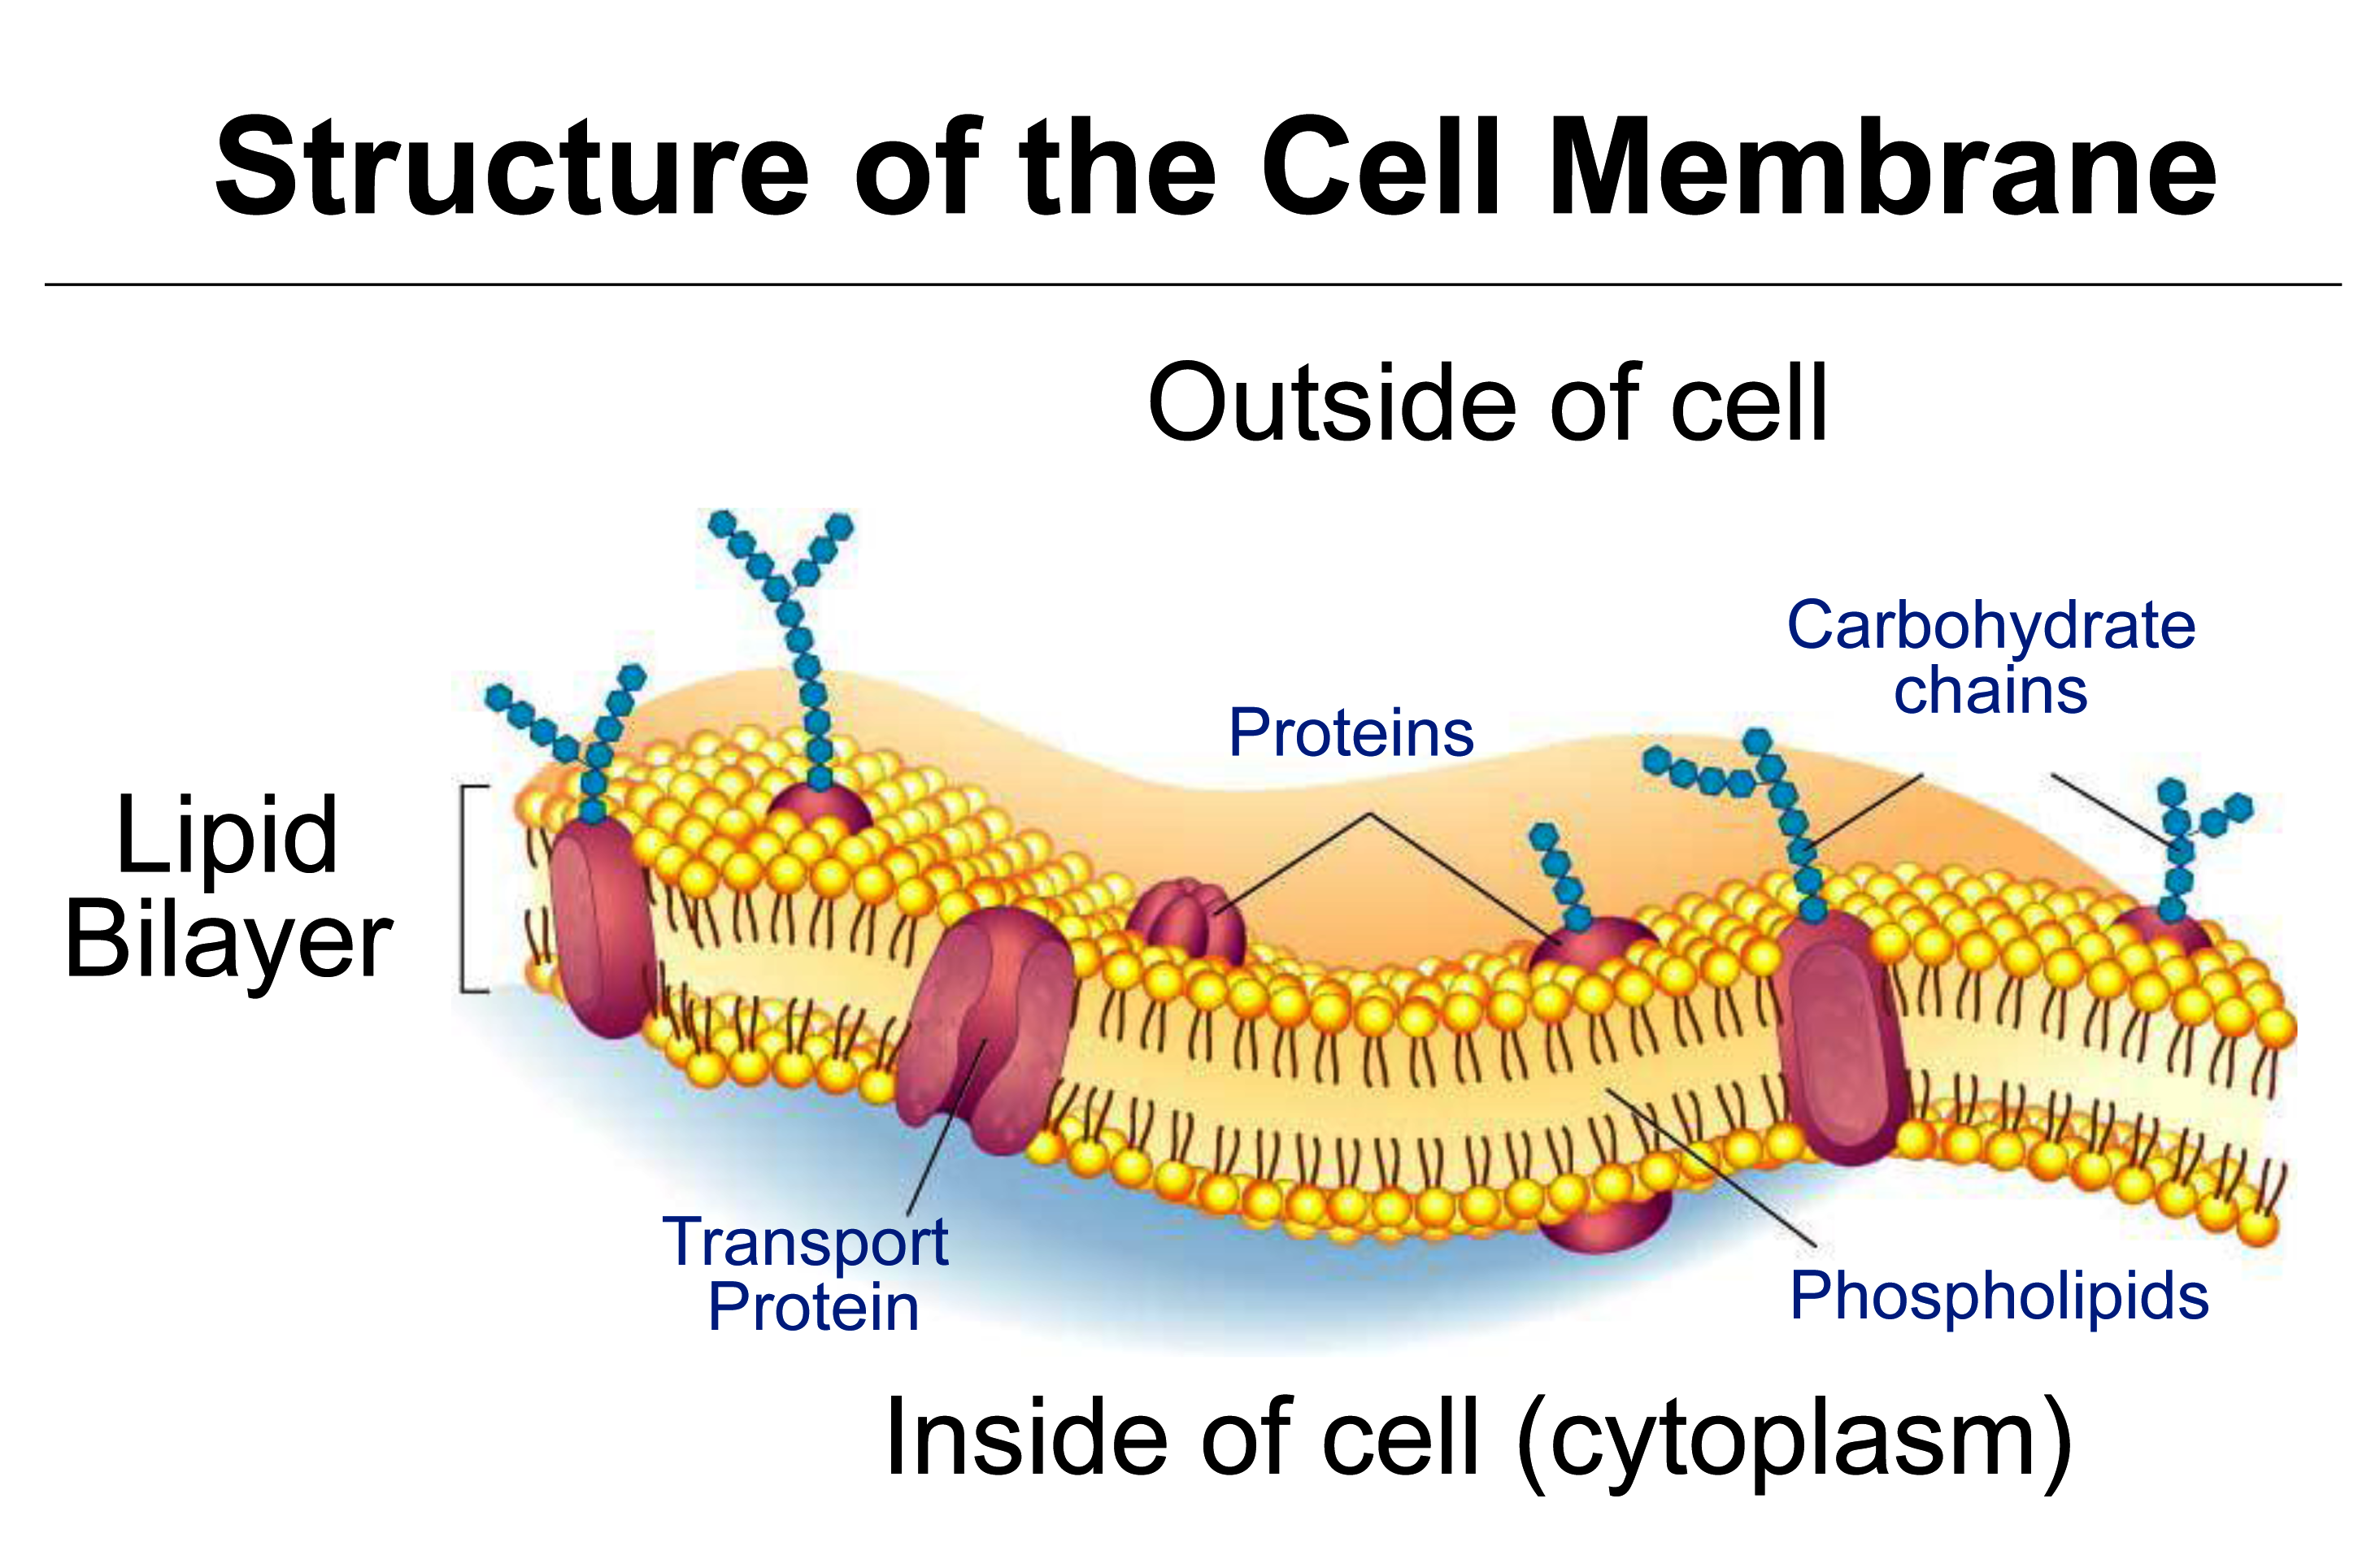
Figure 3.65 Diagram of a cell membrane with transport proteins embedded in the phospholiped bilayers. (Image courtesy M. Hrmova)
A plant membrane is often described as semi-permeable, meaning permeable to water but not biological solutes. However the membrane is not 100% permeable to water, as water can enter cells only by being transported through aquaporins, neither is it 100% impermeable to solutes, as solutes can slowly permeate the membrane particularly through specific transport proteins.
Unrestricted movement of water relative to solutes is the basis of osmosis, and in plants the generation of turgor pressure, \(P\). The principles of diffusion and selectivity, which are used to describe differential rates of molecular movement, provide a physical rationale for osmosis.
In a homogeneous medium, net movement of molecules down their concentration gradient is described by Fick’s First Law of diffusion. The molecule and medium may be a solute in water, a gas in air or a molecule within the lipid bilayer. Fick’s Law holds when the medium is homogeneous in all respects except for the concentration of the molecule. If there was an electric field or a pressure gradient then Fick’s Law may not apply. Considering the case of a solute in water, say, sugar, Fick’s Law states that net movement of this solute, also called the net flux \(J_s\), is proportional to the concentration gradient of the solute \( \Delta C_s / \Delta x \):
\[ J_s = -D_s \frac{\Delta C_s}{\Delta x} \tag{12}\]
The diffusion coefficient (\(D_s\)) is a constant of proportionality between flux, \(J_s\), and concentration gradient (mol m-4), where solute concentration (\(C_s\), mol m-3) varies over a distance (\( \Delta x\), m). Flux is measured as moles of solute crossing a unit area per unit time (mol m–2 s–1), so \(D_s\) has the units m2 s–1. \(D_s\) has a unique value for a particular solute in water which would be quite different from \(D_s\) for the same solute in another medium, for example the oily interior of a lipid membrane.
Across a membrane, the movement of a molecule from one solution to another can be described by Fick’s Law applied to each phase (solution 1–membrane–solution 2). However, flux across the membrane also depends on the ability of the molecule to cross boundaries (i.e. to partition) from solution into the hydrophobic membrane and then from the membrane back into solution. Another difficulty is that the thickness of membranes is relatively undefined and we need to know this for Fick’s equation above (\( \Delta x \)). The two solutions might differ in pressure and voltage and these can change steeply across a membrane; however, if for simplicity we consider a neutral solute at low concentration, these factors are not relevant (see below for charged molecules). A practical quantitative description of the flux of neutral molecules across membranes uses an expression intuitively related to Fick’s Law stating that flux across a membrane (\( J_s \)) of a neutral molecule is proportional to the difference in concentration \(\Delta C_s\):
\[ J_s = P_s \Delta C_s \tag{13}\]

Figure 3.66. The range of permeability coefficients for various ions, solutes and water in plant membranes (vertical bars) and artificial phospholipids (arrows). Note that the permeability of ions as they cross plant membranes is higher than through the artificial lipid bilayer.
The constant of proportionality in this case is the permeability coefficient (\( P_s \)), expressed in m s–1. When \( P_s \) is large, solutes will diffuse rapidly across a membrane under a given concentration gradient. \( P_s \) embodies several factors: partitioning between solution and membrane, membrane thickness and diffusion coefficient of the solute in the membrane which may be largely depend on specific transporters. It can be used to compare different membranes and to compare treatments that might alter the ability of a solute to move across the membrane.
Note that Equation 13 assumes that the concentration gradient is only across the membrane, and that when the permeability coefficient is measured, concentration gradients leading to diffusion in solutions adjacent to the membrane will not be significant. If the two solutions are stirred rapidly then this will help to justify this assumption. However, there is always an unstirred layer adjacent to the membrane through which diffusion occurs, and for molecules that can permeate the membrane very rapidly the unstirred layer can be a problem for the correct measurement of permeability.
Solute movement across membranes can be across the lipid phase of the membrance, depending on size, charge and polarity, and it can be assisted by transport proteins embedded in the membrane.
The range of permeability coefficients for various ions, solutes and water in plant membranes is shown in Figure 3.66, along with the permeability of artificial phospholipid bilayers. The permeability of ions as they cross membranes is higher than that through the artificial lipid bilayer, especially for potassium, indicating the presence of specialised permeation mechanisms, ion transporters, in plant membranes. Water permeabilities are high in both plant and artificial membranes but can range over an order of magnitude in plant membranes. This variability may be partially accounted for by the activity of aquaporins.
A comparison of artificial lipid membranes with biological membranes supports this notion because it shows that many molecules and ions permeate biological membranes much faster than would be predicted on the basis of oil solubility and size (Figure 3.66). For these solutes there are transport proteins in biological membranes that increase solute permeability.
Plant membranes are ideally semipermeable, that is, water permeability is much larger than solute permeability.
The degree of semi-permeability that a membrane shows for a particular solute is measured as the reflection coefficient, \( \sigma \):
\[ \sigma = 1 - \frac{\text{Solute Permeability}}{\text{Water Permeability}} \tag{15}\]
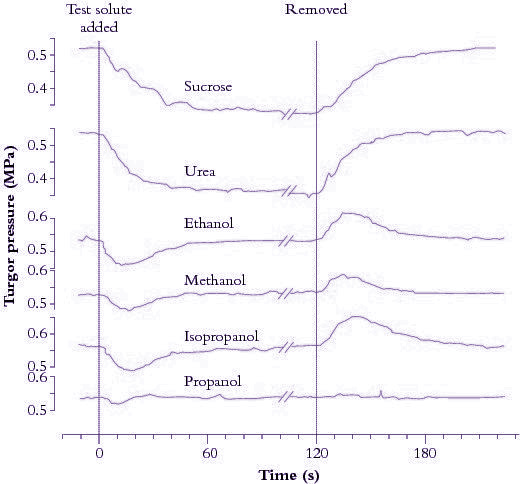
Figure 3.67. Turgor pressure (\( P \)) in a Tradescantia virginiana epidermal cell as a function of time after the external osmotic pressure was changed with different test solutes. Measurements were made with a pressure probe. (Tyerman and Steudle 1982)
If a plant cell or an epidermal strip is bathed in solution, the reflection coefficient for a particular solute can also be considered as the ratio of the effective osmotic pressure versus the actual osmotic pressure in the bathing solution.
The reflection coefficient usually ranges between zero and one, being zero for molecules with properties similar to water, like methanol, to one for large non-polar molecules like sucrose.
Figure 3.67 shows turgor pressure (\( P \)) in a Tradescantia virginiana epidermal cell as a function of time after the external osmotic pressure was changed with different test solutes. The initial decrease in \( P \) is due to water flow out of the cell and is larger for solutes with a reflection coefficient near one (sucrose and urea). Propanol induces no drop in \( P \), indicating that its reflection coefficient is zero. Subsequent increase in \( P \) is due to penetration of particular solutes such as alcohol across the cell membrane. Water flows osmotically with the solute thereby increasing \( P \) to its original value. Removing solutes reverses osmotic effects. That is, a decrease in \( P \) follows the initial inflow of water as solutes (e.g. alcohols) diffuse out of cells.
The pressure probe apparatus is illustrated in Figure 3.68(a).
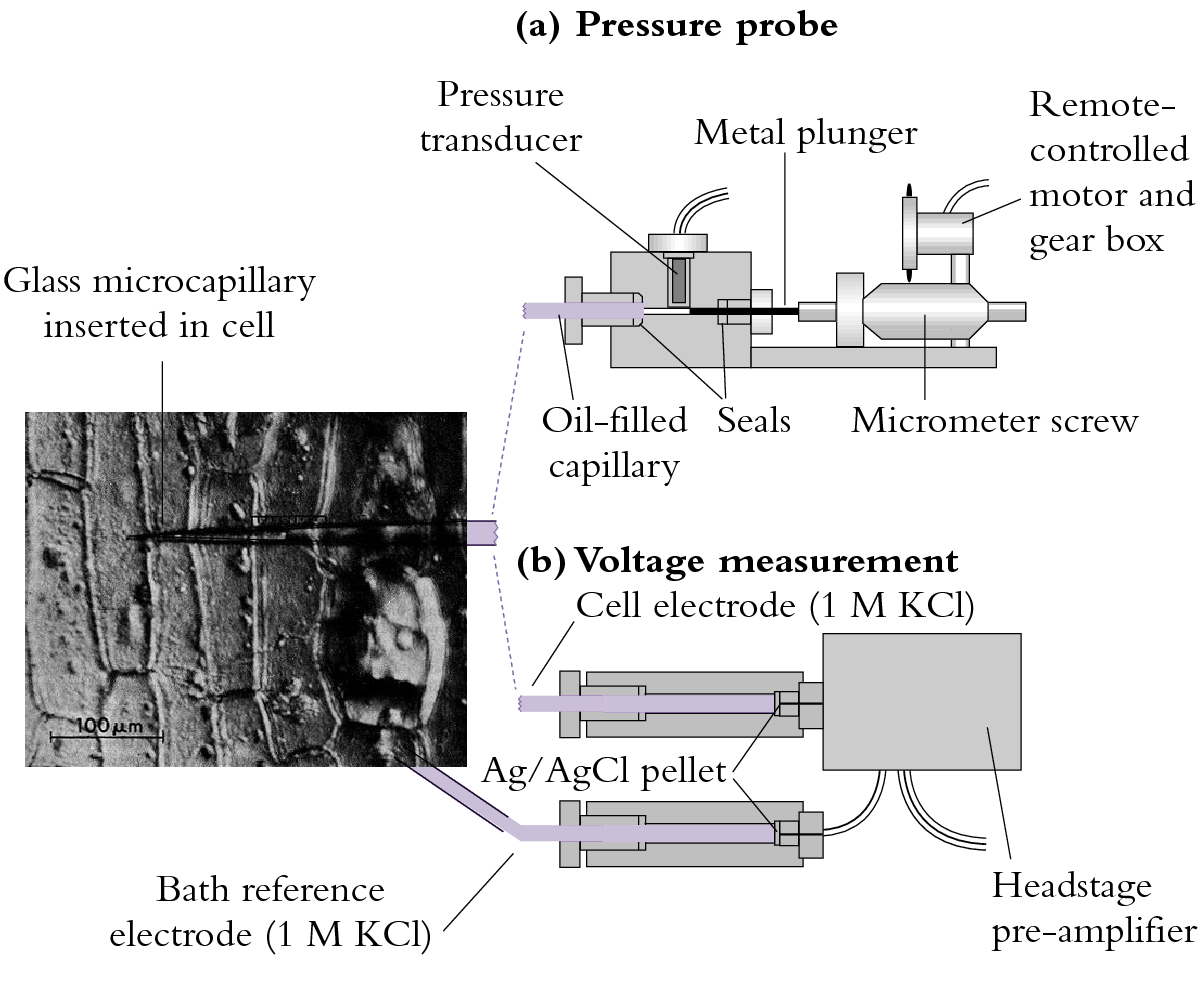
Figure 3.68 (a) A miniaturised pressure probe. An oil-filled capillary of about 1 µm diameter is inserted into a cell whose turgor pressure (\( P \)) is transmitted through the oil to a miniature pressure transducer. The voltage output of the transducer is proportional to \( P \). A metal plunger acting as a piston can be used via remote control to vary cell \( P \).
Using the pressure probe to measure turgor pressure, \( P \), the membrane is found to be ideally semipermeable for sucrose (\( \sigma = 1 \)); that is, the membrane almost totally ‘reflects’ sucrose. Over long periods, sucrose is taken up slowly but permeability relative to water is negligible. In this case, the change in \( P \) would be equivalent to the change in \( \pi \). If \( \sigma \) is near zero, then water and the solute (say, propanol) are equivalent in terms of permeability. No change in \( P \) can be generated across a cell wall if \( \sigma \) is zero.
Diffusion of neutral molecules at low concentrations is driven by differences in concentrations across membranes, as explained above. There are other forces that may influence solute diffusion, including the voltage gradient when considering movement of charged molecules (ions) and the hydrostatic pressure when considering movement of highly concentrated molecules (such as water in solutions). These forces can be added to give the total potential energy of a particular molecule (\( \mu_s \)) relative to a reference value (\( \mu_s^* \)):
\[ \mu_s = \mu_s^* + RT\ln C_s + z_s FE + V_sP \tag{16}\]
Gravitational potential energy could also be added to this equation if we were to examine the total potential over a substantial height difference, but for movement of molecules across membranes this is not relevant.
The concentration term (\( RT\ln C_s \)) is a measure of the effect on chemical potential of the concentration of solutes (actually the activity of the solutes which is usually somewhat less than total concentration). The gas constant, \(R\) (8.314 joules mol–1K–1), and absolute temperature, \(T\) (in degrees Kelvin, which is equals 273 plus temperature in degrees Celsius), account for the effects of temperature on chemical potential.
Incidentally, from this term the well-known van‘t Hoff relation is derived for osmotic pressure \(\pi\), as given at the beginning of this chapter:
\[ \pi = RTC \tag{1} \]
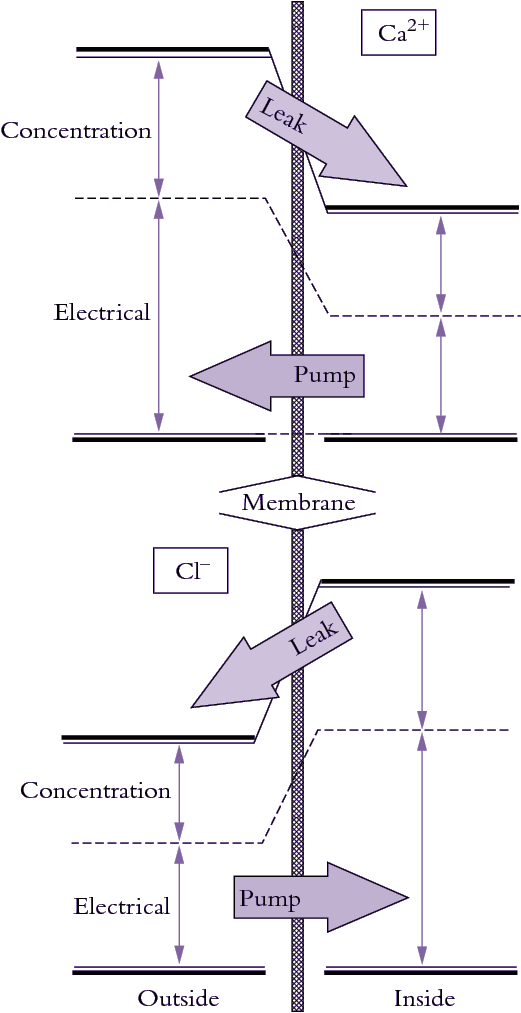
Figure 3.69. Illustration of how electrical and concentration terms contribute to electrochemical potential of ions. Calcium (top) commonly tends to leak into cells and must be pumped out whereas chloride tends to leak out and must be pumped in to be accumulated.
where \(R\) is the gas constant (8.31 joules mol–1K–1), \(T\) is the absolute temperature in degrees Kelvin (273 plus degrees Celsius), and \( C \) is the solute concentration (Osmoles L-1). At 25 ºC, \(RT\) equals 2.48 liter-MPa per mole, and (\( \pi \)) is in units of MPa. Hence a concentration of 200 mOsmoles L-1 has an osmotic pressure of 0.5 MPa.
The electrical term (\( z_s FE \) ) is a measure of the effect of voltage (\( E \) ) on chemical potential. The charge on a solute (\( z \)) determines whether an ion is repelled or attracted by a particular voltage. Electrical charge and concentration are related by the Faraday constant (\( F\) ) which is 96,490 coulombs mol–1. The electrical and concentration terms form the basis of the Nernst equation (see below).
The pressure term measures the effect of hydrostatic pressure on chemical potential, where \(P = \text{Pressure}\) and \( \overline{V}_s \) is the partial molar volume of the solute.
Molecules diffuse across a membrane down a chemical potential gradient, that is, from higher to lower chemical potential. Diffusion continues until the difference in chemical potential equals zero, when equilibrium is reached. The direction of a chemical potential gradient relative to transport of a molecule across that membrane is important because it indicates whether energy is or is not added to make transport proceed (Figure 3.69). Osmotic ‘engines’ must actively pump solutes against a chemical potential gradient across membranes to generate \(P\) in a cell. Sometimes ions move against a concentration gradient even when the flux is entirely passive (no energy input) because the voltage term dominates the concentration term in Equation 16. In this case, ions flow according to gradients in electrical and total chemical potential. For this reason, the chemical potential of ions is best referred to as the electrochemical potential.
Ions such as potassium and chloride (K+ and Cl–) are major osmotic solutes in plant cells. Deficiency of either of these two nutrients can increase a plant’s susceptibility to wilting. Most other inorganic nutrients are acquired as ions and some major organic metabolites involved in photosynthesis and nitrogen fixation bear a charge at physiological pH. For example, malic acid is a four-carbon organic acid that dissociates to the divalent malate anion at neutral pH. Calcium (Ca2+) fluxes across cell membranes are involved in cell signalling and although not osmotically significant they play a crucial role in the way cells communicate and self-regulate. Finally, some ions are used to store energy but need not occur at osmotically significant concentrations. Cell membranes from all kingdoms use hydrogen (H+) ions (protons) in one way or another to store energy that can be used to move other ions or to manufacture ATP (Chapter 2). The highest concentration of H+ that occurs is only a few millimoles per litre yet H+ plays a central role in energy metabolism.
To understand ion movement across membranes, two crucial points must be understood: (1) ionic fluxes alter and at the same time are determined by voltage across the membrane; (2) in all solutions bounded by cell membranes, the number of negative charges is balanced by the number of positive charges. Membrane potential is attributable to a minute amount of charge imbalance that occurs on membrane surfaces. So at constant membrane potential the flux of positive ions across a membrane must balance the flux of negative ions. Most biological membranes have a capacitance of about 1 microFarad cm–2 which means that to alter membrane voltage by 0.1 V, the membrane need only acquire or lose about 1 pmol of univalent ion cm–2 of membrane. A univalent ion is one with a single positive (e.g. K+) or negative (e.g. Cl–) atomic charge. In a plant cell of about 650 pL, this represents a change in charge averaged over the entire cell volume of 12 nmol L–1!
The membrane voltage or membrane potential difference, as it is sometimes called, can be measured by inserting a fine capillary electrode into a plant cell (Figure 3.68b). Membrane voltage is measured with respect to solution bathing the cell and in most plant cells the voltage is negative across the plasma membrane. That is, the cytoplasm has a charge of –0.1 to –0.3 V (–100 to –300 mV) at steady state with occasional transients that may give the membrane a positive voltage. The tonoplast membrane that surrounds the central vacuole is generally 20 to 40 mV more positive than the cytoplasm (still negative with respect to the outside medium).
Figure 3.68. (a) Techniques employing fine glass capillaries to probe plant cells. (b) A probe for measuring membrane voltage. The capillary is filled with 1 mol L-1 KCl and connected to a silver/silver chloride electrode that acts as an interface between solution voltage and input to the amplifier. A voltage is always measured with respect to a reference (in this case, a bath electrode). The headstage amplifier is close to the electrodes to minimise noise.
Cell membrane voltages can be affected by ion pumps, diffusion potential and fixed charges on either side of the membrane.
Special mention needs to be made of one such fixed charge which arises from galacturonic acid residues in cell walls. Although cations move to neutralise this fixed negative change, there is still a net negative potential associated with cell walls (Donnan potential). In spite of being external to the plasma membrane, the Donnan potential is in series with it and probably adds to what we measure as the membrane potential with electrodes.
Most charge on macromolecules in the cytoplasm is also negative (e.g. nucleic acids, proteins) and because of their size it can be regarded as a fixed negative charge. This has consequences on the water relations of the cytoplasm in that they exert a significant osmotic potential, even though not in solution, as do the clay particles in soil (Passioura 1980).
Different ions have different permeabilities in membranes. Potassium, for example, is usually the most permeable ion, entering under most conditions about 10 to 100 times faster than Cl– Since ions diffuse at different rates across membranes, a slight charge imbalance occurs and gives rise to a membrane voltage (Figure 3.69). This voltage in turn slows down movement of the rapidly moving ion so that the counter-ion catches up. The result is that when net charge balance is achieved, a diffusion potential has developed that is a function of the permeabilities (\( P_\text{ion} \)) of all diffusible ions present and concentrations of each ion in each compartment.
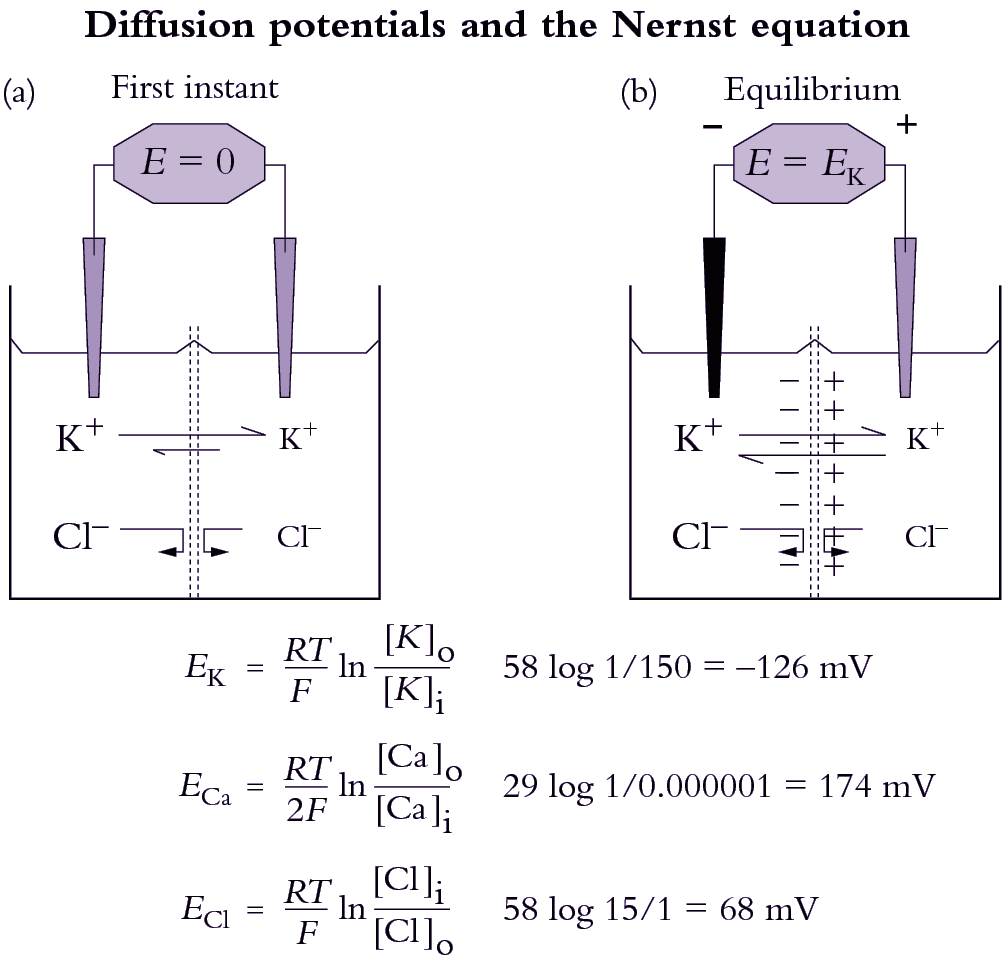
Figure 3.70. How a diffusion potential develops through differential movement of an ion across a membrane that is permeable to K+ but not Cl-. The left hand compartment (representing the cytoplasm) has the higher concentration of K+ and Cl-, as indicated by the size of the letters. The right hand compartment represents the apoplast (cell wall). Initially (a), a minute amount of K+ crosses the membrane along its concentration gradient, and creates a positive charge in the right-hand compartment as K+ concentration there rises above Cl- concentration. At equilibrium (b), a diffusion potential is established, and further movement of K+ is prevented. Concentrations never equalise on both sides because K+ is the only species able to move through the membrane.
The Goldman equation describes this phenomenon and gives the membrane voltage (\( \Delta E \) ) that would develop due to diffusion of ions. The Goldman equation for the ions that mostly determine this diffusion potential (K+, Na+ and Cl–) is given by:
\[ \Delta E = \frac{RT}{F} \ln \frac{P^{}_K C_K^o + P^{}_{Na}C_{Na}^o + P^{}_{Cl}C_{Cl}^i}{P^{}_K C_K^i + P^{}_{Na}C_{Na}^i + P^{}_{Cl}C_{Cl}^o} \tag{17}\]
The superscripts refer to the inside (i) or outside (o) of the membrane and \( R \), \( T \), \( F \) and \( C \) are defined elsewhere (Equation 4.5). Note that the concentration terms for Cl– are reversed in the numerator and denominator compared to the cations. This is because Cl– is the only anion represented. Many texts do not include H+ in the Goldman equation because, in spite of high permeability of H+, diffusion of H+ is unlikely to have a strong effect on ΔE at such low (micromolar) concentrations. However, membrane potential is occasionally dominated by the diffusion of H+, indicating that H+ permeability must be exceedingly high. For example, local variations in pH cause alkaline bands to form on Chara corallina cells and in the leaves of aquatic plants at high pH.
When one ion has a very high permeability compared to all other ions in the system the membrane will behave as an ion-sensitive electrode for that ion (e.g. Figure 4.7). A pH electrode which is sensitive to H+ flux across a glass membrane serves as an analogy. In the case of a single ion, the Goldman equation can be reduced to the simpler Nernst equation that yields the equilibrium membrane potential which would develop for a particular concentration gradient across a membrane.
\[ \Delta E = \frac{RT}{zF} \ln \frac{C_o}{C_i} \tag{18}\]
where \( R \) and \( T \) are the gas constant and temperature (degrees Kelvin) and \( F \) is the Faraday constant. Typical charges on ions (\( z \)) would be –1 for Cl-, +1 for K+) and so on. This term in the Nernst equation gives the correct sign for the calculated membrane potential.
The Nernst equation is routinely used by electro-physiologists to calculate the equilibrium potential for each ion. Theoretical equilibrium potentials can then be compared with the actual membrane potential in order to decide whether the membrane is highly permeable to one particular ion. For example, in many plant cells there are K+ channels that open under particular circumstances. When this occurs, the membrane becomes highly permeable to K+ and the measured membrane potential very nearly equals the Nernst potential for K+. The Nernst equation can also be used as a guide in deciding whether there is active transport through a membrane. For example, when the measured membrane potential is less negative than the most negative Nernst potential, an electrogenic pump must be engaged for K+ to enter the cell (Table 4.1). If the membrane potential is less negative than the Nernst potential and if a K+ channel were open then K+ would leak out of the cell. For K+ uptake to occur with such a gradient for passive efflux then energy would need to be generated.
Equation 4.7 can be rewritten with constants solved and log10 substituted for the natural logarithm. This yields a useful form as follows,
\[ \Delta E = \frac{58}{z} \log_{10} \frac{C_o}{C_i} \tag{19} \]
showing that 10-fold differences in concentration across a membrane are maintained by a 58 mV charge separation for monovalent ions. For example, -58 mV will keep K+ concentrations 10 times higher inside a cell than in the external medium and Cl– concentrations 10 times lower. Plasma membranes are normally about -116 mV, which would keep K+ concentrations inside a cell 100 times higher and Cl- concentrations 100 times lower than in the external solution.
Internal membranes have a different electrical potential, the mitochondria being more negative than the plasma membrane (around -180 mV) and the chloroplast and tonoplast being slightly positive (around +50 mV).
The concentration of an ion inside a cell membrane (\( C_i \)) that would occur at equilibrium for any \( C_o \) and \( \Delta E \) can be calculated by rearranging the above equation as:
\[ \log_{10} C_i = \log_{10} C_o - \frac{z\Delta E}{58} \tag{20} \]
remembering that \( z \) and \( \Delta E \) can be positive or negative, depending on the ion and the particular cell membrane being considered.
Plant and animal membranes have much higher permeability to water than can be explained by diffusion rates through a lipid bilayer. Furthermore, the activation energy for diffusion of water across a plant membrane is lower than would be expected across a lipid bilayer, where water has to overcome the high-energy barrier of partitioning into a very hydrophobic oily layer. Some reports put the activation energy for water flow across membranes as low as the value for free diffusion of water. In other words, water enters the membrane about as readily as it diffuses through a solution. This suggests that water is moving across the membrane through a pathway other than the lipid, perhaps some kind of water pore or water channel. Since the discovery of water channel proteins in animal cell membranes, molecular biologists discovered that similar proteins exist in plants.
Water channels, like ion channels, are proteins embedded in membranes that facilitate the passive transport (non-energised flow) of water or ions down their respective energy gradients. Movement of a solute or water through these transport proteins is not coupled to movement of any other solute, and does not require ATP. The proteins that facilitate passive transport are diverse; some are specific for particular ions and allow high transport rates per protein molecule (ion channels), some are specific for water (water channels or aquaporins) and some are specific for neutral solutes and may have slower transport rates per protein molecule.
Why are there water channels in membranes when the lipid itself is already somewhat permeable to water? There are several rationales for the presence of water channels in plant membranes. One is that specialised transport proteins can control water flow. That is, a water channel protein may be turned on and off, for example by phosphorylation, while water permeability of the lipid is essentially constant. In animal cells, such as in the kidney, water channels are controlled by antidiuretic hormones. Plant hormones could also influence the function of water channels. A second rationale for the presence of water channnels is to balance water flow and prevent bottlenecks. In the root, water channels are most abundent in the endodermis and inner stele where water flow across membranes is rapid.
The approach to studying water channels has been to inject genetic material from plants into Xenopus oocytes (a particular type of frog’s egg). The Xenopus oocyte is particularly useful because it is large, enabling observations of cell response to foreign proteins. It is one of several expression systems along with Chara (giant algal cells) and yeast cells. cDNA arising from screens of cDNA libraries can be injected into the Xenopus nucleus, or poly (A)+-RNA can be injected into the oocyte cytoplasm where it is translated. Plant water transport proteins expressed in the oocyte plasma membrane result in physiological changes; for example, the oocyte swells rapidly when the external osmotic pressure in the bathing medium is lowered (Figure 3.71a). The first plant aquaporin gTIP (Tonoplast Integral Protein) that was discovered occurs in the tonoplast and probably accounts for its high water permeability. Provided that the increase in water permeability is not a consequence of some other change or a side effect of other types of transport, it can be concluded that the protein catalyses transport of water across membranes.
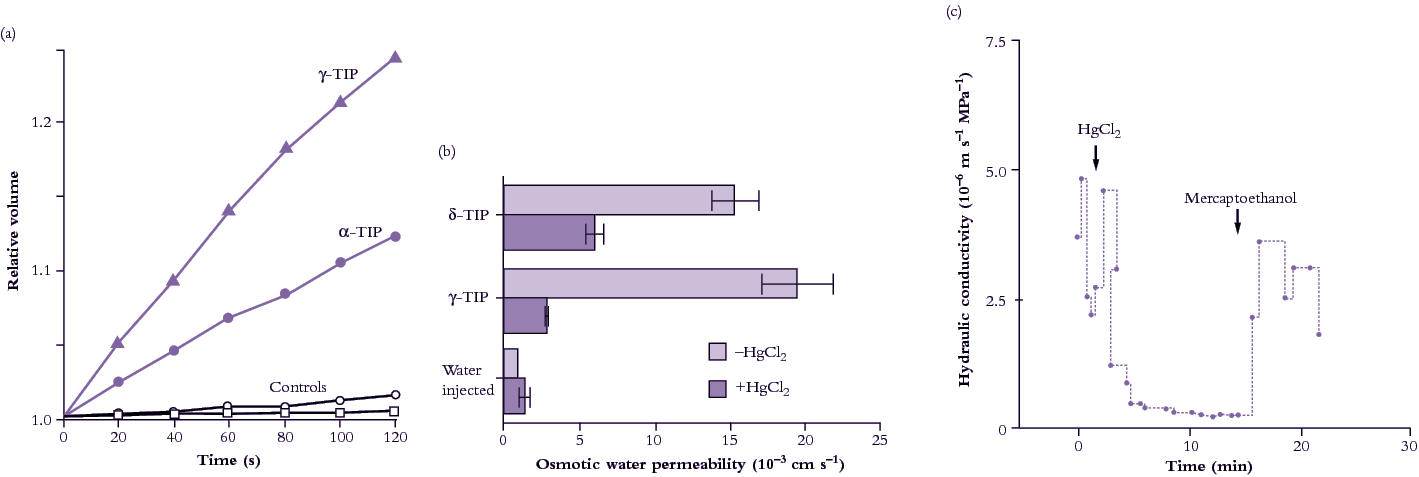
Figure 3.71 Evidence for presence of aquaporins (water channels) in plant membranes. (a) Change in volume of Xenopus oocytes injected with two TIP proteins after lowering osmotic pressure of the external medium (Maurel et al. 1995). (b) Sensitivity of two TIP proteins expressed in Xenopus oocytes to mercuric chloride (HgCl2), a general inhibitor of aquaporins (Daniels et al. 1996). (c) Inhibitory effect of HgCl2 on hydraulic conductivity of the freshwater alga Chara corallina measured with a pressure probe (Schütz and Tyerman 1997).
Water channels can be inhibited by mercuric chloride when expressed in Xenopus occytes (Figure 3.71b), and also in plant cells (Figure 3.71c). Inhibition is reversed by applying mercaptoethanol to block the action of HgCl2. Under mercury inhibition, the activation energy of water flow increases markedly indicating that water flow is now restricted to diffusional flow across the lipid bilayer, that is, aquaporins are blocked.
Plants have many aquaporin genes. For example, Arabidopsis thaliana has 35 and rice (Oryza sativa) has 33. Proteins encoded by aquaporin genes are localized in the plasma membrane, tonoplast and endo membranes and classed as Plasma membrane Intrinsic Proteins (PIPs), Tonoplast Intrinsic Proteins (TIPs), Nodulin26-like Intrinsic Proteins (NIPS), Small basic Intrinsic Proteins (SIPs) or X Intrinsic Proteins (XIPs) (Luu and Maurel 2013). Within membranes, clustering of PIPs in membrane rafts has been observed, and there is variation in the lateral mobility for different aquaporins. Of the many aquaporin proteins in plants, some transport water only (up to 109 molecules per second) and others are permeable to a range of neutral solutes such as gases (carbon dioxide, ammonia), metalloids (boron, silicon, arsenic), or reactive oxygen species (hydrogen peroxide). The transcription, translation, trafficking, and gating of PIPs are regulated by environmental and developmental factors involving signalling molecules, phytohormones and the circadian clock (Chaumont and Tyerman 2014). The transcription, translation, trafficking, and gating of PIPs are regulated by environmental and developmental factors involving signalling molecules, phytohormones and the circadian clock (Chaumont and Tyerman 2014).
When PIP genes are transcribed, their mRNA is translated in the rough endoplasmic reticulum (ER), and the proteins targeted to the plasma membrane. PIPs belonging to the PIP2 group form homo-oligomers, or hetero-oligomers by associating with PIP1 isoforms. Some PIP2s contain a diacidic motif in their N terminus that acts as an ER export signal. It may be recognized by Sec24 which is the main “cargo” selection protein of the coat protein complex COPII that mediates vesicle formation at the ER export sites. PIP oligomers then transit through the Golgi apparatus and trans-Golgi network and are then loaded into secretory vesicles and routed to the plasma membrane (Figure 3.72). Insertion of PIPs into the plasma membrane is mediated by a protein that regulates vesicle fusion (the “syntaxin” SYP121). The plasma-membrane localized PIPs can be recycled internally: once internalized in vesicles, PIPs are delivered to the trans-Golgi network before being routed back to the plasma membrane or directed into lytic vacuoles for degradation (Figure 3.72). Salt stress causes dephosphorylation and internalization of PIPs, and drought stress induces ubiquitylation of PIPs, which are then degraded in the proteasome.
Aquaporins assemble as homo- or hetero-tetramers, each monomer acting as an independent water channel. The structure of an aquaporin monomer (Figure 3.72) consists of six membrane-spanning α-helices connected by five loops, with both N and C termini facing the cytosol. Two loops form two short hydrophobic α-helices dipping halfway into the membranes, which, together with the membrane-spanning helices, create a pore with high specificity (Murata et al. 2000).
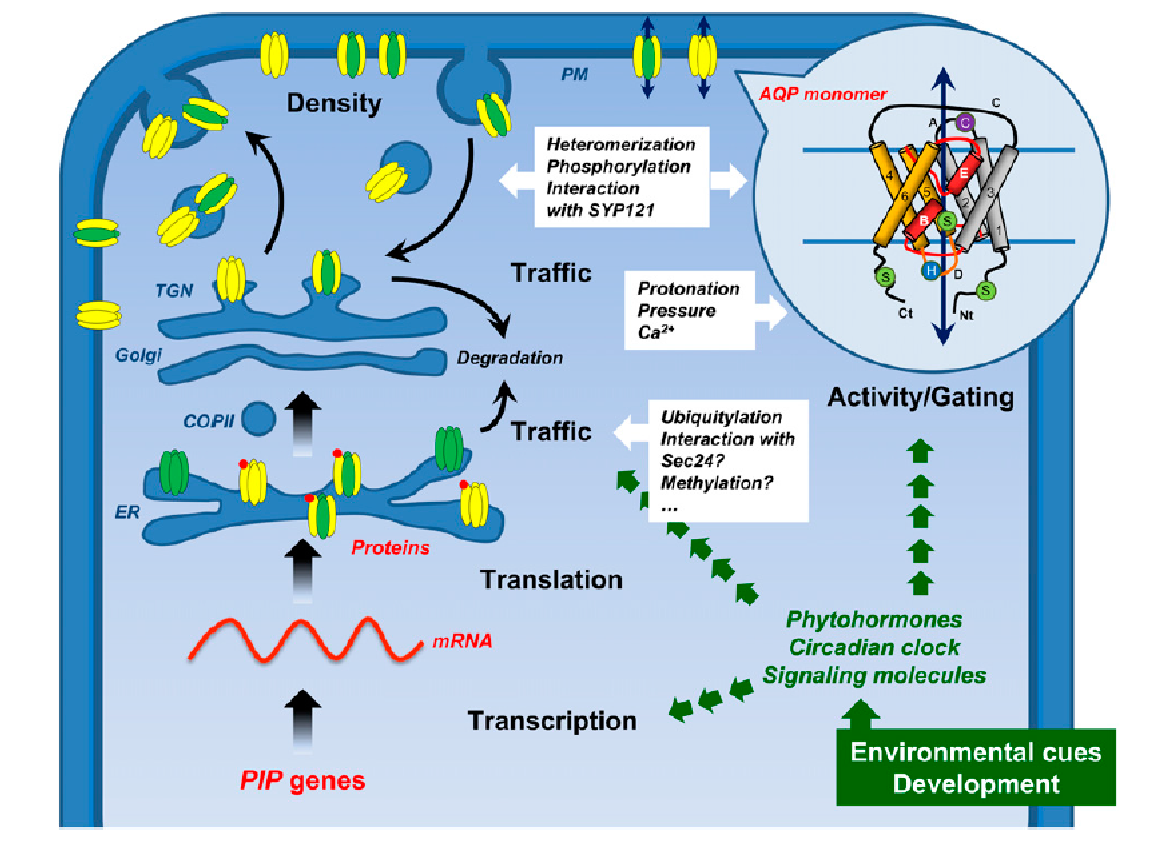
Figure 3.72 Formation and trafficking of PIPs within a plant cell. PIPs belonging to the PIP2 group (in yellow) form homo- or heterooligomers by associating with PIP1 isoforms (in green). PIP oligomers transit through the Golgi apparatus and trans-Golgi network (TGN) and are then loaded into secretory vesicles and routed to the plasma membrane. In the circle is shown the topological structure of the aquaporin monomer AQP1 (Murata et al. 2000), with six membrane-spanning α-helices (1-6) connected by five loops (A-E). The loops B and E form two short hydrophobic α-helices (in red) dipping halfway into the membranes, which, together with the membrane-spanning helices, create a pore with high specificity. From Chaumont and Tyerman (2014). Reproduced from F. Chaumant and S.D. Tyerman, Plant Phys 164: 1600-1618, plantphysiol.org. Copyright American Society of Plant Biologists.
Aquaporins play a central role in regulating plant water relations. Water diffusion across cell membranes is facilitated by aquaporins that provide plants with the means to rapidly and reversibly modify water permeability. This is done by changing aquaporin density and activity in the membrane, including post-translational modifications and protein interaction that act on their trafficking and gating. At the whole organ level aquaporins modify water conductance and gradients at key “gatekeeper” cell layers that impact on whole plant water flow and plant water potential. In this way they may act in concert with stomatal regulation.
PIP and TIP expression is higher during the day than the night, and correlates with diurnal changes in transpiration. It is likely under circadian regulation. Expression can correlate with changes in hydraulic conductivity, Lp, so that aquaporins are more abundant or have higher activity at times when stomatal conductance is higher. Over a diurnal cycle, Lp can change 2-5 fold and so can PIP transcript activity or protein abundance (Chaumant and Tyerman 2014). This occurs in both roots and shoots.
This section has shown how the flow of water and ions across membranes are linked. The function of membrane transport in regulating nutrient supply is covered in Chapter 4.
Atkins CA, Pate JS, Layzell DB (1979) Assimilation and Transport of Nitrogen in Nonnodulated (NO3-grown) Lupinus albus L. Plant Phys 64: 1078-1082.
Barberon M, Geldner N (2014) Radial transport of nutrients: The plant root as a polarized epithelium. Plant Physiol 166: 528–537
Bramley H, Turner NC, Turner DW, Tyerman SD (2009) Roles of morphology, anatomy, and aquaporins in determining contrasting hydraulic behavior of roots. Plant Physiol 150: 348-364
Chaumont F, Tyerman SD (2014) Aquaporins: highly regulated channels controlling plant water relations. Plant Physiol 164: 1600-1618
Daniels MJ, Chaumont F, Mirkov TE, Chrispeels MJ (1996) Characterization of a new vacuolar membrane aquaporins sensitive to mercury at a unique site. Plant Cell 8: 587-599
Dixon HH (1914) Transpiration and the ascent of sap in plants. Macmillan, London
Dixon HH, Joly J (1894) On the ascent of sap. Phil Trans Royal Soc (London) Series B, 186: 563-576
Findlay GP, Findlay N (1975) Anatomy and movement of the column of Stylidium. Aust J Plant Physiol 2: 597-621
Geldner N (2013) The endodermis. Annu Rev Plant Biol 64: 531–558
Hose E, Clarkson DT, Steudle E et al. (2001) The exodermis: a variable apoplastic barrier. J Exp Bot 52: 2245-2264
Huang CX, van Steveninck RFM (1988) Effect of moderate salinity on patterns of potassium, sodium and chloride accumulation in cells near the root tip of barley: Role of differentiating xylem vessels. Physiol Plant 73: 525-533
Jeschke WD, Pate JS, Atkins CA (1986) Effects of NaCl salinity on growth, development, ion transport and ion storage in white lupin (Lupinus alba L. cv. Ultra). J Plant Physiol 124: 237-274
LaBarbera M (1990) Principles of design of fluid transport systems in zoology. Science 249: 992-1000
Kramer PF, Boyer JS (1995) Water relations of plants and soils. http://udspace.udel.edu/handle/19716/2830
Maurel C, Kado RT , Guern J, Chrispeels M (1995) Phosphorylation regulates the water channel activity of the seed-specific aquaporin α-TIP. EMBO J 14: 3028-3035
Melchior W, Steudle E (1993) Water transport in onion roots: Changes of axial and radial hydraulic conductivities during root development. Plant Physiol 101: 1305-1315
McCully ME (1994) Accumulation of high levels of potassium in the developing xylem elements in roots of soybean and some other dicotyledons. Protoplasma 183: 116-125
McCully ME , Canny MJ (1988) Pat hways and processes of water and nutrient movement in roots. Plant Soil 111: 159-170
Munns R (1985) Na+, K+ and Cl- in xylem sap flowing to shoots of NaCl-treated barley. J Exp Bot 36: 1032-1042
Munns R, Passioura JB (1984) Hydraulic resistance of plants. III. Effects of NaCl in barley and lupin. Aust J Plant Physiol 11: 351-359
Nobel PS (2005) Physicochemical and environmental plant physiology (3rd edition). Elsevier Academic Press, Burlington, MA
Passioura JB (1980) The meaning of matric potential. J Exp Bot 31:1161-1169
Passioura JB (2010) Plant–Water Relations. In: Encyclopedia of Life Sciences. Wiley, Chichester. DOI: 10.1002/9780470015902.a0001288.pub2
Passioura JB (2006) The perils of pot experiments. Funct Plant Biol 33: 1075–1079
Passioura JB (1980) The transport of water from soil to shoot in wheat seedlings. J Exp Bot 31: 333-345
Perumalla CJ, Peterson CA, Enstone DE (1990) A survey of angiosperm species to detect Casparian bands. I. Roots with a uniseriate hypodermis and epidermis. Bot J Linnean Soc 103: 93-112
Peuke AD (2010) Correlations in concentrations, xylem and phloem flows, and partitioning of elements and ions in [intact plants. A summary and statistical re-evalution of modelling experiments in Ricinus communis. J Exp Bot 61: 6344-655
Plett DC, Moller IS (2010) Na+ transport in glycophytic plants. Plant Cell Environ 33: 612-626
Schütz K, Tyerman SD (1997) Water channels in Chara correlina. J Exp Bot 48: 1511-1518
Strazburger E (1893) Über das saftsteigen. Fischer: Jena, Germany.
Tyerman SD, Steudle E (1982) Comparison between osmotic and hydrostatic water flows in a higher plant cell. Aust J Plant Physiol 9: 416-479
Watt M, Magee LJ, McCully ME (2008) Types, structure and potential for axial water flow in the deepest roots of field-grown cereals. New Phytol 178: 135-146