1.0-Ch-Fig-1.13.jpeg
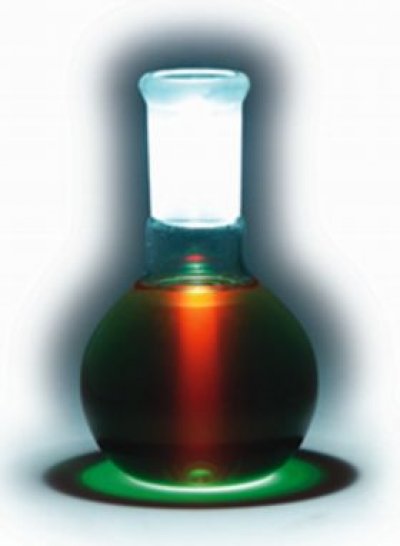
Figure 1.13 Catching the Light is a demonstration of photosynthesis in action. Photosynthesis begins when light is absorbed by chlorophyll. The flask contains chlorophyll extracted from spinach leaves. When a beam of light passes through the extract, the chlorophyll absorbs this energy. But because the chlorophyll in the flask has been isolated from the plant, energy cannot be converted and stored as sugar. Instead it is released as heat and red fluorescence. Note the green ring below the flask which is transmitted light, the colour we normally perceive for chlorophyll. The colour of a leaf is green because it reflects and transmits green light but absorbs the blue and red components of white light. (Image courtesy R. Hangarter)
A dilute solution of leaf chlorophyll in organic solvent appears green when viewed in white light. Wavelengths corresponding to bands of blue and red have been strongly absorbed (Figure 1.8), whereas mid-range wavelengths corresponding to green light are only weakly absorbed, hence the predominance of those wavelengths in transmitted and reflected light. However, when viewed at right angles to the light source, the solution will appear deep red due to energy re-emitted as fluorescence (Figure 1.13). The red colour is evident regardless of the colour of the source light.
Chlorophyll within the two photosystems can absorb energy from incident photons. This absorbed energy can be dissipated by driving the processes of photosynthesis, as heat, or re-emitted as fluorescence radiation. These are all complementary processes so that fluorescence provides an important tool in the study of photosynthesis. The normal processes of photochemistry and electron transport within intact leaves typically reduce the amount of fluorescence, a process referred to as quenching. In the demonstration shown in Figure 1.13 the chlorophyll has been isolated from the plant these processes are disrupted, minimizing the quenching effects.
Fluorescence spectra are invariate, and the same spectrum will be obtained (e.g. Figure 1.8 inset) regardless of which wavelengths are used for excitation. This characteristic emission is especially valuable in identifying source pigments responsible for given emission spectra, and for studying changes in their photochemical status during energy transduction.
Fluorescence emission spectra (Figure 1.8 inset) are always displaced towards longer wavelengths compared with corresponding absorption spectra (Stoke’s shift). As quantum physics explains, photons intercepted by the chromophore of a chlorophyll molecule cause an instantaneous rearrangement of certain electrons, lifting that pigment molecule from a ground state to an excited state which has a lifetime of c. 10–9 s. Some of this excitation energy is subsequently converted to vibrational energy which is acquired much more ‘slowly’ by much heavier nuclei. A non-equilibrium state is induced, and molecules so affected begin to vibrate rather like a spring with characteristic periodicity, leading in turn to energy dissipation as heat plus remission of less energetic photons of longer wavelength.
Apart from their role in photon capture and transfer of excitation energy, photosystems function as energy converters because they are able to seize photon energy rather than lose as much as 30% of it through fluorescence as do chlorophylls in solution. Moreover, they can use the trapped energy to lift an electron to a higher energy level from where it can commence a ‘downhill’ flow via a series of electron carriers as summarised in Figure 1.11.
Protein structure confers very strict order on bound chlorophylls. X-ray crystallographic resolution of the bacterial reaction centre has given us a picture of the beautiful asymmetry of pigment and cofactor arrangements in these reaction centres, and electron diffraction has shown us how chlorophylls are arranged with proteins that form the main light-harvesting complexes of PSII. This structural constraint confers precise distance and orientation relationships between the various chlorophylls, as well as between chlorophylls and carotenoids, and between chlorophylls and cofactors enabling the photosystems to become such effective photochemical devices. It also means that only 2–5% of all the energy that is absorbed by a photosystem is lost as fluorescence.
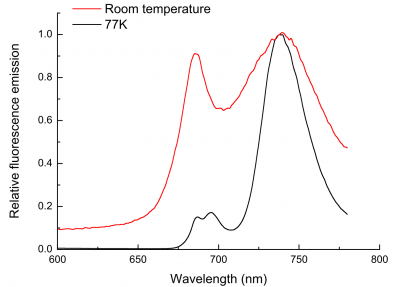
If leaf tissue is held at liquid nitrogen temperature (77 K), photosynthetic electron flow ceases and chlorophyll fluorescence increases, including some emission from PSI (Figure 1.14). Induction kinetics of chlorophyll fluorescence at 77 K have been used to probe primary events in energy transduction, and especially the functional state of photosystems. Present discussion is restricted to room temperature fluorescence where even the small amount of fluorescence from PSII is diagnostic of changes in functional state. This is because chlorophyll fluorescence is not emitted simply as a burst of red light following excitation, but in an ordered fashion that varies widely in flux during continuous illumination. These transient events (Figure 1.15) are referred to collectively as fluorescence induction kinetics, fluorescence transients, or simply as a Kautsky curve in honour of its discoverer Hans Kautsky (Kautsky and Franck 1943).
At room temperature and under steady-state conditions, in vivo Chl a fluorescence from leaves show a characteristic emission spectrum with two distinct peaks around 680–690 nm and 750 nm, both of which mainly originate from photosystem II (Figure 1.14). Because other chlorophyll molecules can reabsorb fluorescence emitted at 680–690 nm within a leaf, the spatial origin of fluorescence can differ between the 680 and 750nm fluorescence that is detected. The fluorescence waveband measured by room temperature fluorometers differs between instruments.
(a) Fluorescence induction kinetics
Figp1.12.png
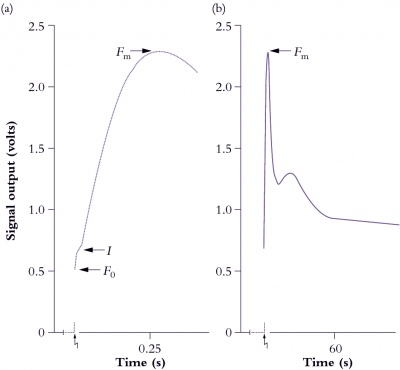
Figure 1.15 A representative chart recorder trace of induction kinetics for Chl a fluorescence at room temperature from a mature bean leaf (Phaseolus vulgaris). The leaf was held in darkness for 17 min prior to excitation (zig-zag arrow) at a photon irradiance of 85 µmol quanta m-2 s-1. The overall Kautsky curve is given in (b), and an expanded version of the first 400 ms is shown in (a). See text for explanation of symbols and interpretation of variation in strength for these ‘rich but ambiguous signals’! (Based on R. Norrish et al., Photosyn Res 4: 213-227, 1983)
Strength of emission under steady-state conditions varies according to the fate of photon energy captured by LHCII, and the degree to which energy derived from photosynthetic electron flow is gainfully employed. However, strength of emission fluctuates widely during induction (Figure 1.15) and these rather perplexing dynamics are an outcome of some initial seesawing between photon capture and subsequent electron flow. Taking Figure 1.11 for reference, complexities of a fluorescence transient (Figure 1.15) can be explained as follows. At the instant of excitation (zig-zag arrow), signal strength jumps to a point called \(F_0\) which represents energy derived largely from chlorophyll molecules in the distal antennae of the LHCII complex which fail to transfer their excitation energy to another chlorophyll molecule, but lose it immediately as fluorescence. \(F_0\) thus varies according to the effectiveness of coupling between antennae chlorophyll and reaction centre chlorophyll, and will increase due to high-temperature stress or photodamage. Manganese-deficient leaves show a dramatic increase in \(F_0\) due to loss of functional continuity between photon-harvesting and energy-processing centres of PSII (discussed further in Chapter 16).
Returning to Figure 1.15, the slower rise subsequent to \(F_0\) is called \(I\), and is followed by a further rise to \(F_m\). These stages reflect a surge of electrons which fill successive pools of various electron acceptors of PSII. Significantly, Fm is best expressed in leaves that have been held in darkness for at least 10–15 min. During this dark pretreatment, electrons are drawn from QA, leaving this pool in an oxidised state and ready to accept electrons from PSII. An alternative strategy is to irradiate leaves with far-red light to energise PSI preferentially, and so draw electrons from PSII via the Rieske FeS centre. The sharp peak (\(F_m\)) is due to a temporary restriction on electron flow downstream from PSII. This constraint results in maximum fluorescence out of PSII at about 500 ms after excitation in Figure 1.15(a). That peak will occur earlier where leaves contain more PSII relative to electron carriers, or in DCMU-treated leaves.
Photochemistry and electron transport activity always quench fluorescence to a major extent unless electron flow out of PSII is blocked. Such blockage can be achieved with the herbicide 3-(3,4-dichlorophenyl)-1,1-dimethyl urea (DCMU) which binds specifically to the D1 protein of PSII and blocks electron flow to QB. DCMU is a very effective herbicide because it inhibits photosynthesis completely. As a consequence, signal rise to \(F_m\) is virtually instantaneous, and fluorescence emission stays high.
Variation in strength of a fluorescence signal from \(F_0\) to \(F_m\) is also called variable fluorescence (\(F_v\)) because scale and kinetics of this rise are significantly influenced by all manner of environmental conditions. \(F_0\) plus \(F_v\) constitute the maximal fluorescence (\(F_m\)) a leaf can express within a given measuring system. The \(F_v/F_m\) ratio, measured after dark treatment, therefore reflects the proportion of efficiently working PSII units among the total PSII population. Hence it is a measure of the photochemical efficiency of a leaf, and correlates well with other measures of photosynthetic effectiveness (discussed further in Chapter 12).
(b) Fluorescence relaxation kinetics
Both the patterns of initial induction of fluorescence, and its subsequent decay once the light has ceased, are important indicators of the underlying structure and function of photosynthetic systems. The latter is referred to as the relaxation kinetics of a fluorescence event. In a typical experiment the chlorophyll is exposed to repeated pulses of light and the relaxation kinetics measured (Figure 1.16).
Figp1.13.png
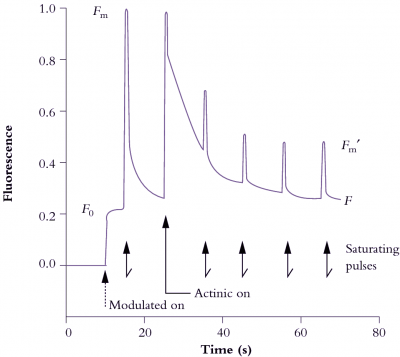
Figure 1.16 Induction and relaxation kinetics of in vivo Chl a fluorescence from a well-nourished radish leaf (Raphanus sativus) supplied with a photon irradiance of actinic light at 500 µmol quanta m-2 s-1 and subjected to a saturating pulse of 9000 µmol quanta m-2 s-1 for 0.8 s every 10 s. Output signal was normalised to 1.0 around the value for \(F_m\) following 30 min dark pretreatment. Modulated light photon irradiance was <1 µmol quanta m-2 s-1. See text for definition of symbols and interpretation of kinetics. (Original data from J. Evans generated on a PAM fluorometer - Heinz Walz GmbH, Germany)
Excellent fluorometers for use in laboratory and field such as the Plant Efficiency Analyser (Hansatech, King’s Lynn, UK) make accurate measurements of all the indices of the Kautsky curve and yield rapid information about photochemical capacity and response to environmental stress. Conventional fluorometers (e.g. Figure 1.15) use a given source of weak light (commonly a red light-emitting diode producing only 50–100 µmol quanta m–2 s–1) for both chlorophyll excitation and as a source of light for photosynthetic reactions.
Even more sophisticated is the Pulse Amplitude Modulated (PAM) fluorometer (Walz, Effeltrich, Germany) which employs a number of fluorescence- and/or photosynthesis-activating light beams and probes fluorescence status and quenching properties. These fluorimeters measure fluorescence excited by a weak source of light that is modulated: that is a beam that applies short, square pulses of saturating light for chlorophyll excitation on top of a constant beam of light that sustains photosynthesis (actinic light). A combination of optical filters plus sophisticated electronics is used to tune the detector to detect only fluorescence excited by the modulated light beam.
In this way, most of the continuous background fluorescence and reflected long-wavelength light is disregarded. Most significantly, relative fluorescence can be measured in full sunlight in the field. The functional condition of PSII in actively photosynthesising leaf tissue is thus amenable to analysis. This instrument also reveals the relative contributions to total fluorescence quenching by photochemical and non-photochemical processes and will help assess any sustained loss of quantum efficiency in PSII. Photosynthetic electron transport rates can be calculated concurrently. These techniques have revolutionised the application of chlorophyll fluorescence to the study of photosynthesis.
Photochemical quenching (\(q_p\)) varies according to the oxidation state of electron acceptors on the donor side of PSII. When QA is oxidised (e.g. subsequent to dark pretreatment), quenching is maximised. Equally, \(q_p\) can be totally eliminated by a saturating pulse of excitation light that reduces QA, so that fluorescence yield will be maximised, as in a PAM fluorometer. Concurrently, a strong beam of actinic light drives photosynthesis (maintaining linear electron flow) and sustaining a pH gradient across thylakoid membranes for ATP synthesis. Those events are a prelude to energy utilisation and contribute to non-photochemical quenching (\(q_n\)). This \(q_n\) component can be inferred from a combination of induction plus relaxation kinetics.
In Figure 1.16, a previously darkened radish leaf (QA oxidised and ready to receive an electron from P680; 'traps open') initially receives weak modulated light (<1 µmol quanta m–2 s–1) that is insufficient to close traps but sufficient to establish a base line for constant yield fluorescence (\(F_0\)). This value will be used in subsequent calculations of fluorescence indices. The leaf is then pulsed with a brief (0.8 s) saturating flash (9000 µmol quanta m–2 s–1) to measure \(F_m\). Pulses follow at 10 s intervals to measure \(F_m^\prime\). Actinic light (500 µmol quanta m–2 s–1) starts with the second pulse and pH starts to build up in response to photosynthetic electron flow. Photosynthetic energy transduction comes to equilibrium with these conditions after a minute or so, and fluorescence indices \(q_n\) and \(q_p\) can then be calculated as follows:
\[ q_n=\frac{F_m - F_m^\prime}{F_m - F_0} \text{, and } q_p=\frac{F_m^\prime-F}{F_m^\prime - F_0} \tag{1.1} \]
Under these steady-state conditions, saturating pulses of excitation energy are being used to probe the functional state of PSII, and by eliminating \(q_p\) the quantum efficiency of light-energy conversion by PSII (\(\Phi_{PSII}\)) can be inferred:
\[ \Phi_{PSII} = \frac{F_m^\prime - F}{F_m^\prime} \tag{1.2} \]
If overall quantum efficiency for O2 evolution is taken as 10 (discussed earlier), then the rate of O2 evolution by this radish leaf will be:
\[ \Phi_{PSII} \times \text{photon irradiance}/10 \;(\mu\text{mol O}_2 m^{-2}s^{-1}) \tag{1.3} \]
In summary, chlorophyll fluorescence at ambient temperature comes mainly from PSII. This photosystem helps to control overall quantum efficiency of electron flow and its functionality changes according to environmental and internal controls. In response to establishment of a ΔpH across thylakoid membranes, and particularly when irradiance exceeds saturation levels, some PSII units become down-regulated, that is, they change from very efficient photochemical energy converters into very effective energy wasters or dissipators (Chapter 12). Large amounts of the carotenoid pigment zeaxanthin in LHCII ensure harmless dissipation of this energy as heat (other mechanisms may also contribute). PSII also responds to feedback from carbon metabolism and other energy-consuming reactions in chloroplasts, and while variation in pool size of phosphorylated intermediates has been implicated, these mechanisms are not yet understood.
