PTQ is the ratio of solar radiation to mean temperature during a phase of crop development. Nix (1976) proposed that PTQ could be used to predict potential crop yield, i.e. the yield when crop management overcomes the limitations of water deficit or surplus, nutrient deficiency, pests and diseases. Solar radiation is the numerator because it drives photosynthesis. Temperature is the denominator because increased temperature leads to faster development and so reduces the time available for photosynthesis.
It is more correct to refer to ‘short-wave global radiation’ than solar radiation because ‘global’ here refers to radiation from the whole sky, including diffuse radiation, but excludes the long waves that have no effect on photosynthesis. The units of PTQ are MJ m-2 d-1 °C-1. In the case of wheat a base temperature of 0°C is acceptable. For warm season crops such as maize, a base temperature of 10°C should be used.
Evidence for the accuracy of PTQ comes from three examples of wheat.
Fig14.11.jpg
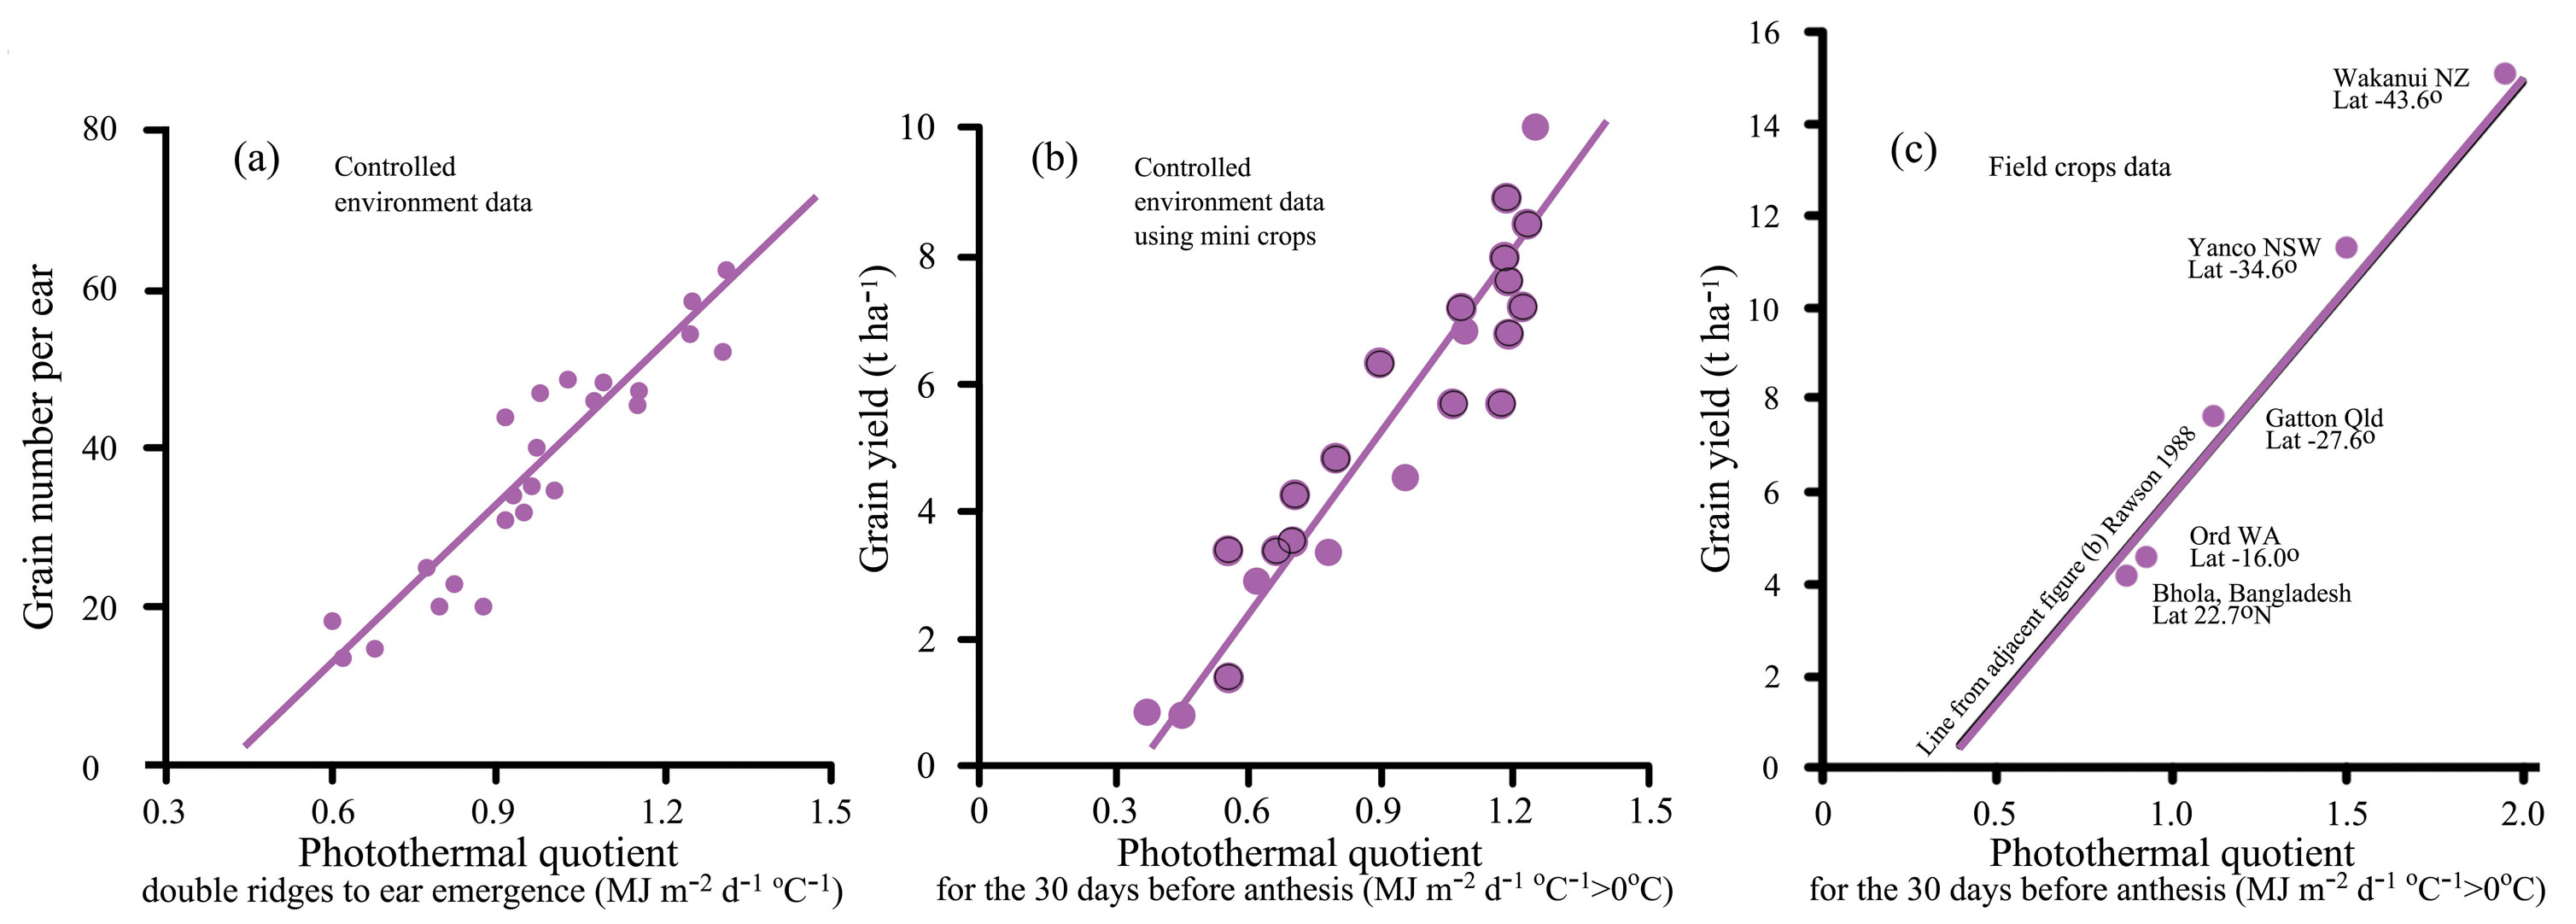
Figure 14.11. (a) Grain numbers per ear in wheat are set by temperature and radiation during the period from floral initiation to flag leaf expansion as shown by transferring plants amongst temperatures throughout the period. Numbers were closely correlated with PTQ (accumulated radiation divided by thermal time for each of the 24 treatments): After Rawson and Bagga 1979. (b) The relation between PTQ and wheat yield in 23 mini-canopies in controlled environments, compiled by Rawson (1988). The correlation between PTQ and grain number in (a) translated to a close correlation between PTQ and yield in (b) because weight per grain is relatively stable in wheat. (c) The same linear relationship from (b), see equation 5 below, closely predicts potential grain yield at field scales at locations ranging over many degrees of latitude: southern hemisphere data from Peake and Angus (2009). This suggests that basic meteorological data of temperature and radiation is all that is needed to provide first order estimates of potential crop yields at new locations.
Figure 14.11a shows results from plants grown in naturally-lit temperature-controlled glasshouses and batches transferred every four days between different temperatures during the phases prior to ear emergence. The number of grains per ear changed with temperature but was better correlated with PTQ than with thermal time alone or radiation alone. Since mean kernel weight is stable for a wheat variety when water and nutrition are adequate, a reasonable hypothesis is that grain yield (grain number x kernel weight) would also be related to PTQ. All that is required to estimate likely potential yield for a location would be local radiation and temperature data. Figure 14.11b shows a test of the grain yield – PTQ relationship with data from temperature-controlled glasshouses and growth chambers using mini-crops of wheat grown in different temperature and radiation environments. The regression fitted to these data was
\[\text{YIELD (t ha}^{-1}) = -3.45+9.59 \text{ PTQ} \tag{14.5}\]
Figure 14.11c shows the line from this equation along with data from commercial crops, including a crop from the Canterbury Plains of New Zealand that set the 2010 world yield record of 15.9 t ha-1.
The close relationship between the prediction and the data suggests that PTQ can predict potential wheat yield from tropical to cool temperate zones. PTQ therefore provides farmers with a benchmark to assess the yield of their crops. If their yields are well below the benchmark there is scope for improved crop management or genetics.
References
Angus JF, Mackenzie DH, Morton R, Schafer CA (1981). Phasic development in field crops II. Thermal and photoperiodic responses of spring wheat. Field Crop Res 4: 269-283
Nix HA (1976) Climate and crop productivity in Australia. In Climate and Rice. International Rice Research Institute, Philippines, pp 495-506
Peake AS, Angus JF (2009) Increasing yield of irrigated wheat in Queensland and northern NSW. Goondiwindi Grains Research Update, March 3-4, 2009. Link: http://www.grdc.com.au/Research-and-Development/GRDC-Update-Papers/2009/11/Increasing-Yield-of-Irrigated-Wheat-in-Queensland-and-Northern-NSW
Rawson HM, Bagga AK (1979) Influence of temperature between floral initiation and flag leaf emergence on grain number in wheat. Aust J Plant Physiol 6: 391-400
Rawson HM (1988) Constraints associated with rice–wheat rotations: effects of high temperatures on the development and yield of wheat and practices to reduce deleterious effects. In AR Klatt, ed, Wheat production constraints in tropical environments. International Maize and Wheat Improvement Center (CIMMYT), Mexico DF, pp 44–62 . Link: http://books.google.com.au/books/about/Wheat_Production_Constraints_in_Tropical.html?id=SBnPP4xZg3oC&redir_esc=y
Tashiro T, Wardlaw IF (1989) A comparison of the effect of high temperature on grain development in wheat and rice. Ann Bot 64::59-65