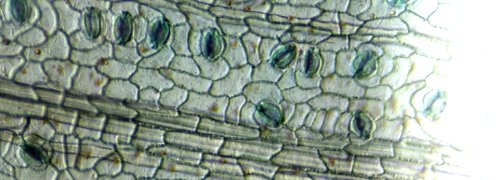
Fig6.6.png
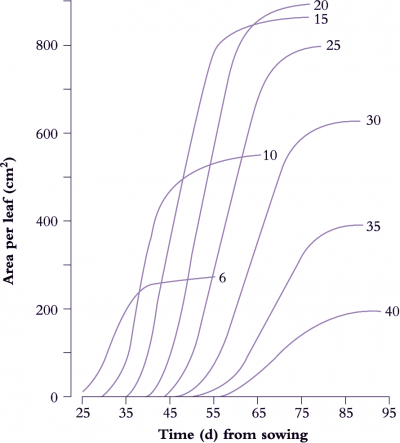
Figure 6.6. Leaf expansion in sunflower shows a sigmoidal increase in lamina area with time where rate of area increase and final size both vary with nodal position, reaching a maximum around node 20. The curves were drawn by hand through all data points (two measurements of leaf length (L) and leaf breadth (B) per week with area A estimated from the relationship A = 0.73 (L × B). Based on Rawson and Turner (1982) Aust J Plant Physiol 9, 449-460
Growth rate of individual leaves provides much useful information on plant growth, especially in response to changes in environment, as leaf growth can be measured over hours or even minutes. Rates of leaf elongation or individual leaf area expansion cannot be used to calculate whole plant relative growth rates, but they can be used to assess current rates of individual leaf growth and effects of a treatment on the rate of leaf emergence (“phyllocron”). Leaf elongation (increase in length of a given leaf per hour or per day) is a sensitive measure of leaf growth and can be accomplished electronically with a transducer, over minutes, manually with a ruler over 4-24 hours, or automatically with a digital photographic technique over intervals of days. Linear measurements with a transducer or ruler are particularly sensitive for monocots whose growth is largely one-dimensional.
(a) Measurement of leaf expansion
Differences in canopy development result from the frequency of new leaf initiation and the time-course of lamina expansion. These can be inferred from comprehensive measurement of lamina expansion on successive leaves. Lamina expansion in both monocotyledons and dicotyledons is approximately sigmoidal in time and asymmetric about a point of inflexion which coincides with maximum rate of area increase. However there is a period of several days over which expansion rates are constant.
A determinate plant with large leaves such as sunflower (Figure 6.6) provides a typical example. Leaf area is shown as a function of time for eight nodes selected between node 6 and node 40. Final leaf area was greatest at node 20, but daily rates of expansion were uniform for leaves between nodes 10 and 25. Thus at any time between days 35 to 65, the daily rate of expansion of any leaf was the same. Slowest growth and smallest final size was recorded for node 40, adjacent to the terminal inflorescence.
Growth curves for monocots leaves are very similar, in that there is a period of several days during which the leaf has a constant rate of area expansion. Increases in leaf areas of cereals and other monocots are easier to measure than dicots as they grow only in length and not width, for the reason explained below.
Frequency of leaf initiation can be inferred from a more comprehensive family of such curves where early exponential growth in area for each successive leaf is recorded and plotted as log10 area versus time. This results in a near-parallel set of lines which intersect an arbitrary abscissa (Figure 6.7). Each time interval between successive points of intersection on this abscissa is a ‘phyllochron’ and denotes the time interval between comparable stages in the development of successive leaves. This index is easily inferred from the time elapsed between successive lines on a semi-log plot (Figure 6.7). Cumulative phyllochrons serve as an indicator of a plant’s physiological age in the same way as days after germination represent chronological age.
Fig6.7.png
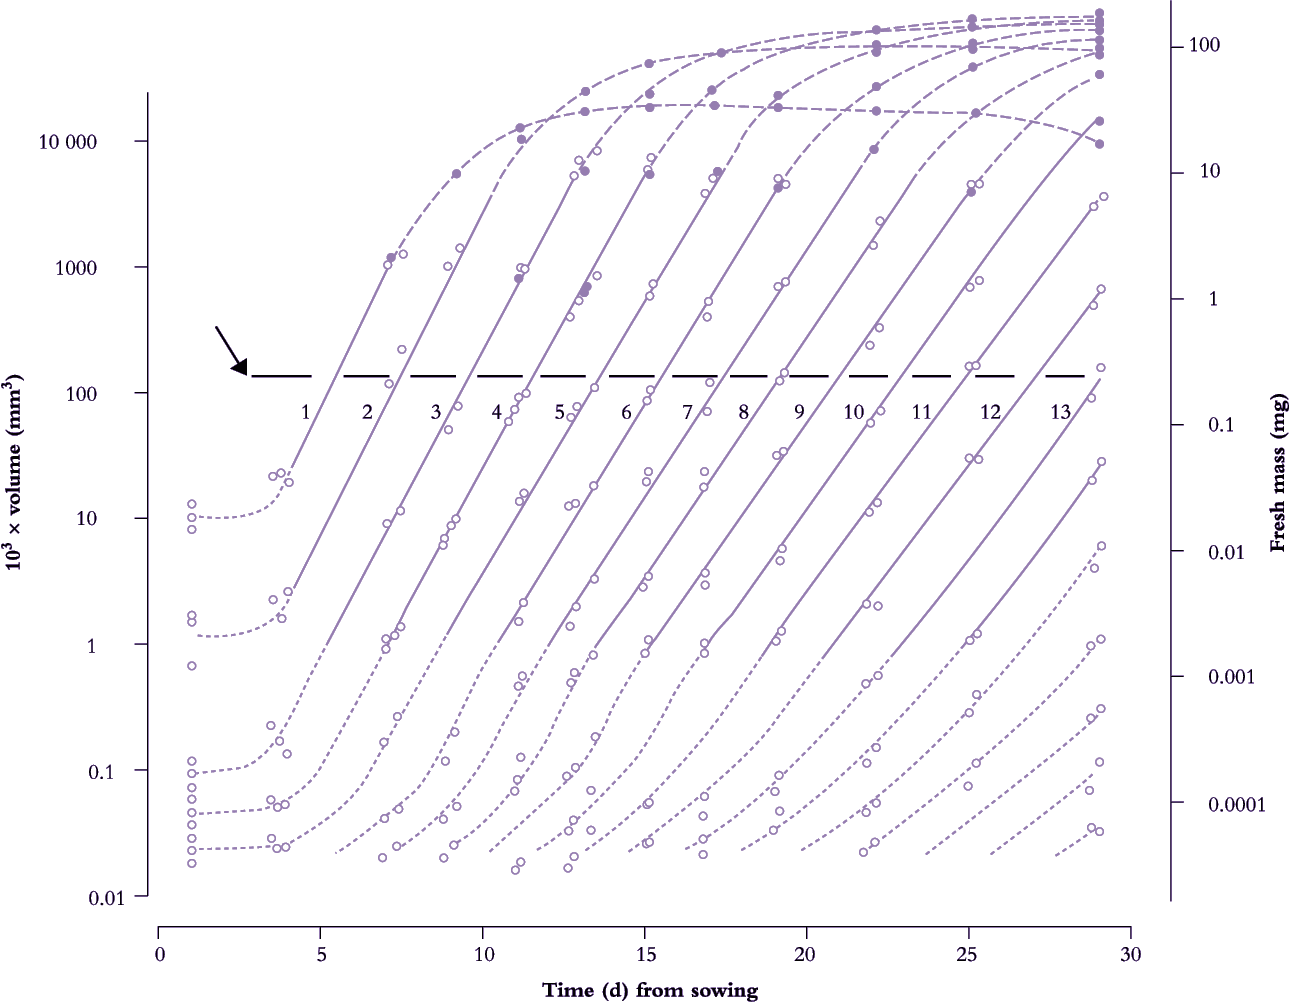
Figure 6.7. Leaves of subterranean clover achieve a 10-million-fold increase in size from primordium to final area (volume of primordia shown as dotted lines; leaf fresh mass shown as solid lines). Successive leaves are initiated and enlarge in a beautifully coordinated fashion revealed here as a family of straight lines on a semi-log plot. Intervals along an arbitrary abscissa (arrow at 100 × 10-3 mm3) that intersects theses lines represent time elapsed (about 1.8 d) between attainment of a given development status by successive leaves (phyllochron). Full-sized leaves exceed about 100 mm3 in volume. Based on Williams (1975) J Aust Inst Agric Sci 41, 18-26
Fig6.8.png
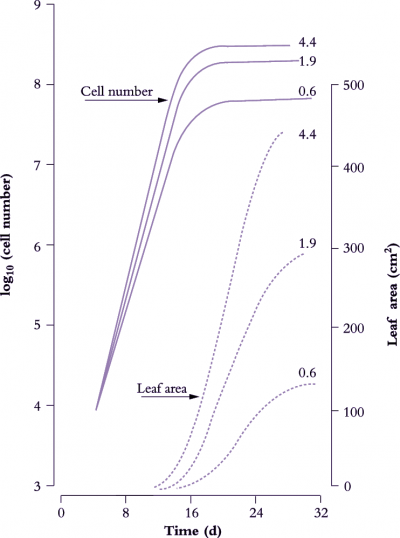
Figure 6.8. Leaves of cucumber (node 2 on plants in growth cabinets) show an approximately sigmoidal increase in area with time (broken lines) where final size and cell number vary with daily irradiance (0.6, 1.9 or 4.4 MJ m-2 d-1). During an initial exponential phase in area growth, cell number per leaf (solid lines) also increases exponentially. The slope of a semi-log plot (hence relative rate of cell division) is higher under stronger irradiance. Cell number per leaf approaches asymptote as the rate of leaf area increase becomes linear. Based on Milthorpe and Newton (1963) J Exp Bot 14, 483-495
(b) Developmental stages of leaf expansion
Leaves are first discernible as tiny primordia which are initiated by meristems in accord with a genetically programmed developmental morphology. They undergo extensive cycles of cell division (peak doubling time about 0.5 d). Leaf growth is anatomically different in grasses (monocotyledonous species) and broad-leafed (dicotyledonous) plants.
Primordia of broad-leafed plants undergo extensive cycles of cell division and enlargement to form recognisable leaves with petioles that elongate and lamina that unfold and expand. Lamina expansion follows a coordinated pattern of further cell division and cell enlargement that is under genetic control but modified by the environment, particularly light. Early growth of the leaf is driven primarily by cell division, and cell number per leaf increases exponentially prior to unfolding. Cell division can continue well into the expansion phase of leaf growth, so that up to 90% of cells in a mature dicot leaf can have originated after unfolding. Cell division finishes about the time the leaf enters its period of linear rate of area expansion, so this period of maximum leaf expansion rate is due to expansion of pre-formed cells.
Primordia of grasses and other monocotyledonous species are hidden from view. All phases of cell growth occur at the base of the leaves which are usually not exposed to the environment. Cell division is confined to basal meristems which give rise to files of cells and a linear zone of cell expansion and differentiation. The emerging blade therefore is composed of cells that are fully expanded, and the elongation of that leaf takes place by addition of fully expanded cells from below.
Fig6.9.png
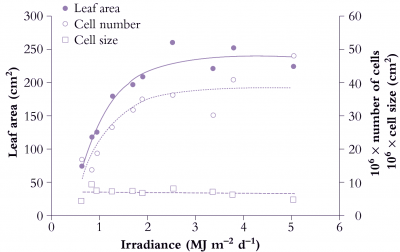
Figure 6.9. Area of individual leaves on cucumber (Cucumis sativus) responds to daily irradiance and reaches a maximum above about 2.5 MJ m-2 d-1. Area increase (node 2 in this example) is due to greater cell number under stronger irradiance. Mean size of mesophyll cells is little affected and has no influence on area of individual leaves. Based on Newton (1963) J Exp Bot 14, 458-482
(c) Effects of light on leaf development
Light is the main variable affecting leaf growth rate, both the rate of leaf area expansion, final size, as well as cell shape as mentioned in the previous section.
Figure 6.8 shows the effect of light level on the rate of leaf area expansion in a cucumber leaf. As in all dicot leaves, the rate of lamina expansion is determined largely by the number of cells produced, with final cell area being unaffected (Figure 6.9). Rate of cell division during this early phase is increased by irradiance, so that potential size of these cucumber leaves at maturity is also enhanced. The upper curves in Figure 6.8 (highest irradiance), cell number per lamina reaches a plateau around 20 d, but area continues to increase to at least 30 d. Expansion of existing cells is largely responsible for lamina expansion between 20 and 30 d after sowing.
Figure 6.9 shows the effect of a range of light levels on final leaf area, and shows that area is strongly dependent on light level up to 2 MJ m-2 d-1, and that the increased area has been achieved by more cells rather than larger cells.
A similar light response curve would be shown by monocot leaves, and with similar contributions from cell number versus cell size. The difference between monocots and dicots is that the cell number is determined in the basal meristematic zone, before the lamina emerges. This zone is not exposed to the light environment, so cell division activity in monocots is controlled by substrates or signals arising in the older expanded leaves.
(d) Leaf development and photosynthesis
When dicotyledonous leaves are very young and first unfold they have low rates of net photosynthesis (expressed per unit area) so have to import carbon from other leaves to support their growth. But as they expand their rates increase rapidly such that within a few days they can assimilate all their own carbon requirements and export excess (Figure 6.10).
Fig6.10.png
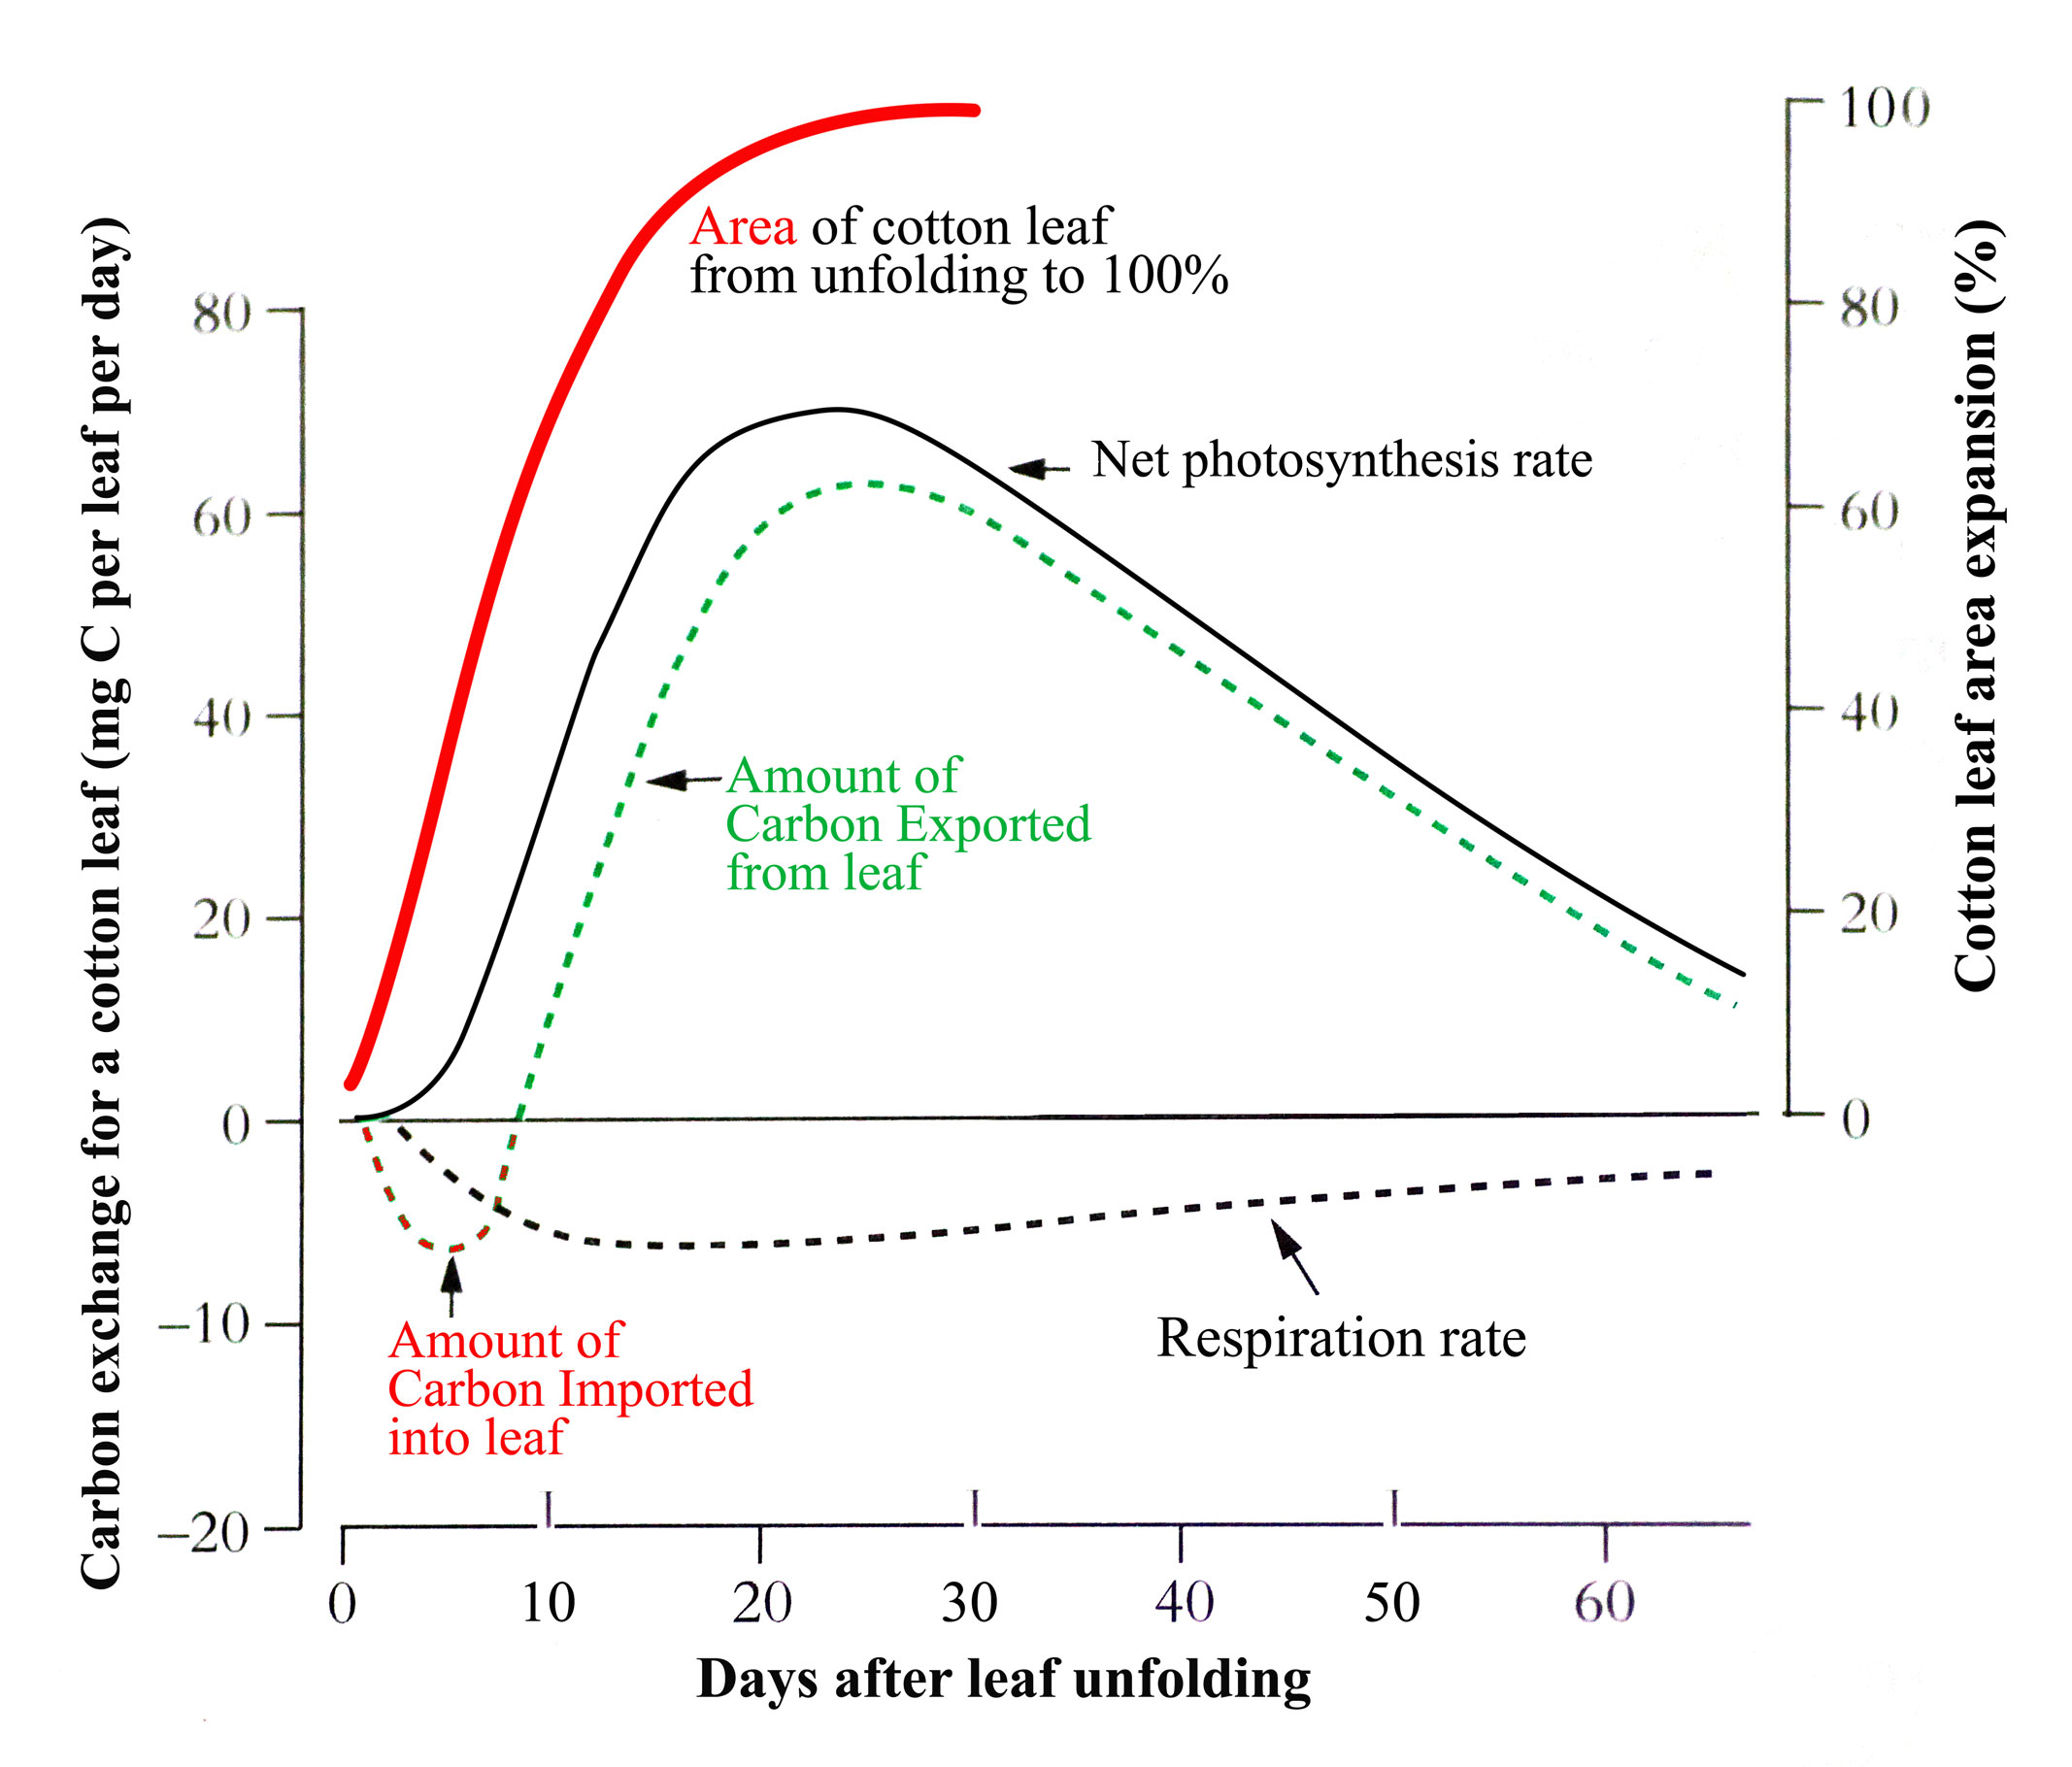
Figure 6.10. Change in net photosynthesis rate as a cotton leaf unfolds, expands, reaches maximum area and ages. An initial phase of carbon import helps sustain early expansion but by the time the leaf is 70% of its final area it is self sufficient for carbon and exporting excess. From Constable and Rawson (1980) Aust J Plant Physiol 7, 89-100 and 539-553
In the example for cotton in the figure, this self-sufficiency occurs when the leaf is about 70% of its final area. Typically, net photosynthesis rate will reach a maximum before the leaf has fully expanded though this can range from 25 to 100% of final area across species. Photosynthesis rate will then remain at that maximum or start to decline with further leaf expansion before leaf aging, lessening requirement for the carbon produced, and environmental factors accelerate the decline. Because the amount of carbon produced by a leaf is the product of two largely independent variables, its photosynthesis rate x its area, leaf carbon production can continue to increase while photosynthesis rate is stable or even declining.
Monocotyledonous leaves grow from their base where the very young expanding parts of the leaf are fully enclosed inside a sheath created by the surrounding leaf bases. The emerged parts of the leaf blade are already approaching full expansion as they emerge from the sheath and unroll. Photosynthesis rates of those exposed parts are already close to their maximum. Once the whole blade is exposed, photosynthesis rate and leaf carbon production follow plateau and declining patterns similar to those described for dicots though magnitude and duration differ amongst species and environments.
When doing experiments that investigate the effects of environmental treatments on photosynthesis, it is important bear in mind the continuous progression in photosynthesis rate between growing, recently fully expanded and aging leaves. Leaves should be compared that are of equivalent age and stage of development, particularly if single leaves are being measured to represent a whole plant or a breeding line. If the eventual aim of the experiment is to compare or select for carbon production, the area of the leaf must also be known since photosynthesis rate and fully expanded area of a leaf are not linked. Leaves of some dicotyledonous species take a few days to reach full expansion while others take weeks.
