Chapter 2 - Carbon dioxide assimilation and respiration

Figp2.00-p.png

Tobacco plants (a) transformed with an antisense construct against Rubisco (anti-Rubisco) grow more slowly than wild types due to a 60% reduction in photosynthetic rate. Immunodetection of the large subunit polypeptide of Rubisco with an anti-Rubisco antiserum (b) shows that the anti—Rubisco transgenic plants contain less than 50% of the Rubisco detected in wild-type tobacco plants. Scale bar in (a) = 10 cm (Photograph courtesy Susanne von Caemmerer; original immunoblot courtesy Martha Ludwig)

Oula Ghannoum1, Susanne von Caemmerer2, Nicolas Taylor3 and A. Harvey Millar3
1Hawkesbury Institute of the Environment, University of Western Sydney
2Research School of Biology, Australian National University
3ARC Centre of Excellence inPlant Energy Biology, University of Western Australia

Rubisco (ribulose-1,5-bisphosphate carboxylase/oxygenase) is the most abundant single protein on earth and is pivotal for CO2 assimilation by all plants. In higher plants, the holoenzyme consists of eight large subunits, each with a molecular mass of 50-55 kD and eight small subunits of molecular mass 12-18 kD. Large subunits are encoded by a single gene in the chloroplast genome while a family of nuclear genes encode the small subunits. Any loss of catalytic effectiveness or reduction in amount translates to slower photosynthesis and reduced growth.

Life on earth is sustained by photosynthetic use of sunlight energy to convert atmospheric CO2 into carbohydrates. Billions of years ago, photosynthetic cyanobacterium-like prokaryotes were engulfed by early heterotrophic eukaryotes to produce aquatic photosynthetic organisms harbouring chloroplasts with double membranes. These gave rise to vascular plants which in turn adapted to changing terrestrial environments via distinctive modes of photosynthesis.

Most terrestrial plants fix atmospheric CO2 into carbohydrates via the C3 photosynthetic pathway and its initial three-carbon fixation product (Section 2.1). Millions of years of evolution under conditions of water limitation, temperature variations and glacial CO2 concentrations have produced higher plants with significant biochemical variants for fixation of atmospheric CO2 into carbohydrate, namely C4 (initial four-carbon fixation product), CAM (crassulacean acid metabolism) and SAM (submerged aquatic macrophytes) (Section 2.2).

Photosynthesis in C3 plants is inhibited by oxygen, initiating a series of metabolic reactions termed photorespiration (Section 2.3). Mitochondrial respiration converts the carbon gained for generation of energy to sustain growth and nutrient upake, as well as providing carbon skeletons for a multitude of synthetic events (Section 2.4).

2.1 - C<sub>3</sub> photosynthesis

Oula Ghannoum, University of Western Sydney, Australia

Despite much diversity in life form and biochemical process, all of the photosynthetic pathways focus upon a single enzyme which is by far the most abundant protein on earth, namely ribulose-1,5-bisphosphate carboxylase/oxygenase, or Rubisco (Figure 2.1a). Localised in the stroma of chloroplasts, this enzyme enables the primary catalytic step in photosynthetic carbon reduction (or PCR cycle) in all green plants and algae. Although Rubisco has been highly conserved throughout evolutionary history, this enzyme is surprisingly inefficient with a slow catalytic turnover (Vcmax), a poor specificity for CO2 as opposed to O2 (Sc/o), and a propensity for catalytic misfiring resulting in the production of catalytic inhibitors. This combination severely restricts photosynthetic performance of C3 plants under current ambient conditions of 20% O2 and 0.039% CO2 (390 μL L-1). Furthermore, Rubisco has a requirement for its own activating enzyme, Rubisco activase, which removes inhibitors from the catalytic sites to allow further catalysis. Accordingly, and in response to CO2 limitation, C4, C3-C4 intermediate, CAM and SAM variants have evolved with metabolic concentrating devices which enhance Rubisco performance (Section 2.2).

2.1.1 - Photosynthetic carbon reduction

Figp2.01.png

Figure 2.1 Photosynthetic carbon reduction (PCR cycle, also termed the Calvin-Benson cycle) utilises ATP and NADPH produced by thylakoid electron transport to drive CO2 fixation by Rubisco (a). CO2 is incorporated into a 5-carbon sugar phosphate to produce two 3-carbon sugar phosphates which can either be exported from the chloroplast for sucrose synthesis, be recycled to make more 5-carbon acceptors, or be used to make starch. The appearance of radioactive carbon in 3-carbon sugar phosphates and then in starch and sucrose following photosynthesis in 14CO2 was evidence for the pathway of photosynthesis. (b) (Original drawing courtesy Robert Furbank).

The biochemical pathway of CO2 fixation was discovered by feeding radioactively labelled CO2 in the light to algae and then extracting the cells and examining which compounds accumulated radioactivity. Figure 2.1(b) shows a typical labelling ‘pattern’ for a C3 plant. Here, a short burst of labelled CO2 was given to the plants, then the label was ‘chased’ through the photosynthetic pathway by flushing with unlabelled air. Atmospheric CO2 is initially incorporated into a five-carbon sugar phosphate (ribulose-1,5-bisphosphate or RuBP) to produce two molecules of the phosphorylated three-carbon compound 3-phosphoglycerate, often referred to as the acidic form 3-phosphoglyceric acid (3-PGA). Hence, plants which use Rubisco as their primary enzyme of CO2 fixation from the air are called C3 plants. Consequently, in C3 plants, 3-PGA is the first labelled sugar phosphate detected after a pulse of 14CO2 has been supplied (Figure 2.1b). In the PCR cycle, 3-PGA is phosphorylated by the ATP produced from thylakoid electron transport (see Chapter 1) and then reduced by NADPH to produce triose phosphate. Triose phosphates are the carbon backbones, produced by the PCR cycle, for the synthesis of critical carbohydrate for the maintenance of plant growth and the productive yield of stored carbohydrate in seed.

Newly synthesised triose phosphate faces three options. It can be (1) exported to the cytosol for sucrose synthesis and subsequent translocation to the rest of the plant, (2) recycled within the chloroplast to produce more RuBP or (3) diverted to produce starch (Figure 2.1a). This is shown by the time-course of the appearance of radioactivity in starch and sucrose after it has passed through 3-PGA (Figure 2.1b). The energy requirements of the PCR cycle are three ATP and two NADPH per CO2 fixed, in the absence of any other energy-consuming processes.

Sucrose and starch synthesis

Most of the triose phosphate synthesised in chloroplasts is converted to either sucrose or starch. Starch accumulates in chloroplasts, but sucrose is synthesised in the surrounding cytosol, starting with the export of dihydroxyacetone phosphate and glyceraldehyde phosphate from the chloroplast. A condensation reaction, catalysed by aldolase, generates fructose-1,6-bisphosphate, and this is converted to fructose-6-phosphate after an hydrolysis reaction catalysed by fructose-1,6-phosphatase. Sucrose-6-phosphate synthase then generates sucrose-6-phosphate from the reaction of fructose-6-phosphate and UDP-glucose. The phosphate group is removed by the action of sucrose-6-phosphatase. This Pi is transported back into the chloroplast where it is available for ATP synthesis. For each molecule of triose phosphate exported from a chloroplast, one Pi is translocated inwards.

Sucrose synthesised within the cytosol of photosynthesising cells is then available for general distribution and is commonly translocated to other carbon-demanding centres via the phloem (see Chapter 5).

By contrast, starch synthesis occurs within chloroplasts. The first step is a condensation of glucose-1-phosphate with ATP. Starch synthase then transfers glucose residues from this molecule to the non-reducing end of a pre-existing molecule of starch. Starch consists of two types of glucose polymer, namely amylose and amylopectin. Amylose is a long, unbranched chain of D-glucose units connected via (α1–4) linkages. Amylopectin is a branched form, with (α1–6) linkages forming branches approximately every 24–30 glucose residues.

2.1.2 - RuBP regeneration

Picture2.png

Figure 2.2. A simplified (above) and detailed (below) description of the photosynthetic carbon reduction (PCR) cycle. The fixation of CO2 by Rubisco to the acceptor molecule RuBP initiates the cycle with the production of two molecules of PGA. The subsequent, enzyme catalysed, generation of cycle intermediates are cycled to either regenerate RuBP or produce triose phosphates which are precursors for carbohydrate synthesis. The cycle is powered by the co-factors NADPH and ATP that are synthesised from the chloroplast electron transport chain. Enzymes include: PGK, phosphoglycerate kinase; GAPDH, glycraldehyde-3- phosphate dehydrogenase; TIM, triose phoshphate isomerase; ALD, aldolase; FBPase, fructose-1,6-bisphosphatase; TKL, transketolase, SBPase, seduheptulose-1,7-bisphosphatase; RPI, ribose-5-phosphate isomerase; RPE, ribose-5-phosphate epimerase and PRK, phosphoribulose kinase. (Courtesy Robert Sharwood).

Picture3.png

Figure 2.2b

Ribulose bisphosphate (RuBP) is consumed in the carboxylating step of carbon fixation. If such fixation is to continue, RuBP must be regenerated, and in this case via the PCR cycle. The PCR cycle operates within the stroma of chloroplasts, and consists of a sequence of 11 steps where a three-carbon compound (3-phosphoglycerate) is phosphorylated, reduced to glyceraldehyde 3-phosphate and isomerised to dihydroxyacetone phosphate. Condensation of this three-carbon compound with glyceraldehyde 3-phosphate yields a six- carbon compound (fructose bisphosphate). Following a series of carbon shunts, involving four-, five- and seven-carbon compounds, RuBP is regenerated.

Important features of the PCR cycle include: (1) for every step of the cycle to occur once, three carboxylations must occur via ribulose bisphosphate carboxylase thus generating six moles of phosphoglycerate (18 carbons); (2) for one turn of the cycle, three molecules of RuBP participate (15 carbons) and thus a net gain of three carbons has occurred for the plant; (3) in regenerating three molecules of RuBP, nine ATP and six NADPH are consumed.

2.1.3 - Properties of Rubisco

Photosynthetic carbon fixation in air is constrained by the kinetic properties of Rubisco. Form I Rubisco in higher plants is a large protein (approximately 550 kDa) comprised of eight large (approx. 50-55 kDa) and eight small subunits (approx. 13-18 kDa) to form an L8S8 hexadecamer. Rubisco synthesis and assembly in higher plants is a complex process whereby the large subunit gene (rbcL) is encoded in the chloroplast genome, while the small subunit genes (rbcS) are encoded as a multi-gene family in the nucleus. The Rubisco small subunits are translated as precursors in thc cytosol and are equipped with a transit-peptide to target them to the chloroplast. Upon import in the chloroplast the transit-peptide is cleaved by a stromal peptidase and the N-terminus modified by methylation of the n-terminal methionine. The large subunits  are synthesised within the chloroplast and also post-translationally modified through the removal of the the N-terminal methionine and serine amino acids and the subsequent acetylation of proline at the N-terminus and the methylation of lysine at position 14. The assembly of large and small subunits into functional hexadecameric Rubisco is reliant on the coordination of chloroplast-localised chaperones.

Despite selection pressure over evolutionary history, Rubisco remains an inefficient catalyst (Spreitzer and Salvucci 2002). Therefore, to achieve a productive maximum CO2 assimilation rate (Amax), plants must compensate for catalytic inefficiency by investing large amounts of nitrogen in Rubisco. Consequently, Rubisco comprises more than 50% of leaf soluble protein in C3 plants. On a global scale, this investment equates to around 10 kg of nitrogen per person!

More than 1000 million years of evolution has still not resulted in a ‘better’ Rubisco adapted for the current and future concentrations of CO2. Such a highly conserved catalytic protein is an outcome of thermodynamic and mechanistic difficulties inherent to this reaction. Rubisco requires carbamylation of the absolutely-conserved residue K201 that is then stabilised by the binding of Mg2+. Without this activation step Rubisco is unable to function. The fixation of CO2 to RuBP to form two molecules of 3-PGA is a five step catalytic process that produces highly reactive transition state intermediates that bind CO2. The highly reactive transition states make Rubisco prone to generating misfiring products, which generate inhibitors within the active site. Therefore, Rubisco requires its own catalytic protection enzyme Rubisco activase. Plants devoid of this enzyme fail to grow properly in air as the activation and subsequent activity of Rubisco is impeded (Portis and Salvucci 2002). Rubisco activase is an ATP-dependent process that removes inhibitors from the active site of Rubisco allowing for activation and catalysis to proceed. Recently, the crystal structure of Rubisco activase has been solved, which will provide key insight into the molecular interaction between Rubisco and Rubisco activase (reviewed by Portis et al. 2008).

Rubisco first evolved when the earth’s atmosphere was rich in CO2, but virtually devoid of O2. With the advent of oxygen-producing photosynthesis by land plants, and the resulting increases in atmospheric O2, one key deficiency of this enzyme became apparent. Rubisco would not only catalyse fixation of CO2 but would also permit incorporation of O2 into RuBP to produce, instead of two molecules of 3-PGA, just one molecule of 3-PGA with one molecule of a two-carbon compound, 2-phosphoglycolate (Section 2.3). Indeed, CO2 and O2 compete directly for access to the active sites of Rubisco. So feeble is Rubisco’s ability to distinguish between these two substrates that in air (20% O2) approximately one molecule of O2 is fixed for every three molecules of CO2.

Fixation of O2 and subsequent photorespiration (Section 2.3) is an energy-consuming process, due to competition between O2 and CO2 for RuBP, plus the energy cost of converting the phosphoglycolate product to a form which can be recycled in the PCR cycle. This energy cost is increased at higher temperatures because O2 competes more effectively with CO2 at the active site of Rubisco. Such sensitivity to temperature × O2 explains why CO2 enrichment, which reduces photorespiration, has a proportionally larger effect upon net carbon gain at higher temperatures than at lower temperatures (Section 13.3).

Figp2.02.png

Figure 2.3. Mechanisms underlying CO2 fixation by Rubisco have changed very little during evolution but Rubisco efficiency has improved. The enzyme in more 'highly evolved' species such as C3 angiosperms is able to fix more CO2 and less O2 in air, reducing photorespiratory energy costs. A measure of this is the relative specificity of Rubisco for CO2, shown here for a range of photosynthetic organisms. (Based on Andrews and Lorimer 1987).

Notwithstanding a meagre catalytic effectiveness in present day Rubisco, more efficient variants would still have had a selective advantage, and especially during those times in the earth’s geological history when atmospheric CO2 concentration was decreasing. Indeed there has been some improvement (Figure 2.3) such that specificity towards CO2 as opposed to O2 has improved significantly. Recently evolved angiosperms show a relative specificity almost twice that of 'older' organisms such as photosynthetic bacteria.

Despite such improvement, Rubisco remains seemingly maladapted to its cardinal role in global carbon uptake, and in response to selection pressure for more efficient variants of CO2 assimilation, vascular plants have evolved with photosynthetic mechanisms that alleviate an inefficient Rubisco. One key feature of such devices is a mechanism to increase CO2 concentration at active sites within photosynthetic tissues. Some of these photosynthetic pathways are dealt with below.

Feature essay 2.1 - The discovery of C<sub>4</sub> photosynthesis

By M.D. (Hal) Hatch

Discovering C4 photosynthesis is an instructive story because it says a lot about progress in science, about serendipity, as well as mindsets and our natural resistance to accept results that conflict with the dogma of the day.

2.1-FE-Fig-1.jpg

Figure 1. Dr M.D (Hal) Hatch, FAA, FRS, primary discoverer of C4 photosynthesis.

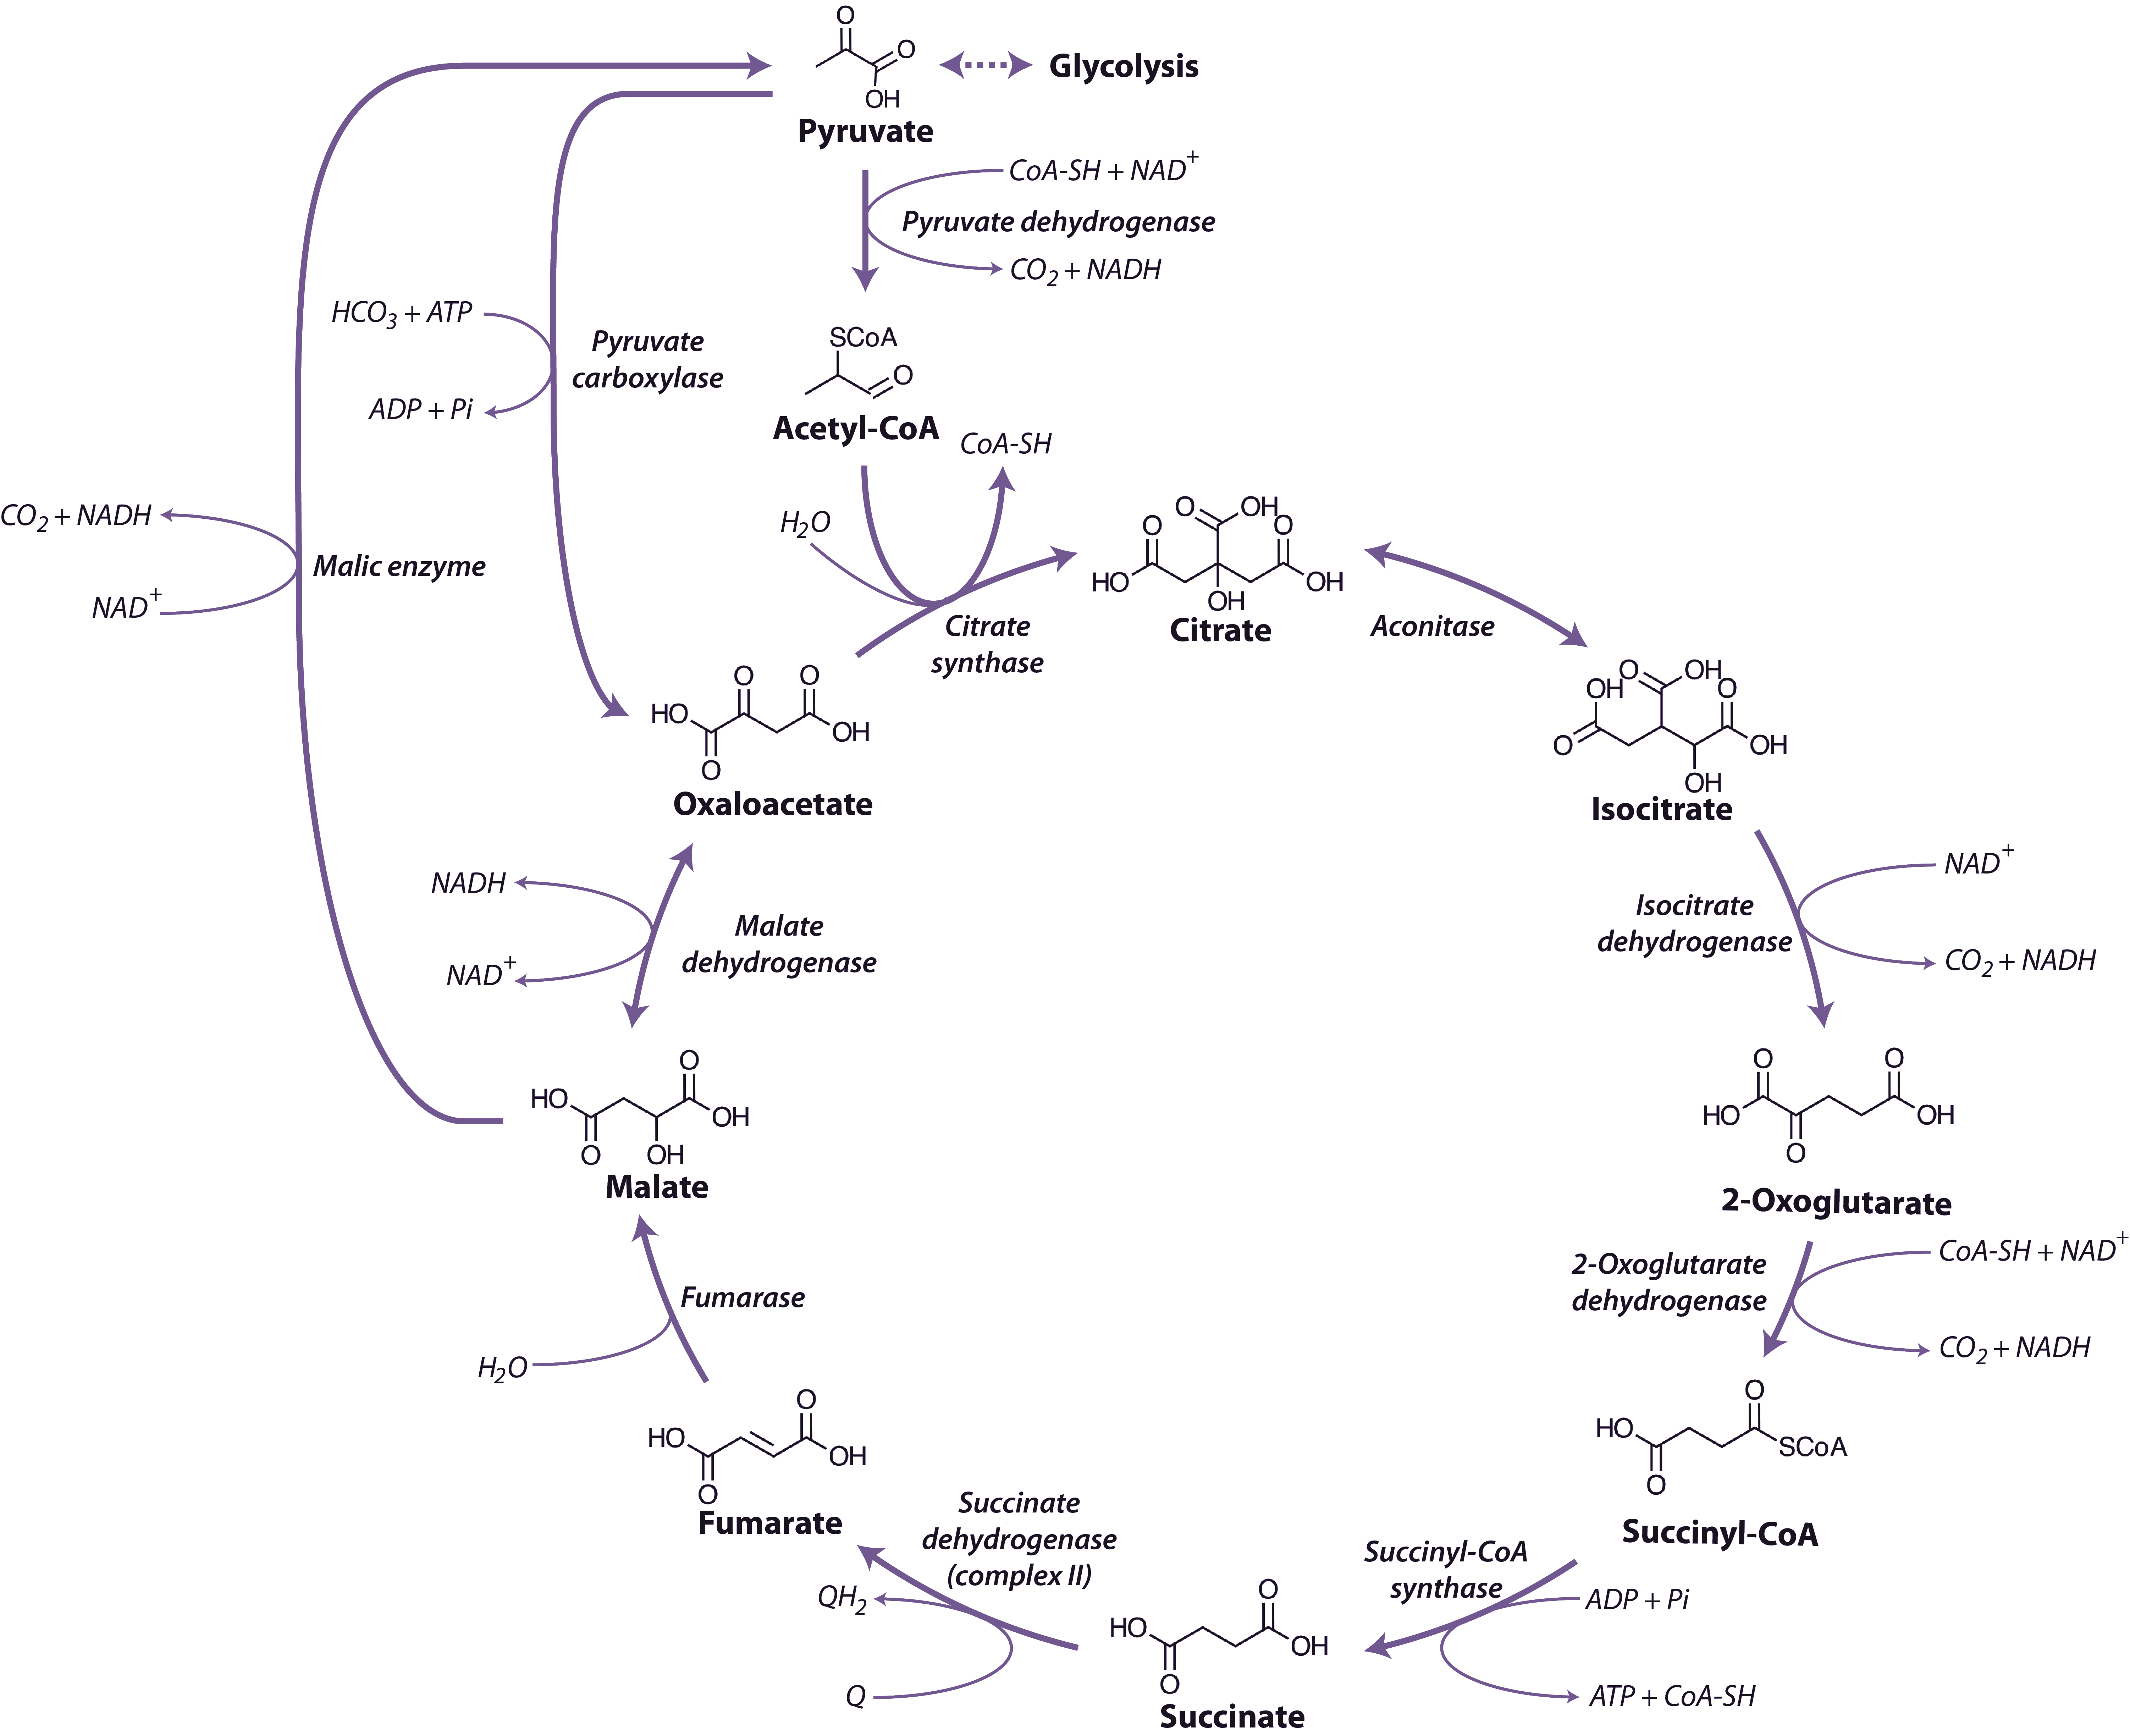
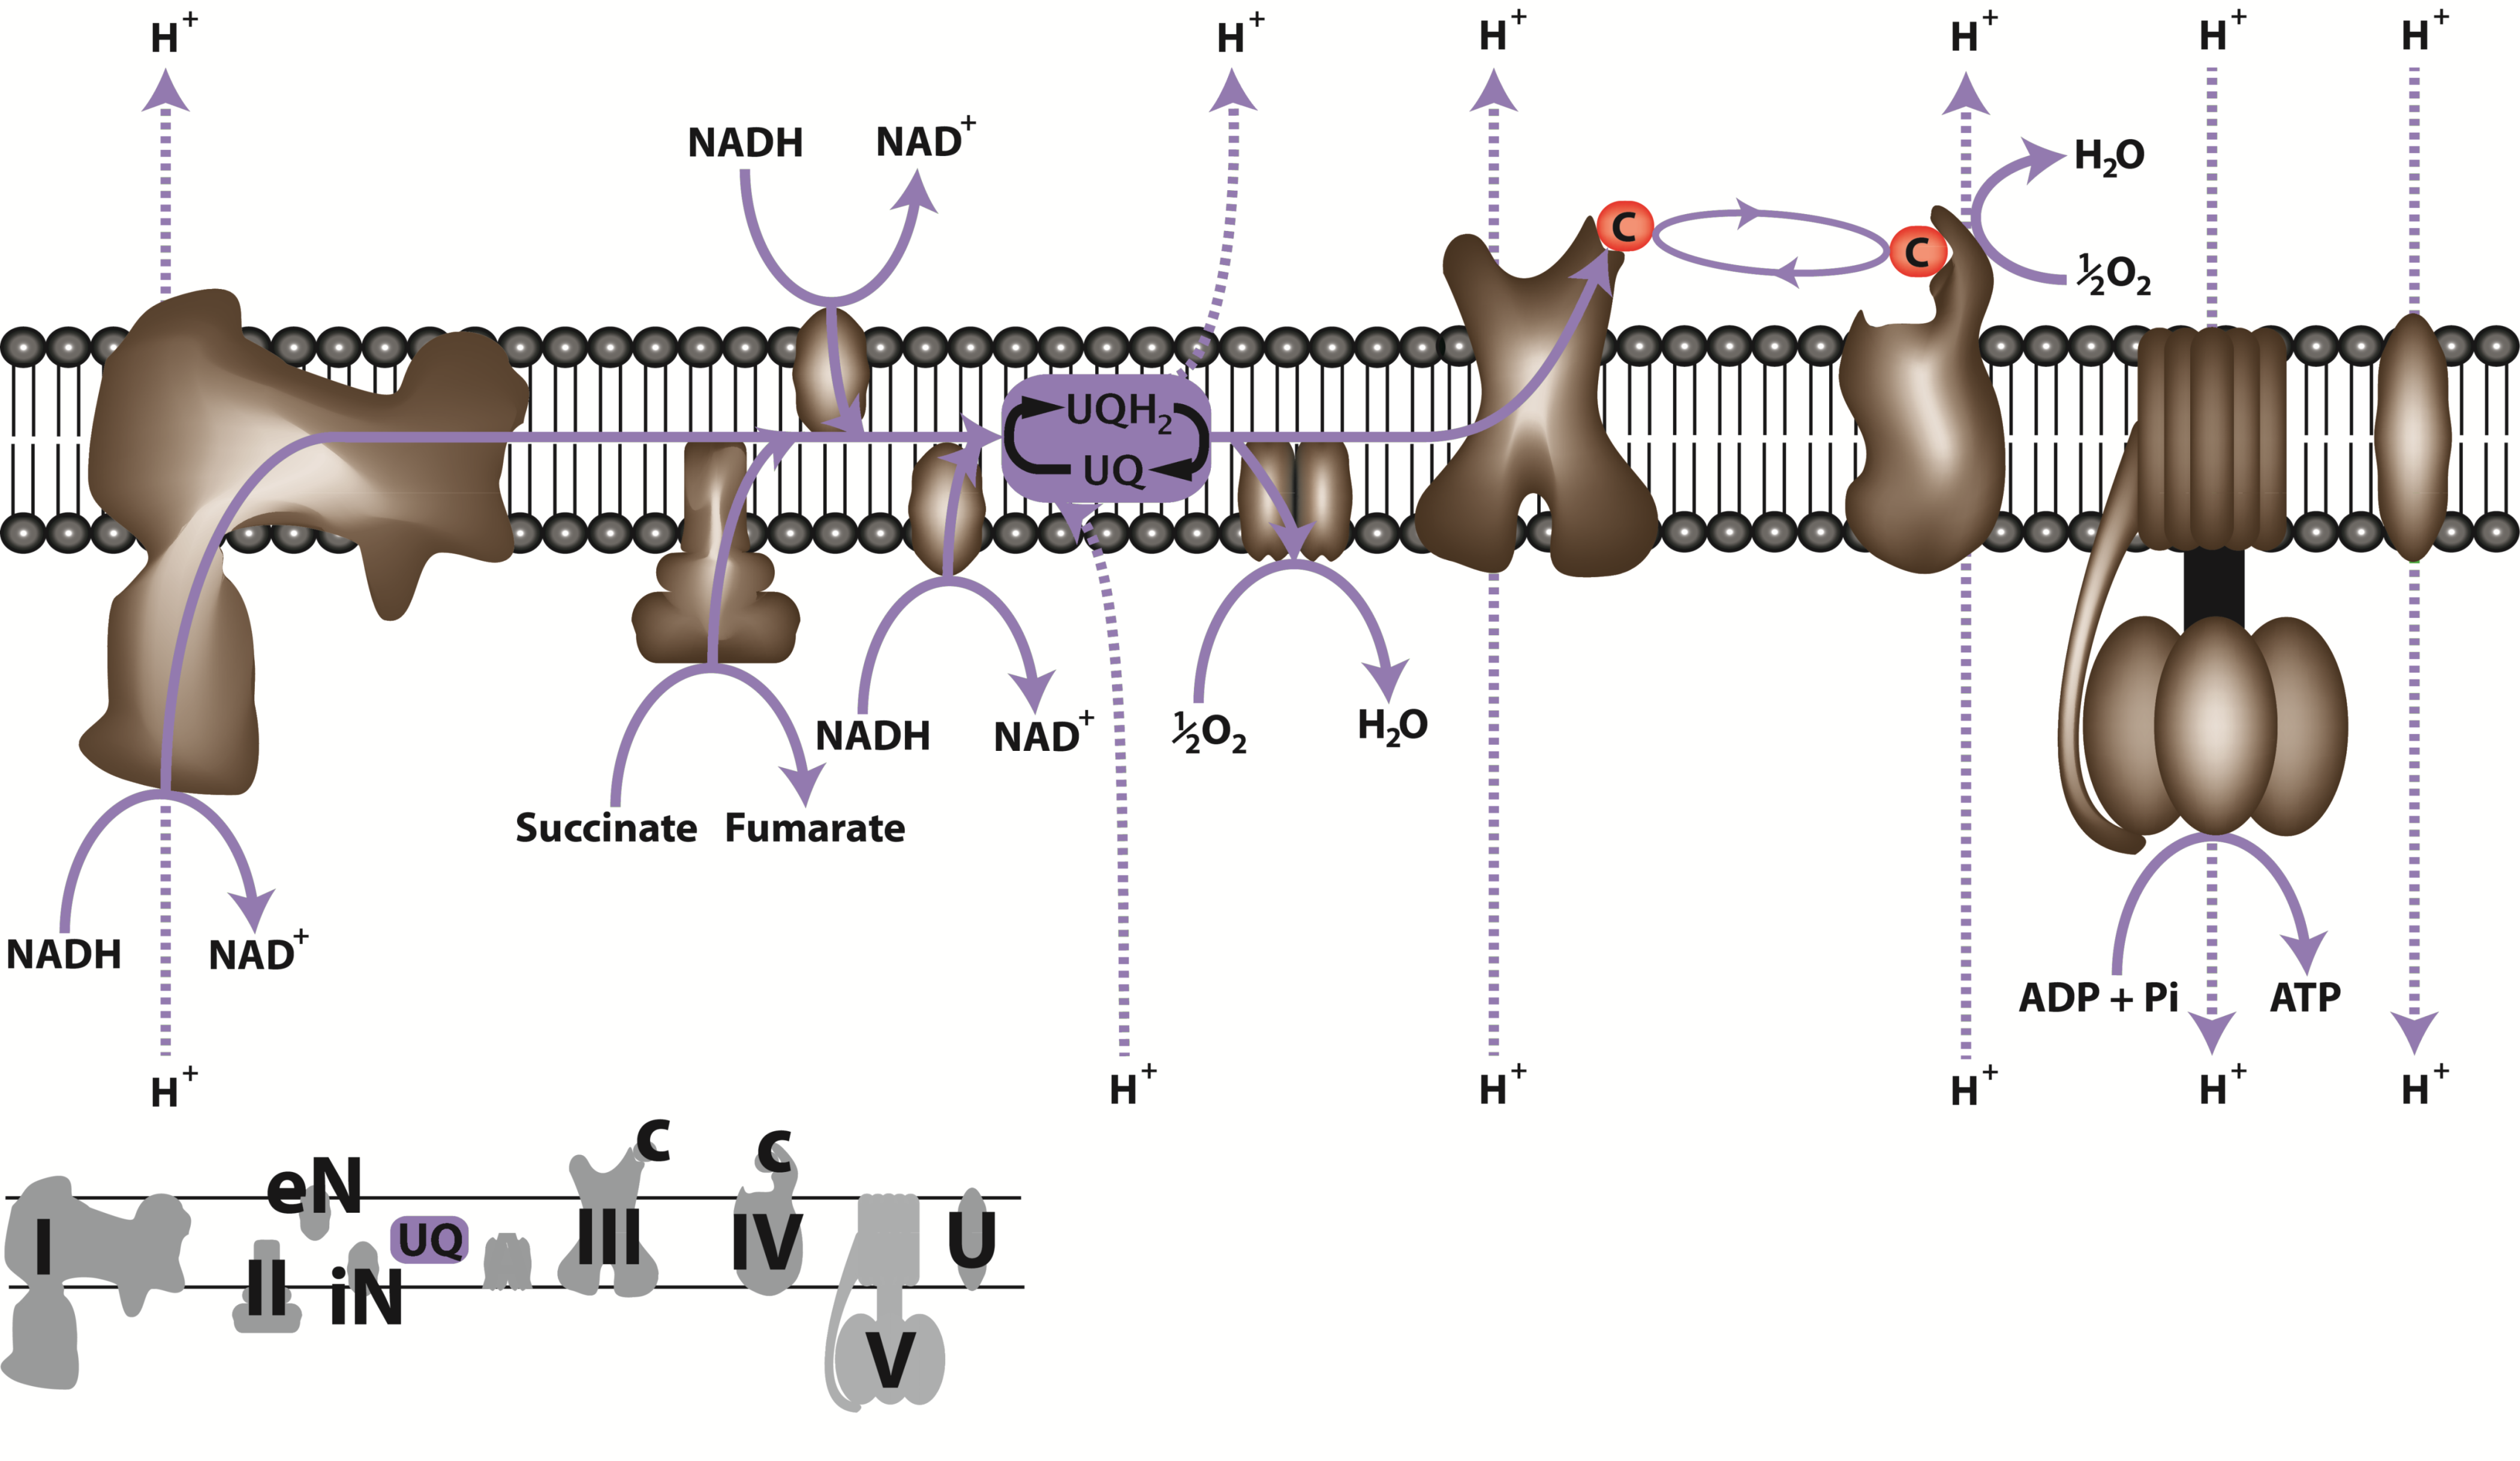
As a rule, the major chemical transformations that occur in plants proceed by exactly the same series of steps in all species. For instance, take the process of respiration where sugars and starch are broken down to CO2 and H2O, yielding energy for living cells. It is almost certain that this proceeds by exactly the same 20 or so steps in species right across the Plant Kingdom. In fact, the same process also operates in yeast, mice and man.

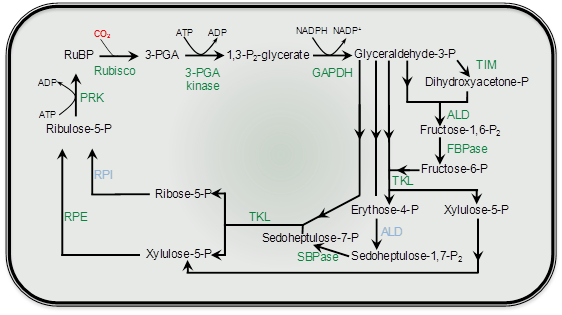
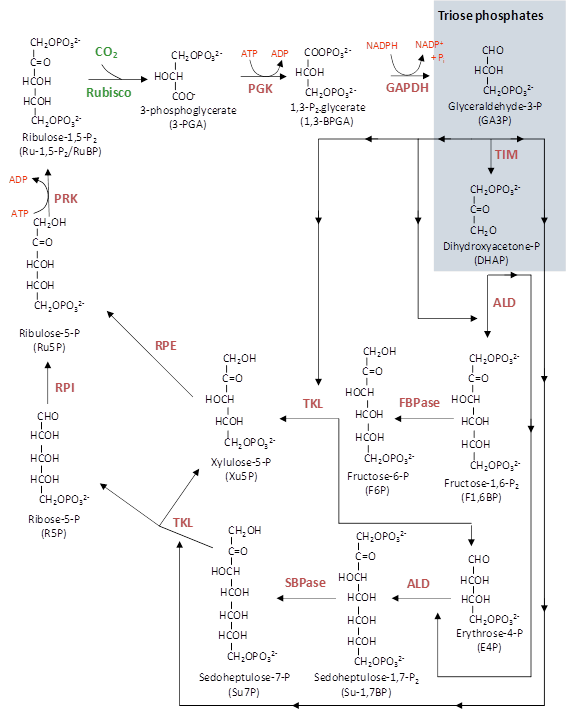
During the 1950s Melvin Calvin and his colleagues at Berkeley resolved the mechanism of photosynthetic CO2 assimilation in the alga Chlorella. Later, they showed that similar steps, with similar enzymes, occurred in a few higher plants. So, by the end of the 1950s it was reasonably assumed that this process, termed the Calvin cycle or photosynthetic carbon reduction (PCR) cycle, accounted for CO2 assimilation in all photosynthetic organisms.

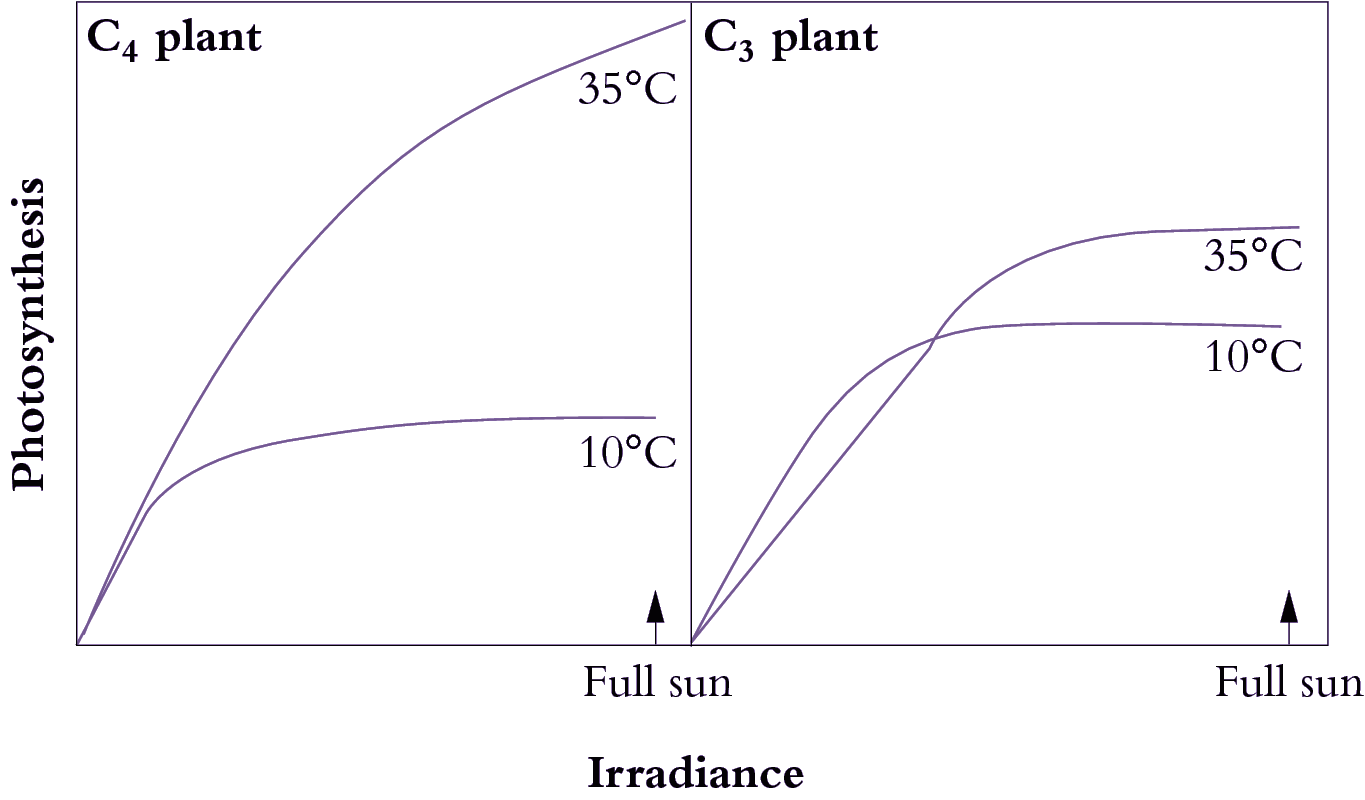
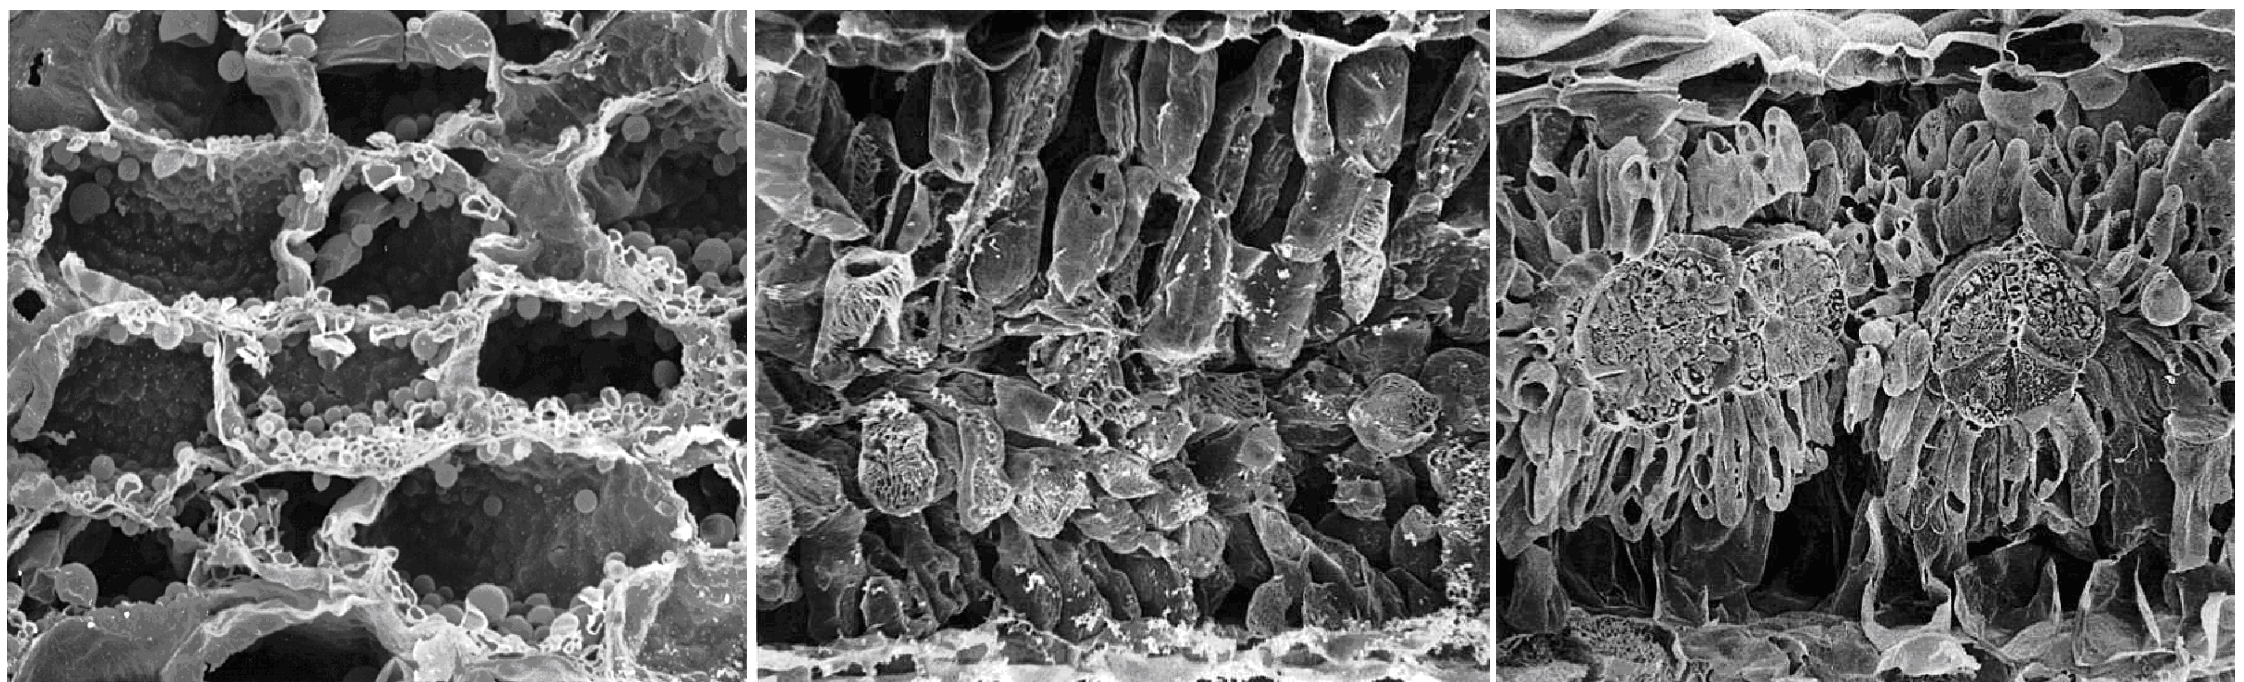
In retrospect, a very observant reader of the plant biological literature of the early 1960s should have noticed that a small group of grass species, including plants like maize, had a set of very unusual but correlated properties, related in one way or another to the process of photosynthesis, that contrasted with the vast majority of other vascular plants. These included an unusual leaf anatomy, substantially higher rates of photosynthesis and growth, higher temperature and light optima for photosynthesis, a much higher water use efficiency, and a very low CO2 compensation point. From this, one might have reasonably concluded that these particular species could be using a different biochemical process for photosynthesis.

We now know that these unusual species fix CO2 by the C4 photosynthetic mechanism. However, the process was not discovered by following up these observations, and only later was the significance of these unusual, correlated features fully appreciated.

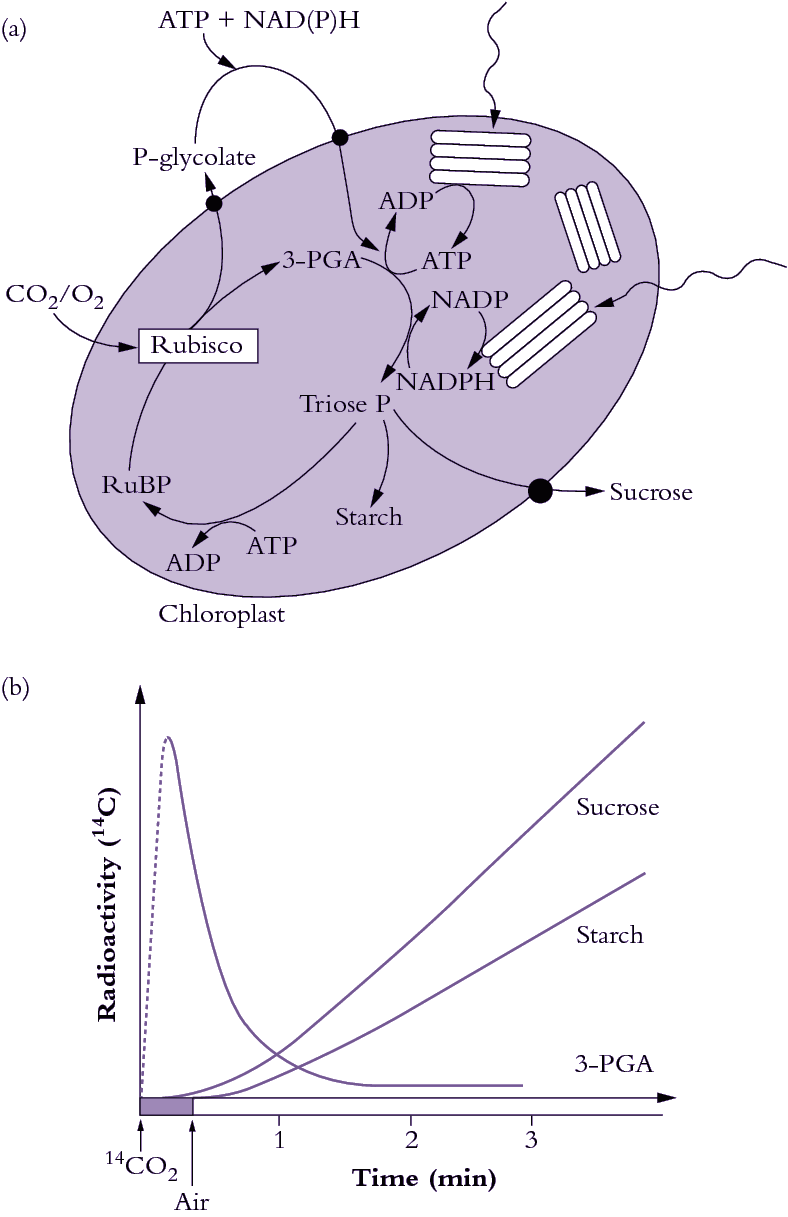
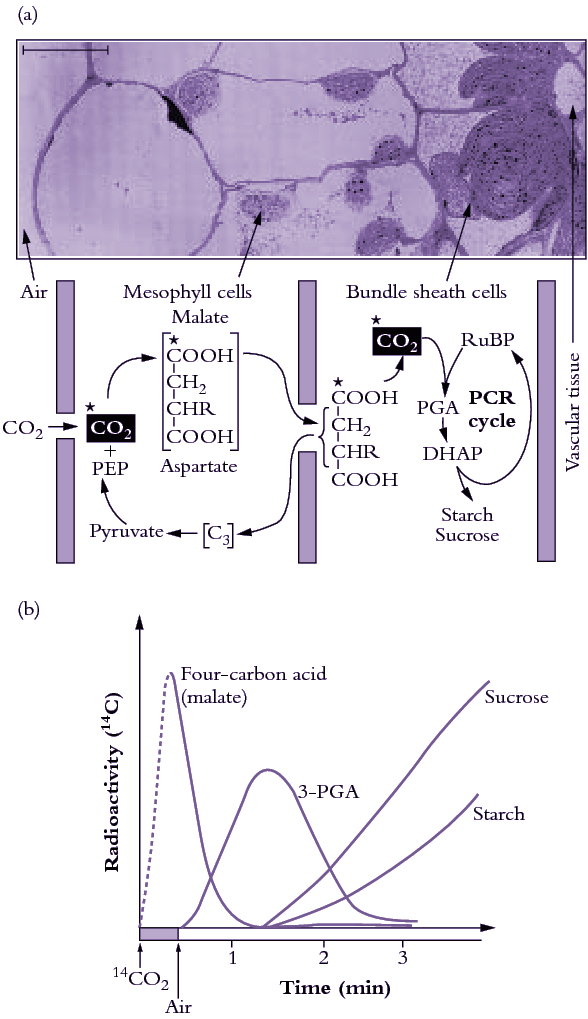
During the early 1960s, my colleague Roger Slack and I were working on aspects of carbohydrate biochemistry and sugar accumulation in sugar cane in the research laboratory of the Colonial Sugar Refining Company in Brisbane. Because of these particular interests, we were in regular contact with a laboratory in Hawaii that also worked on sugar cane. We learned from our Hawaiian colleagues, Hart, Kortschak and Burr, that they had seen some unusual results when they allowed sugar cane leaves to fix radioactive carbon dioxide (14CO2), that is, doing the same experiment that Calvin and his colleagues had done earlier with Chlorella. With this procedure radioactivity should be initially incorporated into the first products formed when CO2 is assimilated; in the case of the PCR cycle the radioactivity should appear in the three-carbon compound 3-phosphoglyceric acid (3-PGA) and then in sugar phosphates. However, when these Hawaiian workers first did this experiment as early as 1957 they saw only minor radiolabelling in 3-PGA after brief exposure to 14CO2 and later they showed that most of the radioactivity was located in the four-carbon dicarboxylic acids, malate and aspartate.

We were really intrigued by this result and had often discussed possible interpretations and significance. So when the Hawaiian group published their results a few years later in 1965 we set about repeating and extending these observations to see if we could find out what it all meant.

Before coming to that work it is worth recounting one other interesting twist to the story. In the late 1960s, and several years after we had begun studying C4 photosynthesis, we became aware of a report published some 10 years earlier in a somewhat obscure annual report of a Russian agricultural research institute. This report from a young Russian scientist, Yuri Karpilov, clearly showed that when maize leaves are exposed to radioactive CO2 most of the radioactivity incorporated after 15 s was not in 3-PGA but was in the same dicarboxylic acids, malate and aspartate, that the Hawaiians had found in labelled sugar cane leaves. In a publication about three years later, Karpilov and a more senior Russian scientist speculated that these results may have been due to faulty killing and extraction procedures. It seems doubtful that they appreciated the full significance of this earlier study.

Our initial experiments were designed to trace the exact fate of carbon assimilated by photosynthesis using 14CO2. Sugar cane leaves were exposed to 14CO2 for various periods under steady-state conditions for photosynthesis, then killed and extracted, and the radioactive products were separated by chromatography, identified and degraded to find out which carbons contained radioactivity. We confirmed the results of the Hawaiian group that most of the radioactivity incorporated after short periods in radioactive CO2 was located in the four-carbon acids malate and aspartate. Substantial radioactive labelling of the PCR cycle intermediates occurred only after longer periods (minutes, rather than seconds).

Critical information was subsequently provided by our so-called ‘pulse–chase’ experiments where a leaf was dosed briefly with 14CO2, and then returned to unlabelled air. The biochemical fate of previously fixed 14C can be followed in sequential samples of tissue. These experiments clearly showed a rapid movement of radioactivity from the four-carbon acid malate into 3-PGA and then later to sugar phosphates and finally into sucrose and starch. There were additional critical results from these initial studies: (1) a chemically unstable dicarboxylic acid, oxaloacetic acid, was rapidly labelled as well as malate and aspartate and was almost certainly the true first product formed; (2) fixed CO2 gave rise to the 4-C carboxyl of these four-carbon acids; and (3) this 4-C carboxyl carbon gave rise to the 1-C carboxyl of 3-PGA. Identification of oxaloacetic acid as an early labelled fixation product was an especially demanding task, and involved generation of a stable derivative that would remain intact during extraction and analysis of 14C fixation products.

Spurred on by this success, we then surveyed a large number of species and found radioactive labelling patterns similar to sugar cane in a number of other grass species, including maize, as well as species from two other plant families. This was an exciting result for us at the time since it clearly showed that this mode of photosynthesis was reasonably widespread taxonomically. The next step in determining the exact nature of this process was to discover the enzymes involved. In species such as sugar cane and maize, there proved to be seven enzyme-catalysed reactions involved in the steps unique to C4 photosynthesis, and these included two steps catalysed by enzymes that had never been described before!

Soon after, we named this process the C4 dicarboxylic acid pathway of photosynthesis — after the first product formed. This was later abbreviated to C4 pathway or C4 photosynthesis and the plants employing this process were termed C4 plants.

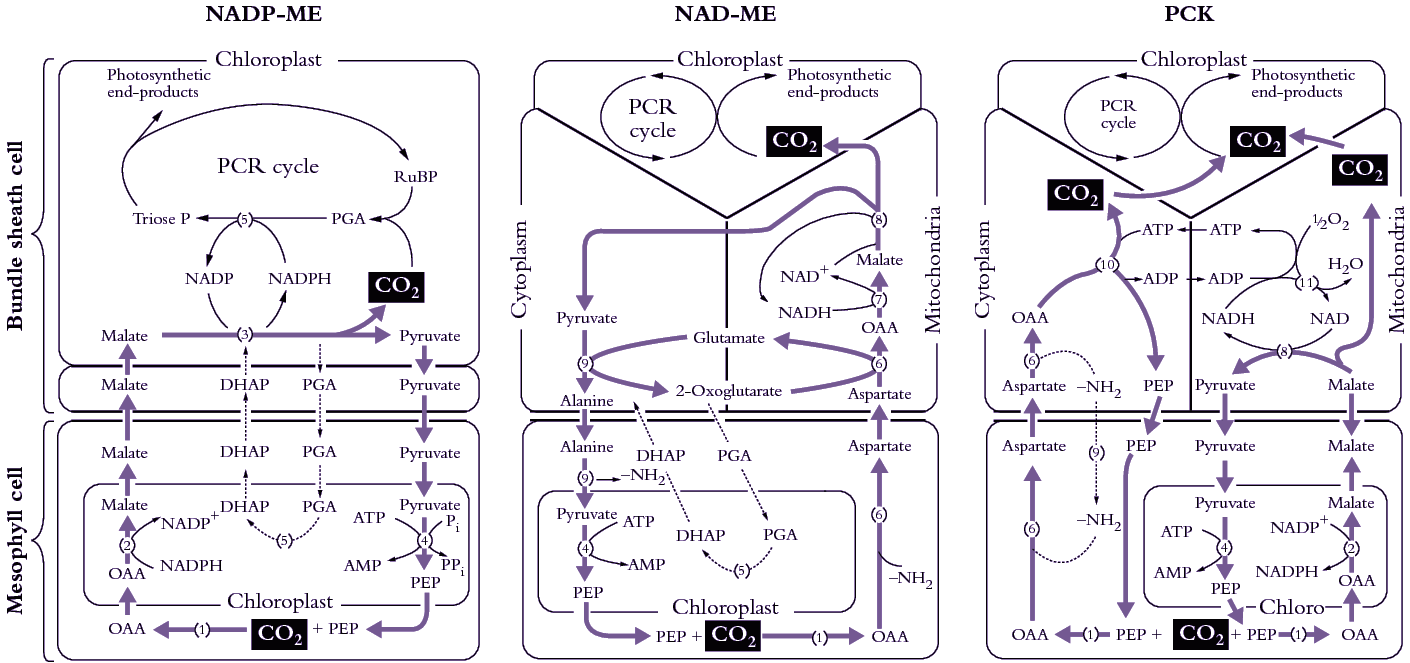
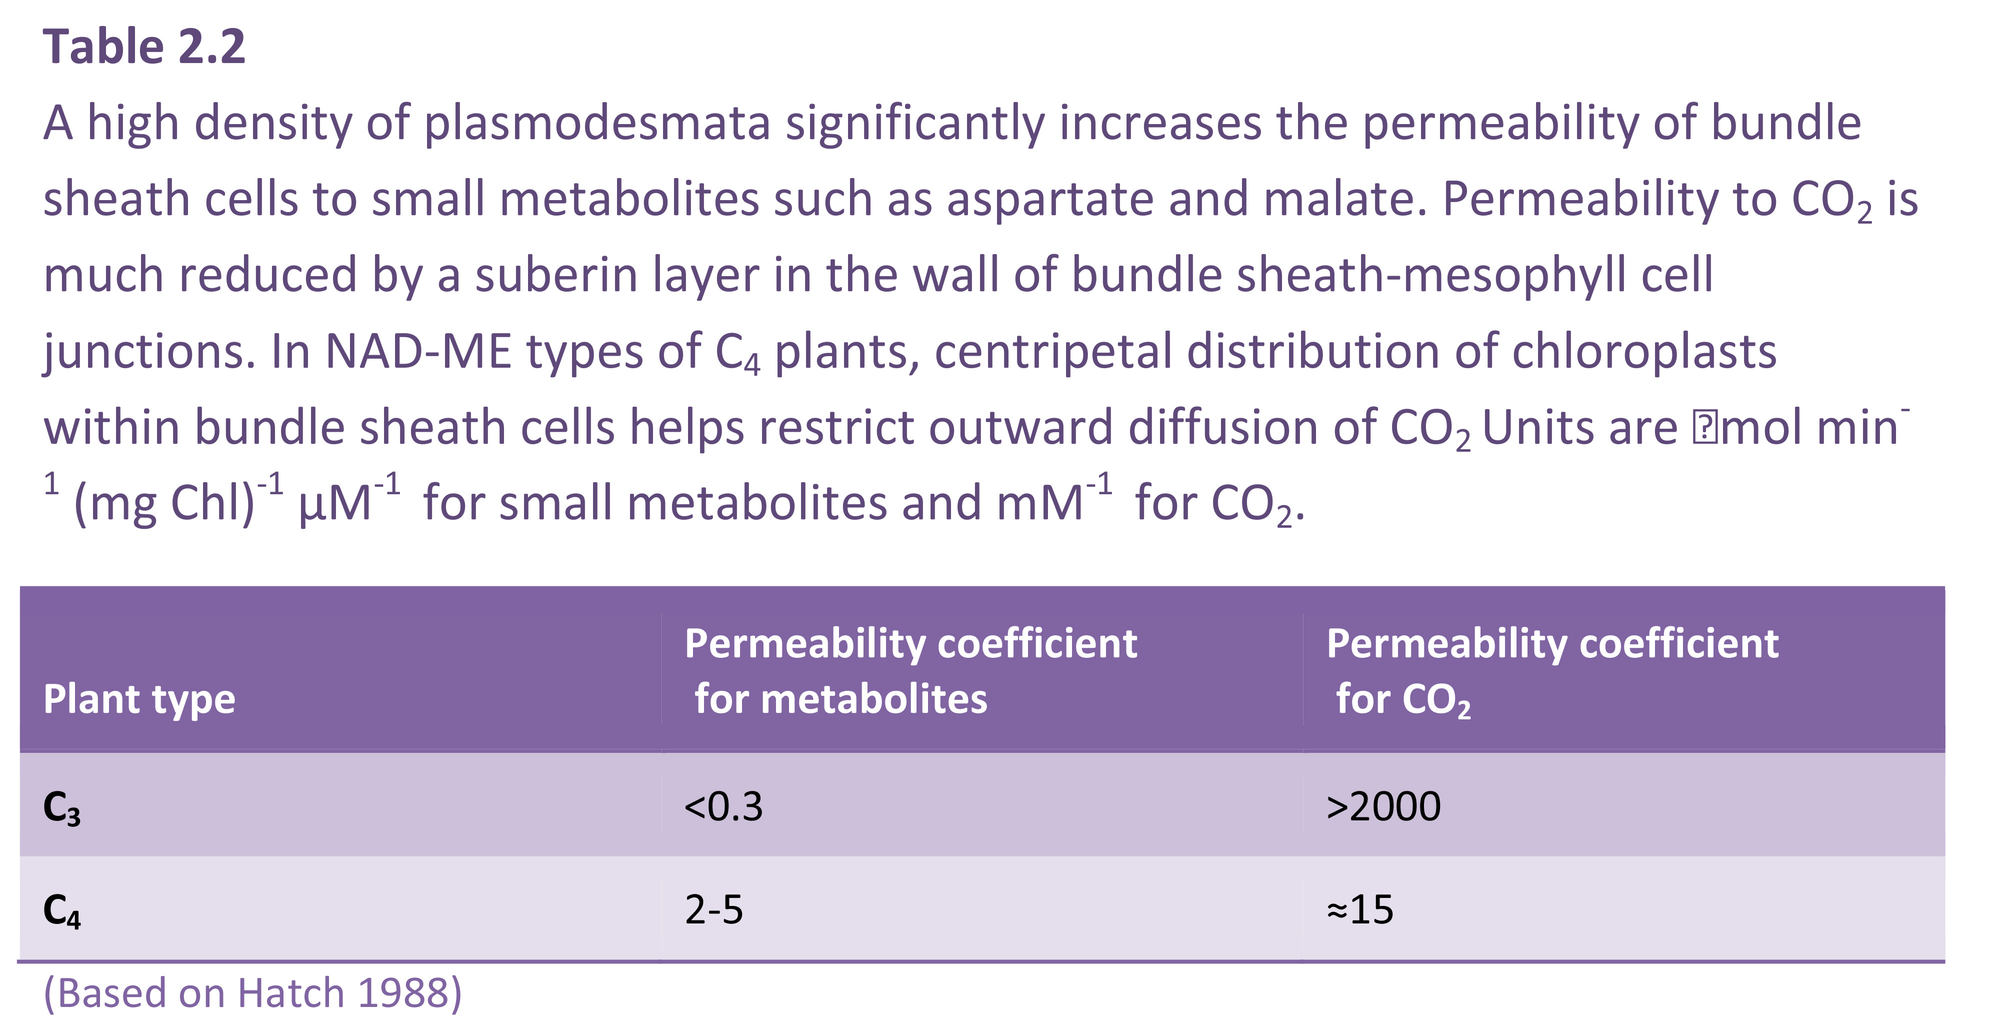
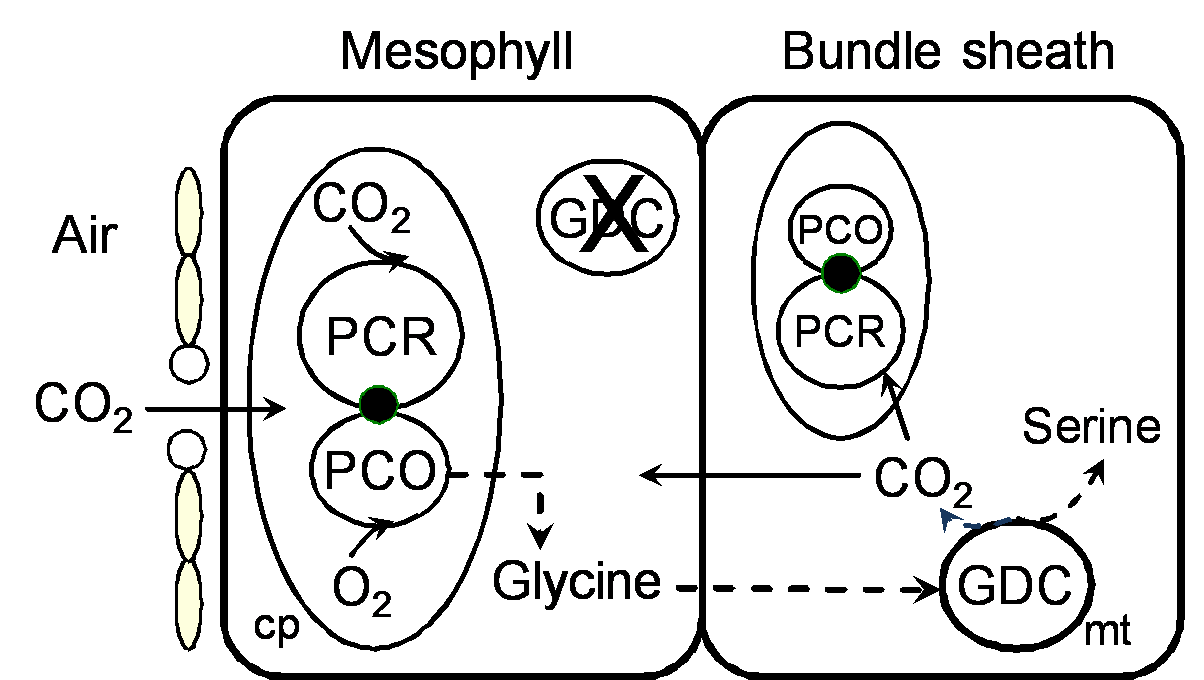
By 1970 we had a reasonably good understanding of how C4 photosynthesis worked in species like maize and sugar cane (see Section 2.2 for details), and suggested that the reactions unique to C4 photosynthesis might function to concentrate CO2 in the bundle sheath cells of C4 leaves, acting essentially as a CO2 pump. Later, we obtained direct experimental evidence that CO2 was indeed concentrated about 10- to 20-fold in these cells in the light.

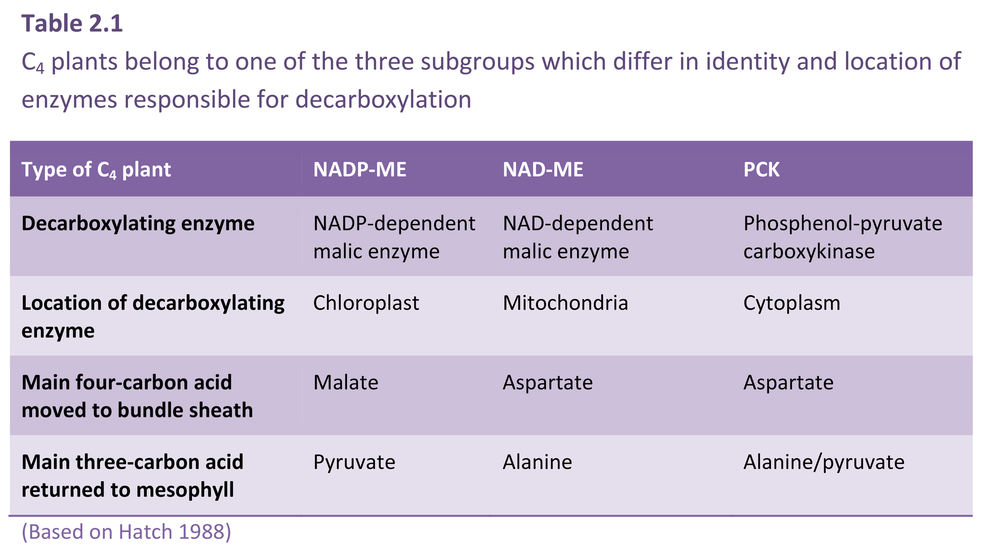
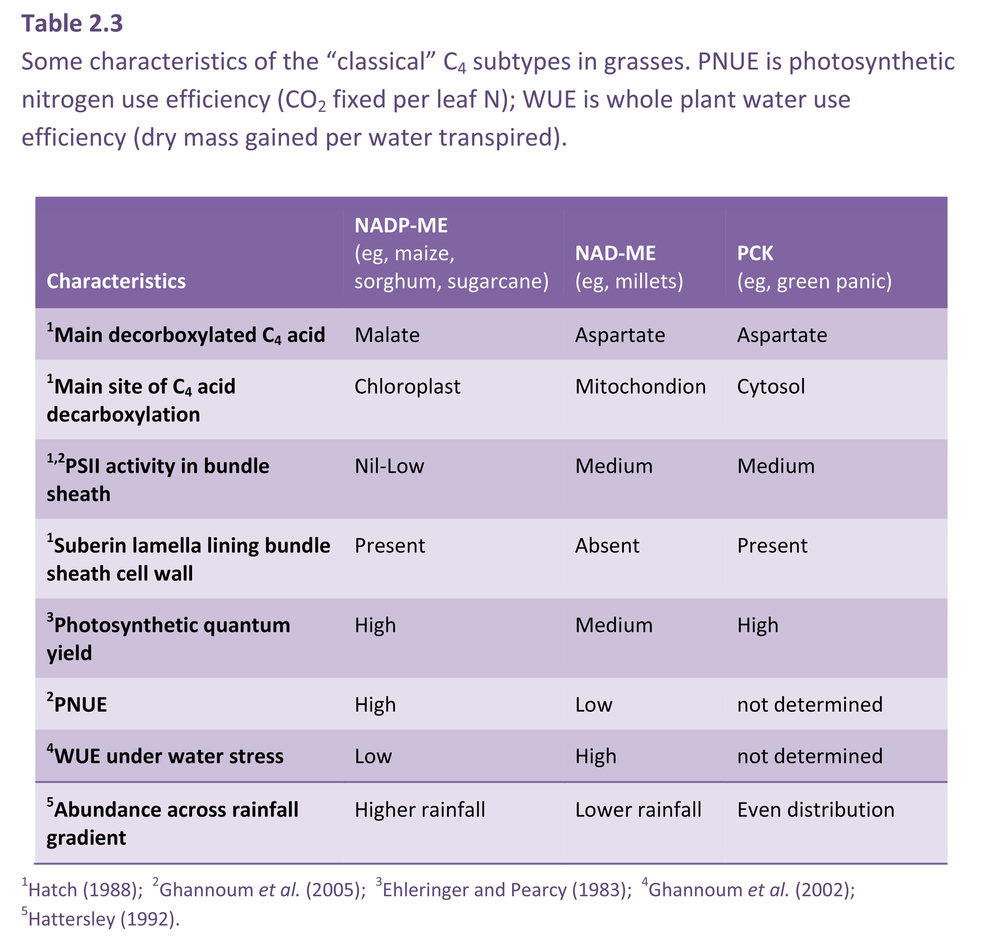
As I mentioned earlier, a major departure from Calvin cycle photosynthesis was never expected. Imagine our surprise, therefore, when it was revealed during the early 1970s that there existed not one, but three different biochemical variants for C4 photosynthesis. On this basis C4 species were divided into three groups, and some connections between process and taxonomic background then emerged.

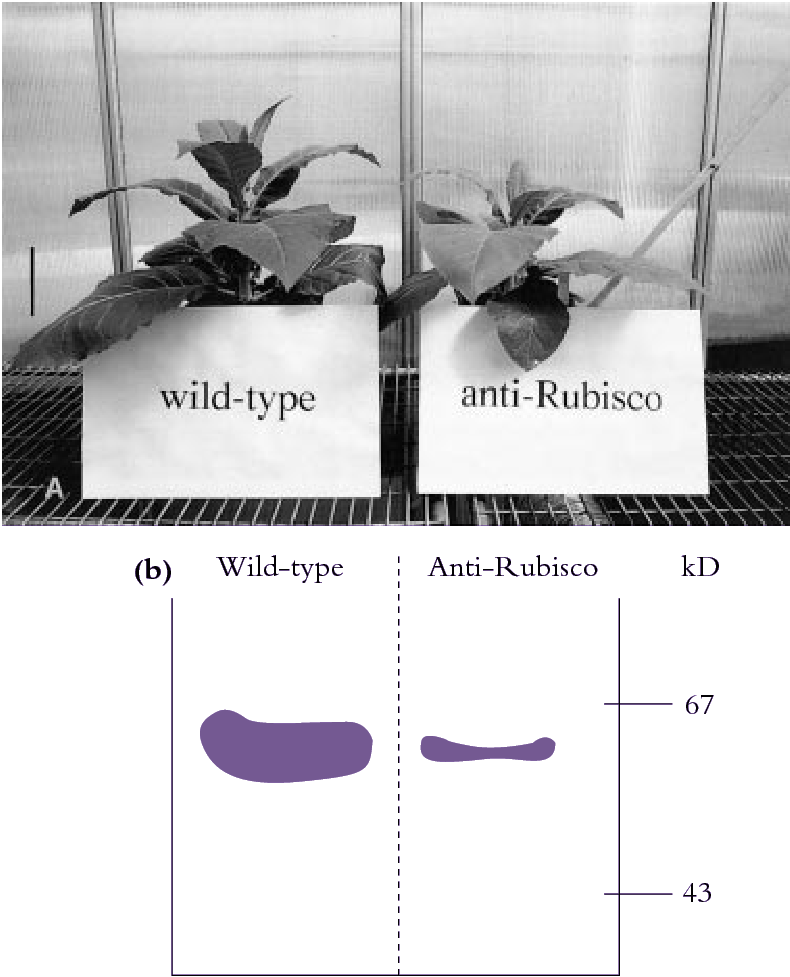
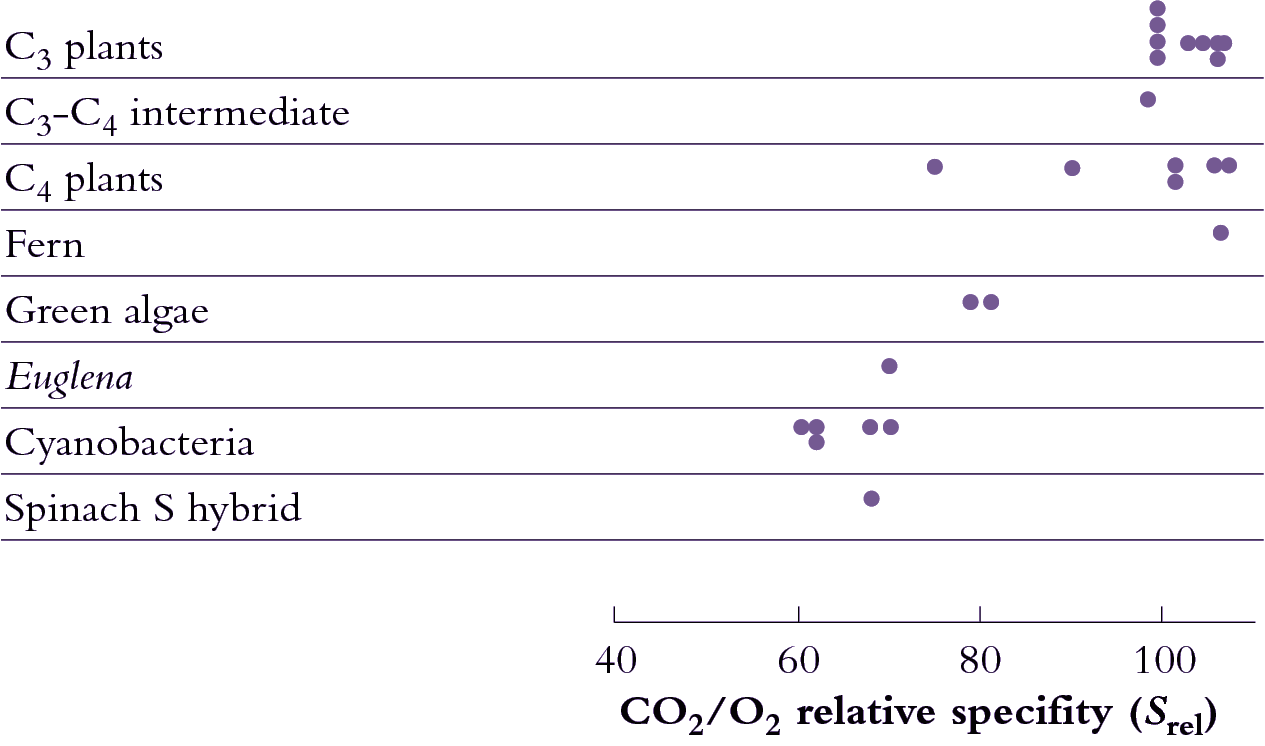
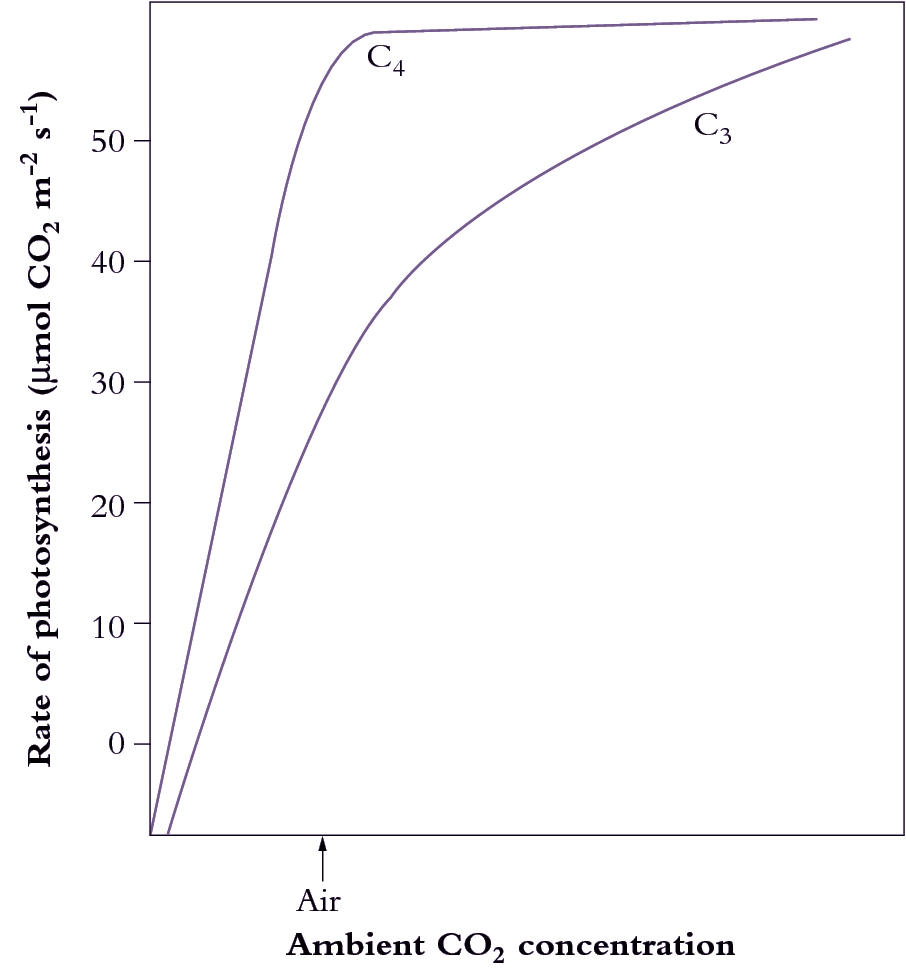
What advantages did all this offer plants over plants that fix CO2 directly by the PCR cycle — that is, using CO2 diffusing directly from air (and distinguished as C3 plants by virtue of their initial three-carbon fixation product phosphoglycerate). As Section 2.2 explains, concentrating CO2 in bundle sheath cells eliminates photorespiration. This, in turn, gives C4 plants distinct advantages in terms of growth and survival, especially at higher temperatures and under strong light. This can be seen most graphically in the distribution of grass species in Australia. In Tasmania, as well as the cooler and wetter southern-most tips of the continent, C4 species are in the minority. However, going north there is a rapid transition and for most of the continent most or all of the grass species are C4.

C4 photosynthesis also offers a potential for growth rates almost twice those seen in C3 plants, but this potential will only be seen at higher temperatures and higher light and this will not be evident in all C4 species. With this kind of growth potential, it is not surprising that C4 species also number among the world’s worst weeds!

As a parting note I should add that about 100 million years ago C3 plants were in their ‘prime’ with atmospheric CO2 concentrations between five and ten times present day levels. However, a new selection pressure then developed. Atmospheric CO2 declined over the next 50–60 million years to something close to our twentieth century levels of about 350 µL–1. This decline almost certainly provided the driving force for evolution of C4 photosynthesis. In other words, C4 photosynthesis was originally ‘discovered’ by nature in the course of overcoming the adverse effects of lower atmospheric CO2 concentration on C3 plants. In effect, C4 processes increase the CO2 concentration in bundle sheath cells to somewhere near the atmospheric CO2 concentration of 100 million years ago.

Further reading

Hatch MD (1987) C4 photosynthesis: a unique blend of modified biochemistry, anatomy and ultrastructure. Biochim Biophys Acta 895: 81–106

Hatch MD (1992) C4 photosynthesis: an unlikely process full of surprises Plant Cell Physiol 33: 333–342

2.2 - C<sub>4</sub> and CAM photosynthesis

Oula Ghannoum, University of Western Sydney, Australia

Approximately 85% of all terrestrial plant species perform C3 photosynthesis, while about 3% fix atmospheric CO2 via the C4 photosynthetic pathway. About 10% of plants carry out crassulation acid metabolism (CAM) and are usually found in highly xeric sites (deserts, epiphytic habitats). C4 plants predominate in open and arid habitats, and also include several important food crops such as maize and sugarcane. This section also covers other, less common photosynthetic modes, such as single-cell C4, C3-C4 intermediate and SAM photosynthesis.

A decline in atmospheric CO2 concentration during past millennia has likely provided the initial impetus for the evolution of C4 photosynthesis. High temperature and low water availability may have constituted additional evolutionary pressures. The key feature of C4 photosynthesis is the operation of a CO2 concentrating mechanism which elevates CO2 concentration around Rubisco sites. Hence, C4 plants have a competitive advantage over C3 plants at high temperature and under strong light because of a reduction in photorespiration and an increase in absolute rates of CO2 fixation at current ambient CO2. Such increase in photosynthetic efficiency results in faster carbon gain and commonly higher growth rates, particularly in subtropical and tropical environments. Consequently, and in response to the looming food security crisis, a global research effort led by IRRI (International Rice Research Institute) is underway to bioengineer C4 photosynthetic traits into major C3 crops, such as rice, in order to boost their photosynthesis, and thus, improve yield and resource use efficiency.

In response to CO2 limitation, not only C3-C4 intermediate, but also CAM and SAM variants have evolved with metabolic concentrating devices which enhance Rubisco performance (Sections 2.2.8 and 2.2.9).

2.2.1 - Evolution of C<sub>4</sub> photosynthesis

Figp2.03.png

Figure 2.3. C4 photosynthesis is an evolutionary development where specialised mesophyll cells initially fix CO2 from the air into 4-carbon acids which are transported to the site of the PCR cycle in the bundle sheath. The bundle sheath cells are relatively impermeable to CO2, so that when the CO2 is released here from the 4-carbon acids, it builds up to high levels. The C4 photosynthetic mechanism is a biochemical CO2 pump. The pathway shown here is overlayed on a micrograph of a C4 leaf, showing bundle sheath and mesophyll cells. Rubisco and the other PCR enzymes are in the bundle sheath cells while phosphoenolpyruvate (PEP) carboxylase is part of the CO2 pump in the mesophyll cells. In C4 plants, after radioactive labelling, 14C appears first in a 4-carbon acid, rather than in 3-PGA. Scale bar = 10 µm. (Original drawings courtesy M.D. Hatch).

One hundred million years ago (Mid-Cretaceous), atmospheric CO2 was between 1500 and 3000 µL L–1, or four to ten times post-industrial levels. Atmospheric CO2 declined during the Oligocene (20-30 million years ago) from the high Tertiary levels (>1000 µL L-1), and oscillated between 180 and 300 µL L-1 for the last 1-3 million years. The Oligocene was also a time when the Earth was dry and the tropics were relatively hot. The earliest origins of C4 photosynthesis date back to this period. Curiously, C4 plants remained in low abundance for a long period of time. According to stable carbon isotopic data, a worldwide expansion of C4 grasslands and savannas occurred during the Late Miocene and Pliocene (3 to 8 million years ago), most probably through the displacement of C3 vegetation (Edwards et al. 2010).

Under the early high concentration of CO2, photorespiration of C3 plants was inhibited (Section 2.3) so that photosynthetic efficiency was higher than it is now. In addition, maximum photosynthetic rates were double twentieth century values, and the energy cost of photosynthesis would have been around three ATP and two NADPH per molecule of CO2 fixed. As atmospheric CO2 concentrations declined to approximately 250–300 µL L–1, photosynthetic rates were halved, photorespiration increased substantially, photosynthetic efficiency declined and the energetic costs of photosynthesis increased to approximately five ATP and 3.2 NADPH per CO2 molecule fixed. Such events would have generated a strong selection pressure for genetic variants with increased carboxylation efficiency and increased photosynthetic rates.

Angiosperms have a higher relative specificity of Rubisco for CO2 than ferns and mosses (see examples of other less evolutionarily advanced species in Figure 2.3). Such differences imply minor evolution in this highly conserved molecule of Rubisco and there is little variation between species of vascular plants. Consequently, alteration of Rubisco in response to a changing atmospheric CO2 concentration has not been an option.

By contrast, evolution of a new photosynthetic pathway (C4) has occurred independently and on many occasions in diverse taxa over 25 to 30 million years as CO2 levels declined. Despite its complexity, C4 photosynthesis evolved more than 60 independent times in 19 distantly related flowering families. About 50% of C4 species are grasses (Poaceae) with ~18 distinct origins distributed over 370 genera and ~4600 species (Sage et al. 2011). The oldest identifiable fossils with pronounced bundle sheath layers are seven million years old, although necessary metabolic pathways could have evolved earlier, prior to this adaptation in anatomy. C4 plants are known to differ from C3 plants in their discrimination against atmospheric 13CO2, and shifts in the stable carbon isotope signature of soil carbonate layers that reflect emergence of C4 plants have been dated at 7.5 million years bp. Modern evidence from molecular phylogeny places the origin of the main C4 taxa at 25-30 million years ago (Christin et al. 2009). By inference, C4 photosynthesis evolved in response to a significant decline in atmospheric CO2 concentration, from 1500–3000 µL L–1 to about 300 µL L–1. By evolving a CO2-concentrating mechanism, C4 plants presented their Rubisco with an elevated partial pressure of CO2 despite lower atmospheric CO2. As a consequence, photorespiration was inhibited, maximum photosynthetic rates increased and energetic costs reduced.

2.2.2 - The CO<sub>2</sub> concentrating mechanism in C<sub>4</sub> photosynthesis

The C4 pathway (Figure 2.3) is ‘a unique blend of modified biochemistry, anatomy and ultra-structure’ (Hatch 1987). The classical C4 syndrome in most terrestrial plants consists of two photosynthetic cycles (C3 (or PCR) and C4) operating across two photosynthetic cell types (mesophyll and bundle sheath), which are arranged in concentric layers around the vascular bundle, also known as the kranz anatomy.

Figp2.04.png

Figure 2.5. CO2 photosynthesis response curves show that C4plants have a higher affinity for CO2. At common ambient levels of CO2, photosynthesis in a C4 leaf is almost fully CO2-saturated, whereas a C3 plant is operating at only one-half to two-thirds maximum rate. This contrast is due to the CO2-concentrating function of C4 photosynthesis. More sophisticated measurement of leaf assimilation as a function of intercellular CO2 (Figures 1-3 in Case study 1.1) can be used to reveal component processes. (Original drawings courtesy M.D. Hatch)

Initial and rapid fixation of CO2 within mesophyll cells results in the formation of a four-carbon compound which is then pumped to bundle sheath cells for decarboxylation and subsequent incorporation into the PCR cycle in that tissue. This neat division of labour hinges on specialised anatomy and has even resulted in evolution of distinct classes of chloroplasts in mesophyll compared with bundle sheath cells. Three biochemical variants of C4 photosynthesis (termed subtypes) are known to have evolved from C3 progenitor and in all cases with a recurring theme where the C4 cycle of mesophyll cells is complemented by a PCR cycle in bundle sheath cells, where Rubisco is exclusively localised. In effect, a biochemical ‘pump’ concentrates CO2 at Rubisco sites in bundle sheath cells thereby sustaining faster net rates of CO2 incorporation and virtually eliminating photorespiration. For this overall mechanism to have evolved, a complex combination of cell specialisation and differential gene expression was necessary. Figure 2.3a shows a low-magnification electron micrograph of a C4 leaf related to a generalised scheme for the C4 pathway.

plate02(ab).jpg

Figure 2.6. Rubisco can be localised in transverse sections of leaves by indirect immunofluorescent labelling where treated sections are viewed in conjunction with autofluorescence controls. Tissues such as bundle sheath extensions and epidermes fluoresce naturally, and such emission has to be ‘subtracted’ from present images. Considering (a), all chloroplasts in this C3 grass leaf (Microlaena stipoides) show a strong yellow fluorescence, indicating general distribution of Rubisco, and hence operation of the PCR cycle. By contrast, in (b), the C4 grass (Digitaria brownii) has restricted Rubisco to bundle sheath cells. In that case, mesophyll cells are devoid of Rubisco, fixing CO2 via the action of phosphoenolpyruvate carboxylase into a four-carbon acid which moves to bundle sheath cells, there providing CO2 for subsequent relaxation via Rubisco and the PCR cycle. Scale bar = 100 µm. (Original light micrographs courtesy Paul Hattersley).

By analogy with Calvin’s biochemical definition of the C3 pathway at Berkeley in the 1950s, the C4 pathway was also delineated with radioactively labelled CO2 (see Feature Essay 2.1). Significantly, and unlike C3 plants, 3-PGA is not the first compound to be labelled after a 14C pulse (Figure 2.3b). Specialised mesophyll cells carry out the initial steps of CO2 fixation utilising the enzyme phosphoenolpyruvate (PEP) carboxylase. The product of CO2 fixation, oxaloacetate, is a four-carbon organic acid, hence the designation ‘C4’ photosynthesis (or colloquially, C4 plant). A form of this four-carbon acid, either malate or aspartate depending on the C4 subtype, migrates to the bundle sheath cells which contain Rubisco and the PCR cycle. In the bundle sheath cells, CO2 is removed from the four-carbon acid by a specific decarboxylase and a three-carbon product returns to the mesophyll to be recycled to PEP for the carboxylation reaction. Thus, label first appears in the four-carbon acid after 14C feeding, followed by 3-PGA and, finally, in sucrose and starch (Figure 2.1b).

A physical barrier to CO2 diffusion exists in the thickened walls of the bundle sheath cells (lined with suberised in some C4 species), preventing CO2 diffusion back to the mesophyll and allowing CO2 build up to levels at least 10 times those of ambient air. Build up of CO2 in the bundle sheath is also facilitated by the higher activity ratio (2-4 times) of PEP carboxylase relative to Rubisco in C4 plants. Rubisco is thus exposed to a saturating concentration of CO2 which both enhances carboxylation due to increased substrate supply, and forestalls oxygenation of RuBP (hence photorespiration) by outcompeting O2 for CO2 binding sites on Rubisco (Figure 2.5).

In leaves of C3 plants, the PCR cycle operates in all mesophyll chloroplasts, but in C4 plants the PCR cycle is restricted to bundle sheath cells (Figure 2.3). Rubisco is pivotal in this cycle, and can be used as a marker for sites of photosynthetic carbon reduction. Rubisco was visualised by localising this photosynthetic enzyme with antibodies via indirect immunofluorescent labelling (Hattersley et al. 1977; Figure 2.6). In this pioneering method, ‘primary’ rabbit anti-Rubisco serum (from rabbits injected with purified Rubisco) is first applied to fixed transverse sections of leaves. Rabbit antibodies to Rubisco bind to the enzyme in situ. Then ‘secondary’ sheep anti-rabbit immunoglobulin tagged with a fluorochrome (fluorescein isothiocyanate) is applied to the preparation. This fluorochrome binds specifically to the rabbit antibodies and fluoresces bright yellow wherever Rubisco is located (blue light excitation using an epifluorescence light microscope).

In the C3 grass Microlaena stipoides (Figure 2.6a), all chloroplasts are fluorescing bright yellow and this indicates wide distribution of Rubisco throughout mesophyll tissue. By contrast, only bundle sheath cells are equipped with Rubisco in the C4 grass Digitaria brownii (Figure 2.6b). These two native Australian grasses co-occur in the ACT but contrast in relative abundance. M. stipoides (weeping grass) is common in dry sclerophyll woodlands throughout southeast temperate Australia, whereas D. brownii (cotton panic grass) in the ACT is at the southern end of its distribution, being far more abundant in subtropical Australia and, in keeping with its C4 physiology, especially prevalent in semi-arid regions.

2.2.3 - Energetics of C<sub>4</sub> photosynthesis

Figp2.06.png

Figure 2.7. Generalised light response curves for leaf photosynthesis show that C4 plants assimilate comparatively faster at high temperature (35°C), but that C3 plants are advantaged at low temperature (10°C). Photorespiration increases with temperature, and is largely responsible for this contrast. C4 plants are equipped with a CO2-concentrating device in their bundle sheath tissue which both enhances Rubisco’s performance at that location, and forestalls photorespiratory loss. (Original drawings coustesy M.D. Hatch).

One disadvantage of the C4 pathway is that an energy cost is incurred by C4 plants to run the CO2 ‘pump’. This is due to the ATP required for recycling PEP from pyruvate by the chloroplastic enzyme pyruvate, Pi dikinase in the mesophyll cells (Figure 2.4 and Hatch 1987). Under ideal conditions, five ATP and two NADPH are required for every CO2 fixed in C4 photosynthesis (two ATP are required to run the CO2 pump, i.e., regenerate PEP). In addition, a proportion (20-30%) of CO2 fixed by PEP carboxylase in the mesophyll is not fixed by Rubisco in the bundle sheath, and subsequently leaks back to the mesophyll. This leaked (or overcycled) CO2 represents an additional, inherent energetic cost of the C4 pathway.

From the previous section, the C4 pathway is obviously energetically more expensive than the C3 pathway in the absence of photorespiration. However, at higher temperatures the ratio of RuBP oxygenation to carboxylation is increased and the energy requirements of C3 photosynthesis can rise to more than five ATP and three NADPH per CO2 fixed in air (for these calculations see Hatch 1987).

Representative light response curves for photosynthesis in C3 cf. C4 plants (Figure 2.7) can be used to demonstrate some of these inherent differences in photosynthetic attributes. At low temperature (10°C in Figure 2.7) a C3 leaf shows a steeper initial slope as well as a higher value for light-saturated photosynthesis. By implication, quantum yield is higher and photosynthetic capacity is greater under cool conditions. In terms of carbon gain and hence competitive ability, C3 plants will thus have an advantage over C4 plants at low temperature and especially under low light.

By contrast, under warm conditions (35°C, upper curves in Figure 2.7) C4 photosynthesis in full sun greatly exceeds that of C3, while quantum yield (inferred from initial slopes) remains unaffected by temperature. Significantly, C3 plants show a reduction in quantum yield under warm conditions (compare 10°C and 35°C curves; right side of Figure 2.7). At 35°C C3 plants also show lower rates of light-saturated assimilation compared with C4 plants. Increased photorespiratory losses from C3 leaves at high temperature are responsible (Section 2.3). C4 plants will thus have a competitive advantage over C3 plants under warm conditions at both high and low irradiance.

2.2.4 - The biochemical subtypes of C<sub>4</sub> photosynthesis

C4 photosynthesis calls for metabolic compartmentation which is in turn linked to specialised anatomy (Figure 2.4). Three biochemical subtypes of C4 photosynthesis have evolved which probably derive from subtle differences in the original physiology and leaf anatomy of their C3 progenitors.

CO2 assimilation by all three C4 subtypes (Figure 2.8) involves five stages:

  1. carboxylation of PEP in mesophyll cells, thereby generating four-carbon acids (malate and/or aspartate);
  2. transport of four-carbon acids to bundle sheath cells;
  3. decarboxylation of four-carbon acids to liberate CO2;
  4. re-fixation of this CO2 via Rubisco within the bundle sheath, using the C3 pathway;
  5. transport of three-carbon acid products following decarboxylation back to mesophyll cells to enable synthesis of more PEP.

Figp2.13.png

Figure 2.8. C4 plants belong to one of three subtypes represented here (left to right) as NADP-ME, NAD-ME and PCK. Each subtype has a distinctive complement and location of decarboxylating enzymes, and each differs with respect to metabolites transferred between mesophyll and bundle sheath. The path of carbon assimilation and intracellular location of key reactions are shown for each of these biochemically distinct subtypes. Heavy arrows indicate the main path of carbon flow and associated transport of metabolites. Enzymes involved (numbers shown in parentheses) are as follows: (1) PEP carboxylase, (2) NADP-malate dehydrogenase, (3) NADP malic enzyme, (4) pyruvate Pi dikinase, (5) 3-PGA kinase and GAP dehydrogenase, (6) aspartate aminotransferase, (7) NAD-malate dehydrogenase, (8) NAD-malic enzyme, (9) alanine aminotransferase, (10) PEP carboxykinase, (11) mitochondrial NADH oxidation systems. In PCK-type C4 plants, the PGA/DHAP shuttle would also operate between cells as indicated for NADP-ME and NAD-ME. Cycling of anaino groups between mesophyll and bundle sheath cells involves alanine and alanine aminotransferase. (Original diagram courtesy M.D. Hatch).

Recognising some systematic distinctions in whether malate or aspartate was transported to bundle sheath cells, C4 plants were further subdivided into three subtypes according to their four-carbon acid decarboxylating systems and ultrastructural features (Hatch et al. 1975). Members of each subtype contain high levels of either NADP-malic enzyme (NADP-ME), phosphoenolpyruvate carboxykinase (PCK) or NAD-malic enzyme (NAD-ME) (so designated in Figure 2.8). High NADP-malic enzyme activity is always associated with higher NADP-malate dehydrogenase activity, while those species featuring high activities of either of the other two decarboxylases always contain high levels of aminotransferase and alanine aminotransferase activities. As a further distinction, each of the decarboxylating enzymes is located in bundle sheath cells; NAD-malic enzyme is located in mitochondria but PEP carboxykinase is not.

In all three subtypes, the primary carboxylation event occurs in mesophyll cytoplasm with PEP carboxylase acting on HCO3 to form oxaloacetate. However, the fate of this oxaloacetate varies according to subtype (Table 2.1; Figure 2.8). In NADP-ME species, oxaloacetate is quickly reduced to malate in mesophyll chloroplasts using NADPH. By contrast, in NAD-ME and PCK species, oxaloacetate is transaminated in the cytoplasm, with glutamate donating the amino group, to generate aspartate. Thus, malate is transferred to bundle sheath cells in NADP-ME species and aspartate is transferred in NAD-ME and PCK species. The chemical identity of three-carbon acids returned to mesophyll cells varies accordingly.

In NADP-ME species, only chloroplasts are involved in decarboxylation and subsequent carboxylation via the PCR cycle (Figure 2.8). By contrast, in NAD-ME and PCK species, chloroplasts, cytoplasm and mitochondria are all involved in moving carbon to the PCR cycle of bundle sheath chloroplasts. In NAD-ME and PCK species, aspartate arriving in bundle sheath cells is reconverted to oxaloacetate in either mitochondria (NAD-ME) or cytoplasm (PCK) (Table 2.2). Reduction and decarboxylation of oxaloacetate occurs in mitochondria of NAD-ME species and CO2 is thereby released for fixation by chloroplasts of bundle sheath cells. In PCK species, oxaloacetate in the cytoplasm is decarboxylated by PCK, thereby releasing CO2 for fixation in bundle sheath chloroplasts (Figure 2.8).

Transport of metabolites to bundle sheath cells

A rapid transfer of malate and aspartate to bundle sheath cells from mesophyll cells is required if the CO2 concentration in bundle sheath cells is to stay high. A very high density of plasmodesmata linking bundle sheath cells to mesophyll cells facilitates this traffic. Consequently, the permeability coefficient of C4 bundle sheath cells to small metabolites such as four-carbon acids is about 10 times larger than that of C3 mesophyll cells (Table 2.2). However, coupled with this need for a high permeability to metabolites moving into bundle sheath cells is a low permeability to CO2 molecules so that CO2 released through decarboxylation in the bundle sheath does not diffuse rapidly into mesophyll air spaces. For some species, a layer of suberin in the cell wall of bundle sheath–mesophyll junctions (suberin lamella) significantly reduces CO2 efflux (Table 2.2).

Centrifugal versus centripetal chloroplasts

Not all species contain a suberin layer, but all C4 plants have a need to prevent CO2 from diffusing quickly out of bundle sheath cells, so that the location of chloroplasts of bundle sheath cells becomes critical in those species lacking a suberin layer (Figure 2.9). Where species have a suberin layer, chloroplasts are located in a centrifugal position, that is, on the wall furtherest away from the centre of the vascular bundle lying in the middle of the bundle sheath (Figure 2.9E, F). In those C4 species lacking a suberin layer, chloroplasts are located centripetally, that is, on the wall closest to the centre of the vascular bundle lying within the bundle sheath (Figure 2.9A, B). Such a location would help restrict CO2 diffusion from bundle sheath to mesophyll cells.

Fig 2.14.jpg

Figure 2.9. C4 plants belong to one of three subtypes shown here in cross-section as light micrographs (left side) and electron micrographs (right side). Top to bottom, these subtypes are designated NAD-ME (A, B) PCK (C, D) and NADP-ME (E, F). Features common to all subtypes include a vascular bundle (V), bundle sheath (B), mesophyll tissue (M) and chloroplasts (C).

Subtype NAD-ME (A, B) is represented by Amaranthus edulis and shows bundle sheath cells with centripetally located chloroplasts containing small starch grains and surrounded by mesophyll cells. The accompanying electron micrograph of a cytoplasmic region of a bundle sheath cell shows chloroplasts and numerous large mitochondria. Scale bar in A = 50 µm; in B = 2 µm.

Subtype PCK (C, D) is represented by Chloris gayana with chloroplasts arranged around the periphery of bundle sheath cells and adopting a centrifugal position. Mitochondria show well-developed internal membrane structures. Scale bar in C = 25 µm; in D = 3 µm.

Subtype NADP-ME is represented by Zea mays where the bundle sheath contains centrifugally located chloroplasts with numerous starch grains, but lacking grana. Chloroplasts in adjacent mesophyll cells are strongly granal. Bundle sheath cells contain few mitochondria and these show only moderate development of internal membrane structures. Scale bar in E = 25 µm; in F scale bar = 2 µm (Micrographs courtesy Stuart Craig and Celia Miller).

Regulation of C4 photosynthesis

Fixation of CO2 by C4 plants involves the coordinated activity of two cycles in separate anatomical compartments (Figure 2.8). The first cycle is C4 (carboxylation by PEP carboxylase), the second is C3 (carboxylation by Rubisco). Given this biochemical and anatomical complexity, close regulation of enzyme activities is a prerequisite for efficient coordination.

PEP carboxylase, NADP-malate dehydrogenase and pyruvate orthophosphate dikinase are all light-regulated and their activities vary according to irradiance. NADP-malate dehydrogenase is regulated indirectly by light via the thioredoxin system.

PEP carboxylase in C4 plants exists in the same homo-tetramer in light- and dark-acclimated leaves. This is in marked contrast to CAM species where different forms exist in light- and dark-acclimated leaves. In C4 plants, PEP carboxylase has extremely low activity at night, thus preventing uncontrolled consumption of PEP. Such complete loss of activity in darkness is mediated via divalent metal ions, pH plus allosteric activators and inhibitors. As a consequence, and over a period of days, C4 plants can increase or decrease PEP carboxylase in response to light regime.

2.2.5 - Environmental physiology of C<sub>3</sub> versus C<sub>4</sub> photosynthesis

Rubisco is characterised by its low affinity for its productive substrate, CO2 and slow catalytic turnover rate (i.e., 1-3 cycles per sec). Importantly, Rubisco reacts with O2 (photorespiration), and this culminates in loss of CO2 and energy. In C3 plants, photorespiration can drain more than 25% of fixed CO2 under non-stressful conditions. The ratio of photorespiration to photosynthesis increases with increasing temperature and decreasing intercellular CO2 such as occurs when stomatal conductance is reduced under water stress. C3 plants compensate for Rubisco’s inefficiencies by (i) opening their stomata to increase CO2 diffusion into chloroplasts, which increases water loss and lowers leaf-level water use efficiency, WUE; and (ii) investing up to 50% of leaf nitrogen in Rubisco, which lowers their leaf-level nitrogen use efficiency, NUE.

The C4 pathway supercharges photosynthesis and suppresses photorespiration by operating a CO2 concentrating mechanism which elevates CO2 around Rubisco. Although C4 photosynthesis incurs additional energy, the energy cost of photorespiration exceeds that of the CO2 concentrating mechanism above 25oC. Hence, higher radiation use efficiencies (i.e., efficiency of converting absorbed radiation into biomass) have been recorded for C4 than C3 crops. High bundle sheath CO2 concentration saturates C4 photosynthesis at relatively low intercellular CO2, allowing C4 plants to operate with lower stomatal conductance. Thus, leaf-level WUE is usually higher in C4 than C3 plants. Relative to C3 plants, Rubisco of C4 plants is faster (higher turnover rate) and operates under saturating CO2. Thus, C4 plants typically achieve higher photosynthetic rates with about 50% less Rubisco and less leaf nitrogen. Hence, photosynthetic NUE is higher in C4 than C3 plants. Accordingly, C4 plants are advantaged relative to C3 plants in hot and nitrogen-poor environments with short growing seasons, hence their great abundance in wet/dry tropics such as Northern Territory savannas.

As mentioned earlier, more than 50% of C4 plants are grasses. C4 grasses are confined to low latitudes and altitudes, whereas C3 species dominate at higher latitudes and altitudes. Generally, C4 species frequently occur in regions of strong irradiance. Ehleringer and colleagues (Ehleringer et al. 1997) proposed that these distribution patterns are best explained by the different responses of photosynthetic quantum yields to temperature between C3 and C4 plants.

C4 photosynthesis suppresses photorespiration by operating a CO2 concentrating mechanism that comes at additional energetic cost. This cost is independent of ambient CO2 and temperatures. In contrast, photorespiration (and its associated energy cost) increases steeply with temperature in C3 plants and is highly dependent on CO2 concentrations. Under saturating irradiance and current ambient atmospheric CO2 concentration, the threshold temperature where the cost of photorespiration in C3 plants exceeds that of the CO2 concentrating mechanism in C4 plants is estimated around 25oC. This model provides a physiological basis for understanding today’s contrasting geographic distribution between C3 and C4 grasses.

As an example, the C4 grasses of the northern Australian savannas are relatively un-shaded because of the low tree density and sparse canopy. Light is abundant and since the CO2 concentration inside C4 leaves is high, a potentially high rate of light-saturated assimilation can be exploited. Most C3 species reach light saturation in the range of one-eight to one-half full sunlight (Figure 2.7). In C4 species, canopy assimilation might not become light saturated even in full sunlight. Cplants thus maintain a competitive advantage over C3 plants in tropical locations, where average daily light receipt is much larger than in temperate zones, and associated with warmer conditions that also favour C4 photosynthesis (Figure 2.6). Given strong sunlight, warmth and seasonally abundant water, biomass production by C4 plants is commonly double the rate for C3 plants. Typically, C3 plants produce 15–25 t ha–1 but C4 plants easily produce 35–45 t ha–1.

Physiological characteristics of the C4 subtypes

As outlined in previous sections, characteristic biochemical, anatomical and physiological traits are associated with each of the three “classical” C4 subtypes (Table 2.3). However, it should be noted that many C4 plants have leaf structures that fall outside the “classical” subtype division (eg, NADP-ME tribes, Arundinelleae and Neurachneae). As many as 11 anatomical-biochemical suites have been identified in C4 grasses. A curious aspect about the subtypes of C4 grasses is their biogeography. In Australia and elsewhere, NADP-ME grasses are more frequent at higher rainfall, NAD-ME grasses predominate at lower rainfall, while the distribution of PCK grasses is even across rainfall gradients (Hattersley 1992).

2.2.6 - Single-cell C<sub>4</sub> photosynthesis

The fundamental paradigm underpinning the efficiency of C4 photosynthesis in terrestrial plants is the ‘division of labour’ between the initial fixation of CO2 into C4 acids, and their subsequent utilisation to generate high concentrations of CO2 for ultimate fixation by Rubisco. The basic model for C4 plants with classical kranz anatomy consists of two photosynthetic cycles (C3 and C4) operating across two photosynthetic cell types (mesophyll and bundle sheath), with strict cell- and organelle-specific localisation of key enzymes and with sufficient resistance to CO2 back-diffusion. Indeed, the discovery of the kranz anatomy by Haberlandt preceded that of C4 biochemistry by a century. The prevailing consensus has been that efficient C4 photosynthesis necessitates the collaboration of two cell types.

Recently, this notion has been challenged by the discovery of non-kranz or single-cell C4 photosynthesis in shrubs (Borszczowia aralocaspica and Bienertia cycloptera; Chenopodiaceae family) found in the salt deserts of Central Asia (Voznesenskaya et al. 2002, 2003). These plants show CO2 and O2 responses typical of C4 photosynthesis but lack the kranz anatomy. They perform C4 photosynthesis through the spatial localisation of dimorphic chloroplasts (as well as other organelles and photosynthetic enzymes) in distinct positions within a single chlorenchyma cell. Yet, the details of the partitioning differ between the two species (Edwards et al. 2004).

In Bienertia, the central cytoplasmic compartment of the chlorenchyma cell plays the role of bundle sheath cells in kranz-type C4 (NAD-ME) plants; it is filled with mitochondria surrounded by chloroplasts. The peripheral cytoplasm lacks mitochondria and plays the role of the mesophyll cell in kranz-type C4 plants. Accordingly, chloroplastic Rubisco and mitochondrial NAD-ME and glycine decarboxylase are restricted to the central compartment; chloroplastic pyruvate, Pi dikinase is restricted to the peripheral compartment, which is highly enriched with cytosolic PEP carboxylase. In Borszczowia, the compartmentation occurs at the distal (mesophyll equivalent) and proximal (bundle sheath equivalent) ends of the elongated, cylindrical chlorenchyma cell. The inter-connecting cytoplasm between the two intra-cellular compartments provides a liquid diffusion path, thus replacing the role of the bundle sheath cell wall in kranz-type C4 plants (Edwards et al. 2004).

A low conductance for CO2 diffusion out of the bundle sheath cells (or its equivalent cellular compartment) is critical for the efficient operation of C4 photosynthesis. The total diffusive resistance to CO2 has multiple components with different levels of contribution. These components include bundle sheath walls, membranes, bundle sheath chloroplast position, the site of C4 acid decarboxylation, and the liquid-phase diffusion path. For kranz-type C4 plants, calculated total bundle sheath resistance on a leaf area basis can range from 50 to 150 m2 s-1 mol-1 (von Caemmerer and Furbank 2003). Evidently, single-cell C4 plants have sufficient resistance to CO2 back-diffusion which is essentially made of the cytoplasmic liquid phase and the special localisation of the (Rubisco-containing) chloroplasts surrounding the mitochondria (site of C4 acid decarboxylation).

Thus, single-cell C4 plants have efficient photosynthesis which is not inhibited by O2, and their carbon isotope values are similar to kranz-type C4 plants. Although, single-cell C4 photosynthesis breaks away from the classical kranz anatomy, it remains within the general ‘division of labour’ paradigm.

2.2.7 - C<sub>3</sub>-C<sub>4</sub> photosynthesis

More than 40 eudicot and monocot species distributed over 21 lineages have been reported to possess intermediate C3 and C4 photosynthetic characteristics and CO2 compensation points. These intermediate species are likely remnants of the complex processes that led to the evolution of C4 plants from C3 ancestors, although reversions from the C4 condition have also been suggested. Moreover, a number of identified C3-C4 species occur in taxa that are not closely related to any C4 lineage, raising the possibility that the C3-C4 photosynthetic pathway may be a distinct adaptation. This, in addition to the small number of intermediate species found so far cast doubts over their physiological and ecological fitness, and whether they represent living fossils of evolutionary paths or evolutionary dead-ends (Rawsthorne 1992; Sage et al. 2011).

Leaves of all C3-C4 intermediates have partial or full kranz anatomy, with prominent bundle sheath cells containing chloroplasts and other organelles, and intermediate interveinal distances. Bundle sheath chloroplasts contain Rubisco and functional PCR cycle in both mesophyll and bundle sheath cells. Intermediate leaves also have CO2 compensation points that are lower than what is observed for C3 leaves and can be indistinguishable from C4 leaves, due to reduced photorespiration. Biochemically, C3-C4 intermediates differ in the level of activity of the C4 cycle and the extent to which CO2 is concentrated in bundle sheath cells.

Picture4-1.png

Figure 2.10. Schematic representation of the ‘photorepiratory pump’ operating in C3-C4 photosynthesis. The intermediate photosynthetic pathway reduces photorespiration by refixing photorespired CO2 released locally in the bundle sheath cell. Mesophyll mitochondria lack glycine decarboxylase activity. Mesophyll and bundle sheath cells contain chloroplasts with functional Calvin cycle. Abbreviations: cp: chloroplast; GDC: glycine decarboxylase; PCO: photosynthetic oxidative cycle; PCR: photosynthetic reductive cycle; mt: mitochondrion.

C3-C4 intermediate plants reduce photorespiration (and hence, CO2 compensation point) using a ‘photorespiratory pump’ based on modified localisation of the mitochondrial photorespiratory enzyme, glycine decarboxylase (Figure 2.10). In these plants, glycine decarboxylase activity is restricted to bundle sheath cells and excluded from mesophyll cells. Consequently, photorespired CO2 is released in the bundle sheath where it is largely refixed by Rubisco and the bundle sheath PCR before it diffuses back to the mesophyll. Such a system may weakly elevate CO2 in bundle sheath cells. Intermediate species that rely on the ‘photorespiratory pump’ are termed C3-like or Type I intermediates (e.g., Panicum milioides, Flaveria pubescens) and have intermediate CO2 compensation points and negligible C4 cycle activity.

In Type II and C4-like intermediates (e.g., Flaveria brownii), up to 70% of atmospheric CO2 may be first fixed into C4 acids. These plants have C4-like CO2 compensation points but are not classified as C4 plants because they lack the strict localisation of photosynthetic enzymes (e.g., Rubisco is present in mesophyll cells) and their bundle sheath cell walls have high CO2 permeability, resulting in only a partial CO2 concentrating mechanism (Brown 1980; Ku et al. 1991; Rawthorne 1992; Vogan and Sage 2011).

The physiological advantages of the intermediate photosynthetic pathway in all its naturally occurring forms remain unclear. It may be hypothesised that lowered photorespiration may lead to reduced CO2 limitation of photosynthesis, and thus allow C3-C4 plants to operate with lower stomatal conductance, thus conferring higher water use efficiency relative to C3 counterparts. Moreover, increased nitrogen cost associated with ‘building’ another set of photosynthetic cells (bundle sheath) may reduce nitrogen use efficiency if the gains in CO2 uptake are not substantial.

Work conducted with C3-C4 species yielded inconclusive evidence on the likely advantages of C3-C4 photosynthesis relative to the ancestral C3 mode. Generally, these studies demonstrated that, short of substantial C4 cycle activity and advanced cell-specific localisation of C3 and C4 cycle enzymes between the mesophyll and bundle sheath cells, C3-C4 photosynthesis does not improve photosynthetic efficiency (Bolton and Brown 1980; Pinto et al. 2011, Vogan and Sage 2011). Therefore, partial recycling of photorespired CO2 or a partial CO2 concentrating mechanism reduce photorespiratory loss normally associated with C3 photosynthesis, without leading to significant gains in plant fitness or productivity.

2.2.8 - Crassulacean acid metabolism (CAM)

Joseph Holtum1, Klaus Winter2 and Barry Osmond3

1Centre for Tropical Biodiversity and Climate Change, James Cook University, Australia; 2Smithsonian Tropical Research Institute, Balboa, Ancón, Republic of Panama; 3School of Biological Sciences, University of Wollongong, and Research School of Biology, Australian National University, Australia

Crassulacean acid metabolism (CAM) is a water-conserving mode of photosynthesis that, like C4 photosynthesis, is a modification of the C3 photosynthetic pathway fitted with a CO2 concentrating mechanism (CCM) that can increase the [CO2] around ribulose bisphosphate carboxylase/oxygenase (Rubisco) by more than 10-fold and suppress photorespiration. The overall energy demand of the CAM pathway is only about 10% more than that of C3 photosynthesis, as costs of the CCM machinery are partially offset by reducing photorespiration.

In C4 plants, as explained earlier in Section 2.2.2, this CCM is most commonly achieved by an “in-line turbocharger” based on initial CO2 fixation by phosphoenolpyruvate carboxylase (PEPC) into C4 acids in the cytoplasm of outer mesophyll cells. These acids diffuse rapidly to adjacent relatively CO2-tight bundle-sheath cells (Figure 2.31 right) where CO2 is released again. High [CO2] builds up in this spatially separated compartment where it is refixed by Rubisco.

2.0-Ch-Fig-2.31.png

Figure 2.31 Leaf transverse sections of CAM versus C3 and C4 plants. Left: succulent CAM plant Kalanchoë daigremontiana. Centre: C3Atriplex hastata. Right: C4Atriplex spongiosa. Scanning electron  micrographs at similar magnification. (K. daigremontiana  image courtesy R.A. Balsamo and E.G. Uribe; Atriplex spp. images courtesy J. H. Troughton)

In CAM plants enzyme systems analogous to those in C4 plants achieve the same result through a “battery-like” dark accumulation of CO2 into the 2nd carboxyl group of malic acid (acidification phase) in the vacuole of large mesophyll cells (Figure 2.31 left). Malic acid can accumulate to very high concentrations, attaining concentrations of greater than 1 mole acid per litre in mesophyll cells of tropical tree-CAM plants (Clusia spp.). Indeed one can sometimes taste the acid, with acid taste-testing for the presence of CAM being possibly first recorded in Aloe sp. by Nehemiah Grew in 1682 and in field reports from India by Benjamin Heyne in 1815.

In the light, malic acid returns to the cytoplasm where it is rapidly decarboxylated (deacidification phase). The CO2 released, which accumulates to high internal [CO2] as stomata close, is refixed by Rubisco in chloroplasts of the same mesophyll cell where it is further assimilated by the photosynthetic carbon reduction (PCR) cycle (Figure 2.32).  

2.0-Ch-Fig-2.32.png

Figure 2.32  Schematic of the principal components of CAM, highlighting storage of malic acid in the vacuole (V) and the carbohydrate conundrum discussed later. (Diagram courtesy B. Osmond)

Ultimately three of the four carbons recovered from the malic acid must be stored as starch and/or sugars in order to provide to PEPC the C3 substrate required for CO2 uptake during the following night. The fourth carbon, effectively that obtained from the atmosphere, is available for growth. Deacidification may generate high [CO2] behind closed stomata but photorespiration is not completely abolished (Lüttge 2002) since photosynthesis also generates high internal [O2]. While exploring Lake Valencia in Venezuela in 1800, Alexander von Humboldt measured elevated [O2] in bubbles streaming from the cut base of presumably CAM Clusia leaves standing in water in the light.

Of course by closing stomata in the light CAM plants minimize water loss when evaporative demand is highest (von Caemmerer and Griffiths 2009). The biomass production per unit water utilized in CAM was 6 times higher than for C3 plants and 2 times higher than for C4 plants when plants exhibiting all three photosynthetic pathways were grown together in a garden outdoors (Winter et al. 2005). The attribute of water-use efficiency undoubtedly contributes significantly to the success of CAM photosynthesis in nature, with CAM species outnumbering C4 species by about two to one. The paradoxes of CAM, a mode of photosynthesis that involves stomatal opening and CO2 uptake during the dark, continue to inform many aspects of plant biochemistry, physiology, ecology and evolution. This article draws heavily on two recent reviews (Borland et al. 2011; Winter et al. 2015).

2.2.8.1 - Biochemical attributes distinctive to CAM

Although CAM and C4 photosynthesis share common enzyme machineries, the physiological bases of spatially-separated and time-separated CCMs are very different and involve complex suites of distinctive regulatory processes ranging from allosteric modulation of enzyme activities, through cell and organelle membrane metabolite transport systems, to long-term responses to stress. The resulting metabolism is rarely at steady state. It is thus helpful to reference the principal biochemical interacting components of CAM to the CO2 exchange patterns and the pool sizes of acidity and carbohydrates in the archetypical Kalanchoë daigremontiana as outlined in Figure 2.33.

2.0-Ch-Fig-2.33.png

Figure 2.33 Schematic outline of the phases of CAM, showing net CO2 exchange and malic acid and carbohydrate (glucan) metabolism in Kalanchoë daigremontiana leaves. (Diagram courtesy B. Osmond)

The four phases of CAM metabolism are:

  • Phase I - acidification in the dark (PEPC active and stomata open)
  • Phase II - a transitional phase with  stomata open and both carboxylases active
  • Phase III - deacidification (PEPC inhibited, Rubisco active and stomata closed)
  • Phase IV - C3 photosynthesis (stomata open, Rubisco active and PEPC inhibited)

Within these four phases, the distinctive underlying biochemistry of CAM involves the up-regulation of cytoplasmic PEPC activity during phase I in the dark. Up-regulation is catalysed by PEPC kinase which phosphorylates PEPC making it less sensitive to inhibition by malic acid as it accumulates in the vacuole. Towards night’s end, CO2 fixation by PEPC declines as its carbohydrate substrates are exhausted (Figure 2.33). PEPC kinase is degraded during phase II and PEPC becomes increasingly sensitive to malic acid (declining Ki malate; Figure 2.34). It remains inhibited throughout phases III and IV.

CAM also involves the up-regulation of Rubisco in the light by ATP-dependent Rubisco activase as photosynthetic electron transport (ETR) increases in phase II and is maintained throughout phases III and IV (Figure 2.34).

2.0-Ch-Fig-2.34.png

Figure 2.34 Regulation of enzyme activities in deacidification phases of CAM as photosynthetic ETR increases in the light. (Diagram based on K. Maxwell et al. Plant Physiol 121: 849-856, 1999)

Partitioning of carbohydrate metabolism occurs in the light to retain chloroplast starch or vacuolar sugars as substrates for the next nocturnal acidification phase (phase I) while diverting sugars for phloem transport and growth. In pineapple, for example, degradation of starch in the chloroplast may provide the substrate for PEPC despite the large diel turnover of soluble sugars. The complexity of this “conflict of interest” (Borland and Dodd 2002) in carbohydrate metabolism varies between CAM plants with different deacidification pathways.

Sophisticated interactions occur between metabolite transporters in membrane systems of the vacuole, mitochondria and chloroplasts. Many of these are unique to CAM but of 48 such transporters required to support known variations of CAM (including Clusia spp. that also accumulate citric acid) up until 2005, only 8 had been demonstrated in at least one species (Holtum et al. 2005).

When studied under constant conditions, many of the above distinctive biochemical processes in CAM exhibit circadian rhythms. The extent to which endogenous oscillators orchestrate the clearly interacting biochemical, physiological and environmental controls seems likely to remain a challenging area of research.

2.2.8.2 - Physiological attributes distinctive to CAM

2.0-Ch-Fig-2.35.png

Figure 2.35 Diel expansion growth of Opuntia oricola cladodes during drought in the desert biome of the Biosphere 2 Laboratory in Oracle Arizona USA measured by time-lapse photography. Heterogeneity of growth rate throughout the day is colour coded as red = 2.0% to blue = 0.5% per hour (Diagram by B. Osmond based on Gouws et al. Funct Plant Biol 32: 421-428, 2005)

Compared to the photosynthetic biochemistry and physiology in leaves of C3 and C4 plants, the 6% of taxa estimated to exhibit CAM (in at least 35 families and >400 genera) express it with staggering variety (Winter et al. 2015). That is, the distinctive biochemical attributes of CAM outlined above, derived from a handful of research-compliant leafy model species, are but the tip of an iceberg of what really qualifies as a CAM plant (Borland et al. 2011).

The following summary of some distinctive physiological attributes of CAM underscores this conundrum:

Biochemical and physiological determinants of stable isotopic composition of plants with CAM. Fixation of CO2 by PEPC and Rubisco in vitro show clearly different discriminations against the heavier, naturally occurring, non-radioactive (stable) 13C isotope of carbon when expressed as a \(\delta\)13C value. Thus total carbon in C4 plants reflects a small discrimination against 13C resulting in \(\delta\)13C values of about –12.5 ‰, with more negative values in C3 plants (about –27 ‰). It is therefore not surprising that CAM plants tend to fall between these values depending on the balance between total carbon assimilated by PEPC in phase I and that added by Rubisco in phase IV. Partial closure of stomata adds a diffusional discrimination to the biochemical discrimination associated with Rubisco, so \(\delta\)13C values in C3 plants (and CAM plants) become less negative under water stress (Griffiths et al. 2007). Recently it has been suggested that unequivocal identification of CAM can be assigned on the basis of net nocturnal CO2 assimilation, acidification and \(\delta\)13C values less negative than -20 ‰. If some dark CO2 uptake and net acidification is detectable, but \(\delta\)13C is more negative than -20 ‰, these plants would be designated as C3-CAM species, indicating that CAM is present but the contribution of the CAM pathway to net 24h carbon gain is small in comparison to the contribution of daytime CO2 uptake (Winter et al. 2015).

  1. Stomatal opening in the dark is a fundamental physiological feature of CAM. Dark CO2 fixation lowers internal [CO2] and promotes stomatal opening. Stomata retain their responsiveness to external CO2 in phases I and IV, opening further when external CO2 is reduced. They do not respond to low external CO2 during phase III, when closure occurs in response to high internal [CO2] from deacidification of malic acid but do seem to sense the completion of deacidification itself.
  2. CAM is essentially a single cell phenomenon and succulence (low surface to volume ratio) is a feature of many but not all CAM plants. Succulence makes at least two important contributions to the physiology of CAM: large vacuoles for malic acid storage in mesophyll cells and tight packing of cells with small intercellular spaces. The latter means that CO2 diffusion internally is largely confined to wet cell walls and is thus 3 to 4 orders of magnitude slower than in the gas phase, potentially mitigating CO2 fixation by Rubisco in phase IV.  It remains to be seen whether Clusia rosea may have resolved this trade-off by anatomical/physiological differentiation. Enlarged, tightly-packed PEPC-enriched upper palisade cells have a potential for nocturnal CO2 fixation and acidification whereas lower spongy mesophyll cells exhibit predominantly C3 metabolism (Zambrano et al. 2014).  
  3. Whereas leaf expansion growth of C3 plants in the hot dry desert usually occurs at night, leaves and cladodes of some CAM plants grow in the light during phase III (Figure 2.35). This is not surprising because this phase coincides with reliable availability of CHO, maximum temperature and highest cytoplasmic acidity required for growth (Gouws et al. 2005). On the other hand Mesembryanthemum crystallinum (a facultative CAM plant) shows maximum growth in the dark.

2.2.8.3 - Ecological attributes distinctive to CAM

Appreciation of the remarkable plasticity in expression of CAM in response to development and environment has greatly advanced the understanding of the ecological attributes of this photosynthetic pathway. One attempt to bring order to the complexity of CAM expression was the designation of constitutive and facultative categories of CAM. Assignation of these terms requires close monitoring of CAM attributes throughout the life-cycle in response to stochastic environmental events such as water availability.

Constitutive CAM seems securely associated with many massive succulents such as the emblematic columnar cacti in the desert South Western USA but current research also shows it to be prevalent in tropical orchids and bromeliads. Young photosynthetic tissues of constitutive CAM plants are often C3 but CAM is always present at maturity, when the magnitude of the phases of CAM nevertheless remains responsive to stress, light and temperature.

Facultative CAM describes the reversible up-regulation of CAM in response to drought or salinity stress in plants that are otherwise C3 or display low-level CAM. In these, the up-regulated CAM activity is reversible, being reduced (or lost) on removal of stress (Winter et al. 2008; Winter and Holtum 2014). Facultative CAM has been demonstrated in annual plants of seasonally arid environments (e.g. Australia’s desert Calandrinia; Winter and Holtum 2011) as well as in tropical trees of the genus Clusia. The diel patterns of growth in facultative CAM Clusia minor shift from night when in C3 mode to phase III when in CAM mode (Walter et al. 2008).

Slow incremental increase in biomass through vegetative reproduction is a feature of CAM-dominated ecosystems. In CAM plants such as Agave and Opuntia, essentially all of the aboveground tissues are photosynthetic, and this partially compensates for lower rates of CO2 fixation on an area basis. With the noted exception of pineapple and Agave, few CAM species are domesticated, but others have been proposed as potential low-input biofuel crops on land not arable for C3 and C4 crops (Borland et al. 2011; Yang et al. 2015). There is no doubt that communities dominated by CAM plants can attain high biomass (Figure 2.36) and nowhere was this more obvious than during the invasion of 25 million hectares of central eastern Australia during 1846-1926 by prickly pear (Opuntia stricta).

2.0-Ch-Fig-2.36.png

Figure 2.36 High biomass of invasive Opuntia stricta (left) at the Chinchilla, Queensland site C27 before and after release of Cactoblastis cactorum larvae (photos courtesy Queensland Department of Lands 1980) and (right) heritage listed Cactoblastis memorial hall at nearby Boonarga, perhaps the only memorial building to commemorate the achievements of an insect. (Photograph courtesy B. Osmond)

After 2 decades of heroic chemical warfare (hand to hand stabbing or spraying with 10-15% arsenic pentoxide in sulphuric acid at close quarters) failed to restrain the “incubus”, an estimated 1.5 billion tonnes of prickly pear succumbed to trillions of larvae of the diminutive moth Cactoblastis cactorum in about 3 years. Eighty years later, this biological control system remains functionally intact thanks to the remarkably sensitive CO2 detectors in the mouth parts of the female moth that identifies the CAM plant as a target for oviposition by its distinctive nocturnal, inwardly directed CO2 flux in Australian ecosystems (Osmond et al. 2008). The hunger of emerging larvae does the rest. Nevertheless, around 27 species of opuntioid cacti remain naturalised across a range of soil types and climatic zones in the mainland states of Australia. It is not known why Cactoblastis cactorum does not attack a broad range of other feral opuntioid cacti.  In South Australia, with an estimated 1,000,000 ha affected (Chinnock 2015), a control management plan has been enacted (Harvey 2009).

Until the 1980s it was thought that the Australian native flora possessed few CAM plants and that prickly pear had occupied an “empty niche”. Field and laboratory studies by Klaus Winter using acid titration and \(\delta\)13C values demonstrated CAM in the desert succulent Sarcostemma australe as well as drought and salinity induced facultative CAM in Dysphyma clavellatum and Carpobrotus aequilaterus. He also found CAM in rainforest epiphytes and in a diminutive succulent Calandrinia polyandra from sandy and rocky desert habitats. The latter was recently shown to display one of the most overt transitions from C3 photosynthesis when well watered to classic CAM when drought stressed (Figure 2.37).  The impression persists that the warm, dry continent of Australia is either CAM-depauperate or ripe for CAM exploration. On the basis of the size of the Australian flora one might predict around 1,300 Australian CAM species, only about 80 have been documented.

2.0-Ch-Fig-2.37.jpg

Figure 2.37 Small is beautiful. Diminutive Calandrinia polyandra seems set to become the Arabidopsis analog for CAM research. The diel CO2 exchange patterns on the right were obtained from the same plant well watered for 33 days (top) and 46 days after water had been withheld (bottom). (Photograph courtesy K. Winter; data from K. Winter and J.A.M. Holtum, Funct Plant Biol 38: 576-582, 2011)

2.2.8.4 - Speculations on the origins of CAM

2.0-Ch-Fig-2.38-v2.jpg

Figure 2.38 A clump of Isoetes andicola symbolizes the extraordinary functional biodiversity of CAM. (Photograph courtesy J. E. Keeley)

From the above it will be clear that tracking the origins of CAM autotrophy in plants will involve no mean feat (“a laudable triumph of great difficulty”). From a holistic perspective, CAM tests the extremities of most aspects of the physiology and ecology of terrestrial plants, as testified in a comprehensive recent collection of reviews and research papers over-viewed by Sage (2014).  With all the emphasis on water-use efficiency in arid environments as a dominant selective pressure for CAM it is often overlooked (and perhaps ironic) that this pathway today is found in aquatic plants, including the fern-ally Isoetes. The origins of Isoetes, though not the present-day taxa themselves, are Triassic, some 100 x106 years before the commonly imagined emergence of CAM in terrestrial plants (Keeley 2014).

The selective pressure for nocturnal storage of CO2 in malic acid by CAM in terrestrial plants may well be closure of stomata to conserve water loss in a dry atmosphere in daylight. In aquatic plants the selective pressure may be the slow diffusion of CO2 in water and its depletion from solution by photosynthesis. In between we have Isoetes andicola from the high Andes of Peru, in which non-functional stoma-like epidermal structures seem literally stitched up (Figure 2.38).  

Clumps of I. andicola are embedded in mounds of peat, with the tips of leaf-like structures forming small rosettes (~5 cm diam.) on the surface. These contain chloroplast-containing cells surrounding large air spaces that evidently maintain gas-phase connections through their large “drinking straw-like” roots to high [CO2] in the peat (~ 4%). The green tips can’t fix CO2 from the air, but when 14CO2 is supplied to the peat it is fixed within leaves into malic acid in the dark and metabolized to photosynthetic products in the light. Understanding how the habit of I. andicola manages to “CAMpeat” in these high elevation ecosytems remains a challenge.          

Any comment on the ecological and evolutionary attributes of CAM must acknowledge the often remarkable features of sexual reproduction, especially in orchids so highly prized in horticultural and gardening contexts. It is also fair to observe that this popular zoocentric fascination pays little or no heed to the distinctive autotrophic metabolism that supports such ecological exotica. One must concede that nocturnal pollination of saguaro by bats is not very amenable to experiment, so plant ecophysiologists might be excused their preference to focus on the resilience of these organisms in the face of environmental stress. 

However, few would deny that the cameo performances of night-blooming cacti are an astonishingly beautiful reward for the nightshift efforts that have unraveled our current understanding of CAM (Figure 2.39).

2.0-Ch-Fig-2.39.png

Figure 2.39 A standing ovation for several centuries of CAM research? The spectacular night blooming cactus Epiphyllum oxypetalum. (Photograph courtesy B. Osmond)

The chapter is dedicated to the memory of Thomas Neales (1929-2010) who pioneered Australian research on CAM with Opuntia stricta in the Botany Department, University of Melbourne.

2.2.8.5 - References for CAM

Balsamo RA, Uribe EG (1988) Plasmalemma- and tonoplast-ATPase activity in mesophyll protoplasts, vacuoles and microsomes of the Crassulacean-acid-metabolism plant Kalanchoe daigremontiana. Planta 173: 190-196

Borland AM, Dodd AN (2002) Carbohydrate partitioning in crassulacean acid metabolism plants. Funct Plant Biol 29: 707-716

Borland AM, Zambrano VAB, Ceusters J et al. (2011) The photosynthetic plasticity of crassulacean acid metabolism: an evolutionary innovation for sustainable productivity in a changing world. New Phytol 191: 619-633

Chinnock RJ (2015) Feral opuntioid cacti in Australia. The State Herbarium of South Australia, Adelaide.

Gouws LM, Osmond CB, Schurr U et al. (2005) Distinctive diel growth cycles in leaves and cladodes of CAM plants: differences from C3 plants and putative interactions with substrate availability, turgor and cytoplasmic pH. Funct Plant Biol 32: 421-428

Griffiths H, Cousins AB, Badger MR et al. (2007) Discrimination in the dark: resolving the interplay between metabolic and physical constraints to phosphoenolpyruvate carboxylase during the crassulacean acid metabolism cycle. Plant Physiol 143: 1055-1067

Harvey A (2009) Draft state opuntioid cacti management plan. Government of South Australia, Adelaide.

Holtum JAM, Smith JAC, Neuhaus HE (2005) Intracellular transport and pathways of carbon flow in plants with crassulacean acid metabolism. Funct Plant Biol 32: 429-439

Keeley JE (2014) Aquatic CAM photosynthesis: a brief history of its discovery. Aquatic Bot 118: 38-44

Lüttge U (2002) CO2 concentrating: consequences in crassulacean acid metabolism. J Exp Bot 53: 2131-2142

Osmond CB, Neales T, Stange G (2008) Curiosity and context revisited: crassulacean acid metabolism in the Anthropocene. J Exp Bot 59: 1489-1502

Sage R (2014) Photosynthetic efficiency and carbon concentration in terrestrial plants: the C4 and CAM solutions. J Exp Bot 65: 3323-3325

von Caemmerer S, Griffiths H (2009) Stomatal responses to CO2 during a diel crassulacean acid metabolism cycle in Kalanchoe daigremontiana and Kalanchoe pinnata. Plant Cell Environ 32: 567-576

Walter A, Christ MM, Rascher U et al. (2008) Diel leaf growth cycles in Clusia spp. are related to changes between C3 photosynthesis and crassulacean acid metabolism during development and water stress. Plant Cell Environ 31: 484-491

Winter K, Holtum JAM (2011) Induction and reversal of crassulacean acid metabolism in Calandrinia polyandra: effects of soil moisture and nutrients. Funct Plant Biol 38: 576-582

Winter K, Holtum JAM (2014) Facultative crassulacean metabolism (CAM) plants: powerful tools for unravelling the functional elements of CAM photosynthesis. J Exp Bot 65: 3425-3441

Winter K, Aranda J, Holtum JAM (2005) Carbon isotope composition and water-use efficiency in plants with crassulacean acid metabolism. Funct Plant Biol 32: 381-388

Winter K, Garcia M, Holtum JAM (2008) On the nature of facultative and constitutive CAM: environmental and developmental control of CAM expression during early growth of Clusia, Kalanchoë and Opuntia. J Exp Bot 59: 1829-1840

Winter K, Holtum JAM, Smith JAC (2015) Crassulacean acid metabolism: a continuous or discrete trait? New Phytol 208:  73-78

Yang X, Cushman JC, Borland AM et al. (2015) A roadmap for research on crassulacean acid metabolism (CAM) to enhance sustainable food and bioenergy production in a hotter, drier world. New Phytol 207: 491-504

 Zambrano VAB, Lawson T, Olomos E et al. (2014) Leaf anatomical traits which accommodate the facultative engagement of crassulacean metabolism in tropical trees of the genus Clusia. J Exp Bot 65: 3513-3523

2.2.9 - Submerged aquatic macrophytes (SAM)

Vascular plants often inhabit regions subject to tidal submergence while others carry out their entire life cycle under water. Examples of common submerged aquatic macrophytes are pond weeds and seagrasses. Once again, an evolutionary selective pressure for these plants has been the availability of CO2. Low levels of dissolved CO2 are common in both inland and marine waters, particularly at more alkaline pH. In more productive inland lakes, CO2 content can vary enormously, requiring considerable flexibility in the actual mode of carbon acquisition. At high pH, HCO3 becomes the more abundant form of inorganic carbon, whereas dissolved CO2 will predominate at low pH (Section 18.2). Consequently, when SAM plants evolved from their C3 progenitors on land, there was some adaptive advantage in devices for CO2 accumulation because CO2 rather than HCO3 is substrate for Rubisco. The nature of this ‘CO2 pump’ and the energetics of carbon assimilation are not fully characterised in SAM plants but considerable CO2 concentrations do build up within leaves, enhancing assimilation and suppressing photorespiration.

In summary:

Regardless of photosynthetic mode, and despite catalytic limitations, Rubisco is ubiquitous and remains pivotal to carbon gain in our biosphere. As a corollary, carbon loss via photorespiration is an equally universal feature of C3 leaves, and the evolution of devices that overcome such losses have conferred significant adaptive advantages to C4, CAM and SAM plants.


2.10 References for photosynthesis

Bolton JK, Brown RH (1980) Photosynthesis of grass species differing in carbon dioxide fixation pathways. V. Response of Panicum maximum, Panicum milioides, and tall fescue (Festuca arundinacea) to nitrogen nutrition. Plant Physiol 66: 97-100

Brown DA (1980). Photosynthesis of grass species differing in carbon dioxide fixation pathways. IV. Analysis of reduced oxygen response in Panicum milioides and Panicum schenckii. Plant Physiol 65: 346-349

Christin PA, Samaritani E, Petitpierre B et al. (2009) Evolutionary insights on C4 photosynthetic subtypes in grasses from genomics and phylogenetics. Genom Biol Evol 1: 221–230

Edwards GE, Franceschi VR, Voznesenskaya EV (2004) Single-cell C4 photosynthesis versus the dual-cell (Kranz) paradigm. Annu Rev Plant Biol 55: 173–196

Ehleringer JR, Cerling TE, Helliker BR (1997) C4 photosynthesis, atmospheric CO2, and climate. Oecologia 112: 285-299

Ghannoum O, von Caemmerer S, Conroy JP (2002) The effect of drought on plant water use efficiency of nine NAD–ME and nine NADP–ME Australian C4 grasses. Funct Plant Biol 29: 1337-1348

Ghannoum O, Evans JR, Chow WS et al. (2005) Faster rubisco is the key to superior nitrogen-use efficiency in NADP-malic enzyme relative to NAD-malic enzyme C4 grasses. Plant Physiology 137: 638-650

Hatch MD (1987) C4 photosynthesis: a unique blend of modified biochemistry, anatomy and ultrastructure. Biochim Biophys Acta 895: 81–106

Hatch MD, Kagawa T, Craig S (1975) Subdivision of C4-pathway species based on differing C4 acid decarboxylating systems and ultrastructural features. Aust J Plant Physiol 2: 111-128.

Hattersley PW, Watson L, Osmond CB (1977) In situ immunofluorescent labelling of ribulose-1,5-bisphosphate carboxylase in leaves of C3 and C4 plants. Aust J Plant Physiol 4: 523-539

Hattersley PW (1992) In ‘Desertified Grasslands: their Biology and Management’ (ed. Chapman GP) pp 181-212. Academic Press: London

Ku MSB, Wu JR, Dai ZY et al. (1991) Photosynthetic and photorespiratory characteristics of Flaveria species. Plant Physiol 96: 518-528

Pinto H, Tissue DT, Ghannoum O (2011) Panicum milioides (C3-C4) does not have improved water or nitrogen economies relative to C3 and C4 congeners exposed to industrial-age climate change. J Exp Bot 62: 3223-3234

Portis AR Jr, Salvucci ME (2002). The discovery of Rubisco activase – yet another story of serendipity. Photosyn Res 73: 257–264

Portis AR Jr, Li C, Wang D, Salvucci ME (2008) Regulation of Rubisco activase and its interaction with Rubisco. J Exp Bot 59: 1597-1604

Rawsthorne S (1992) C3-C4 intermediate photosynthesis - Linking physiology to gene expression. Plant J 2: 267-274

Sage RF (2004). The evolution of C4 photosynthesis. New Phytol 161: 341-370

Sage RF, Christin PA, Edwards EJ (2011) The C4 plant lineages of planet Earth. J Exp Bot 62, 3155-3169

Spreitzer RJ, Salvucci ME (2002) Rubisco: structure, regulatory interactions, and possibilities for a better enzyme. Annu Rev Plant Biol 53: 449-475

Vogan PJ, Sage RF (2011) Water-use efficiency and nitrogen-use efficiency of C3-C4 intermediate species of Flaveria. Plant Cell Environ 34: 1415–1430.

von Caemmerer S, Furbank RT (2003) The C4 pathway: an efficient CO2 pump. Photosyn Res 77: 191–207

Voznesenskaya EV, Franceschi VR, Kiirats O et al. (2002) Proof of C4 photosynthesis without Kranz anatomy in Bienertia cycloptera. Plant J 31: 649–662

Voznesenskaya EV, Edwards GE, Kiirats O et al. (2003) Development of biochemical specialization and organelle partitioning in the single celled C4 system in leaves of Borszczowia aralocaspica. Amer J Bot 90: 1669-1680

2.3 - Photorespiration

Figp2.01a.png

Figure 2.1a (also shown in the first section of this chapter). Diagram of the chloroplast showing Rubisco’s carboxylation reaction of RuBP with CO2 to produce two 3-PGA molecules, and the oxygenation reaction to produce one 3-PGA and one P-glycolate molecule.

Rubisco is a bifunctional enzyme capable of reacting either CO2 or O2 to RuBP in the active sites. Although Rubisco’s affinity for CO2 is an order of magnitude higher than that for O2, the high O2 concentration (20%) relative to CO2 (0.004%) in the Earth’s atmosphere leads to a ratio of 3:1 of carboxylation:oxygenation in C3 plants exposed to air. The carboxylation reaction yields two molecules of 3-PGA while the oxygenation of RuBP yields one molecule of 3-PGA and one molecule of phosphoglycolate (P-glycolate), as shown in this figure.

The 3-carbon compound 3-PGA enters the Calvin cycle, but the 2-carbon compound 2-phosphoglycolate is a dead-end metabolite. Consequently, plants have evolved a series of metabolic reactions, termed photorespiration, aimed at salvaging some of the carbon stored in 2-phosphogylcolate and evolving the rest as CO2. This process of CO2 evolution is different from mitochondrial respiration which is described in Section 2.4. The historical evidence for photorespiration is presented below.

2.3.1 - History of photorespiration research

(a) Historical evidence for photorespiration

The first line of evidence for photorespiration came from the different compensation points of C3 and C4 plants. When air is recirculated over an illuminated leaf in a closed system, photosynthesis will reduce CO2 concentration to a low level where fixation of CO2 by photosynthesis is just offset by release from respiration. For many C3 plants this compensation point is around 50 µL L–1 but is markedly affected by oxygen, photon irradiance and leaf temperature (Tregunna et al. 1966; Zelitch 1966). In low concentrations (1–2% O2) the CO2 compensation point of C3 plants is near zero. Significantly, early researchers in this area had already noted that some tropical grass species appeared to have a compensation point at or close to zero CO2, even in normal air (20% O2). This was first reported for corn (Zea mays) (Meidner 1962) and raised a very perplexing question as to whether these species even respired in light. However, we now know that C4 photosynthesis is responsible for the low evolution of CO2 (Section 2.2) and that C4 plants have a CO2 concentrating mechanism that forestalls photorespiration, resulting in a CO2 compensation point close to zero.

Figp2.16-new-p.png

Figure 2.12. Photosynthesising leaves show a post-illumination burst of CO2 which varies in strength according to surrounding O2 concentration. This positive response to O2 was found at 105 µmol quanta m-2 s-1 and is functionally linked to O2 effects on the CO2 compensation point as measured under steady-state conditions. (Based on Krotkov 1963)

A second line of evidence for leaf respiration in light was provided by a transient increase in release of CO2 when leaves are transferred from light to dark. This ‘post-illumination CO2 burst’ was studied extensively during the early 1960s by Gleb Krotkov and colleagues at Queens University (Kingston, Ontario). The intensity of this burst increased with the photon irradiance during the preceding period of photosynthesis. Understandably, the Queens group regarded this post-illumination burst as a ‘remnant’ of respiratory processes in light, and coined the term ‘photorespiration’. A functional link with the CO2 compensation point was inferred, because the burst was abolished in low O2 (Figure 2.12). A competitive inhibition by O2 on CO2 assimilation was suspected and was subsequently proved to be particularly relevant in defining Rubisco’s properties. Nevertheless, for many years a biochemical explanation for interaction between these two gases remained elusive.

(b) Biochemistry

Significant progress came when Ludwig and Krotkov designed an open gas exchange system in which 14CO2 was used to separate the fixing (photosynthetic) and evolving (respiratory) fluxes of CO2 for an illuminated leaf (Ludwig and Canvin 1971). Results using this steady-rate labelling technique were particularly revealing and provided the first direct evidence that respiratory processes in light were qualitatively different from those in darkness. They were able to show that CO2 evolved during normal high rates of photosynthesis by an attached sunflower leaf was derived from currently fixed carbon. The specific activity of evolved CO2 (ratio of 14C to 12C) was essentially the same as that of the CO2 being fixed, indicating that photorespiratory substrates were closely related to the initial products of fixation. Ludwig and Krotkov concluded that 14CO2 supplied to a photosynthesising leaf was being re-evolved within 28–45 s! Furthermore the rate of CO2 evolution in light was as much as three times the rate in darkness, and while early fixed products of photosynthesis (intermediates of the PCR cycle) were respired in light, this was not the case in darkness.

The radiolabelling method of Ludwig and Krotkov had, for the first time, provided measurements of what could be regarded as a true estimate of light-driven respiration which was not complicated by transient effects (as the post-illumination burst had been), or by changes in CO2 concentration (as was the case for measurements in closed gas exchange systems or in CO2-free air) or by difficulties associated with detached organs. Ludwig and Canvin (1971) subsequently concluded that processes underlying photorespiration re-evolved 25% of the CO2 which was being fixed concurrently by photosynthesis. Such a rate of CO2 loss was not a trivial process so a biochemical basis for its operation had to be established, and particularly when photorespiration seemed to be quite different from known mechanisms of dark (mitochondrial) respiration.

The search for the substrates of ‘photorespiration’ occupied many laboratories worldwide for many years. Much work centred on synthesis and oxidation of the two-carbon acid glycolate because as early as 1920 Warburg had reported that CO2 fixation by illuminated Chlorella was inhibited by O2, and under these conditions the alga excreted massive amounts of glycolic acid (Warburg and Krippahl 1960). Numerous reports on the nature of the 14C-labelled products of photosynthesis showed that glycolate was a prominent early-labelled product. A very wide variety of research with algae and leaves of many higher plants established two significant features of glycolate synthesis: formation was enhanced in either low CO2 or high O2. Both of these features had been predicted from Ludwig’s physiological gas exchange work and eventually proved a key to understanding the biochemistry of photorespiration.

(c) Source of glycolate production

The photosynthetic carbon reduction (PCR) cycle for CO2 fixation (Section 2.1) involves an initial carboxylation of ribulose-1,5-bisphosphate (RuBP) to form 3-PGA, but makes no provision for glycolate synthesis. However, Wang and Waygood (1962) had described the ‘glycolate pathway’, namely a series of reactions in which glycolate is oxidised to glyoxylate and aminated, first to form glycine and subsequently the three-carbon amino acid serine. The intracellular location of this pathway in leaves was established in a series of elegant studies by Tolbert and his colleagues who also established that leaf microbodies (peroxisomes) were responsible for glycolate oxidation and the synthesis of glycine. Kisaki and Tolbert (1969) suggested that the yield of CO2 from the condensation of two molecules of glycine to form serine could account for the CO2 evolved in photorespiration. This idea was incorporated in later formulations of the pathway.

What remained elusive was the source of photosynthetically produced glycolate. Many studies had suggested that the sugar bisphosphates of the PCR cycle could yield a two-carbon fragment which, on the basis of short-term 14CO2 fixation, would have its two carbon atoms uniformly labelled (if the two carbons were to be derived directly from 3-PGA this would not be the case as PGA was asymmetrically labelled in the carboxyl group). The mechanism was likened to the release of the active ‘glycolaldehyde’ transferred in the thiamine pyrophosphate (TPP)-linked transketolase-catalysed reactions of the PCR cycle. In some cases significant glycolate synthesis from the sugar bisphosphate intermediates of the cycle were demonstrated in vitro; however, the rates were typically too low to constitute a viable mechanism for glycolate synthesis in vivo.

A more dynamic approach to carbon fixation was needed to resolve this impasse. In particular, the biochemical fate of early products would have to be traced, and using a development of the open gas exchange system at Queens, Atkins et al. (1971) supplied 14CO2 in pulse–chase experiments to sunflower leaf tissue under conditions in which photorespiration was operating at high rates (21% O2) or in which it was absent (1% O2). A series of kinetic experiments showed that synthesis of 14C-glycine and 14C-serine was inhibited in low O2 and that the 14C precursor for their synthesis was derived from sugar bisphosphates of the PCR cycle, especially RuBP. Indeed RuBP was the obvious source of glycine carbon atoms and the kinetics of glycine turnover closely matched those of RuBP. As these authors concluded, ‘we can no longer view this (glycolate) pathway as an adjunct to the Calvin cycle but must incorporate it completely into the carbon fixation scheme for photosynthesis’ (Atkins et al. 1971).

The question was finally and most elegantly resolved by Ogren and Bowes (1971) who demonstrated that the carboxylating enzyme of the PCR cycle, RuBP carboxylase, was both an oxygenase and a carboxylase! During normal photosynthesis in air, this enzyme thus catalysed formation of both P-glycolate (the precursor of glycolate) and 3-PGA from the oxygenation of RuBP as well as two molecules of PGA from carboxylation of RuBP. In effect, CO2 and O2 compete with each other for the same active sites for this oxygenation/carboxylation of RuBP, at last providing a biochemical mechanism which had confused and perplexed photosynthesis researchers since the 1920s. This primary carboxylating enzyme of the PCR cycle, which had hitherto rejoiced in a variety of names (carboxydismutase, fraction 1 protein, RuDP carboxylase and RuBP carboxylase), was renamed Rubisco (ribulose-1,5-bisphosphate carboxylase/oxygenase) to reflect its dual activity.

A scheme for the PCR cycle and photosynthetic carbon oxidation (PCO) pathways then represents the synthesis of almost 70 years of research effort, and integrates the metabolism of P-glycolate with the PCR cycle. This is shown in the following section. 


2.3.2 - Photorespiration needs three organelles

Figp2.10.png

Figure 2.13. The photorespiratory carbon oxidation (PCO) cycle involves movement of metabolites between chloroplasts, peroxisomes and mitochondria. (Original drawing courtesy lan Woodrow)

A scheme for photorespiration involving the photosynthetic carbon reduction (PCR) cycle and the photosynthetic carbon oxidation (PCO) pathways represents the synthesis of almost 70 years of research. It integrates the metabolism of P-glycolate with the PCR cycle. This scheme is shown in Figure 2.13.

Specialised reactions within three classes of organelles in leaf cells are required, namely chloroplasts, peroxisomes (originally called microbodies) and mitochondria. Their close proximity in leaf cells (Figure 2.14 below) plus specific membrane transporters facilitate the exchange of metabolites.

Within choroplasts, oxygenase activity by Rubisco results in formation of phosphoglycolate which then enters a PCO cycle, and is responsible for loss of some of the CO2 just fixed in photosynthesis.

Within peroxisomes, O2 is consumed in converting glycolate to glyoxylate, and aminated to form glycine.

Within mitochondria, CO2 is released during conversion of glycine to serine. Subsequently, serine is recovered by peroxisomes where it is further metabolised, re-entering the PCR cycle of chloroplasts as glycerate. About 75% of carbon skeletons channelled into photorespiration are eventually recovered as carbohydrate.

Transport of glycerate and glycolate across the inner membrane of chloroplasts may involve separate translocators as shown in Figure 2.13, or it may involve a single translocator that exchanges two glycolate molecules for one molecule of glycerate. Transport of metabolites across the peroxisomal membrane most likely occurs through unspecific channel proteins, similar to those in the outer membranes of mitochondria and chloroplasts. These outer membranes are not included in this diagram. Mitochondria take up two molecules of glycine and release one molecule of serine. A specific translocator most probably mediates the exchange of these amino acids.

Not only does the photosynthetic oxidation pathway consume O2 and release CO2 but ammonia is also produced by mitochondria during synthesis of serine from glycine (Figure 2.13). This ammonia would be extremely toxic if it were not metabolised by either cytosolic or chloroplastic glutamine synthetase. A very effective herbicide that blocks glutamine synthetase has been developed (phosphinothricin, also known as glufosinate or Basta), and when it is applied to (or expressed in) actively growing plants they are killed by their photorespiratory ammonia release.

Fig 2.11.jpg

Figure 2.14. A transmission electron micrograph showing close juxtaposition of chloroplast (C), mitochondrion (M) and peroxisome (P) in a mesophyll cell of an immature leaf of bean (Phaseolus vulgaris). This group of organelles is held within a granular cytoplasmic matrix adjacent to a cell wall (CW) and includes a partial view of a small vacuole (V). Scale bar = 1 µm (Electron micrograph courtesy Stuart Craig and Celia Miller)

In summary, participation of photorespiration in leaf gas exchange, and thus dry matter accumulation by plants, reflects kinetic properties of Rubisco, and in particular a relatively high affinity for CO2 (Km = 12 µM) compared with a much lower affinity for O2 (Km = 250 µM). That contrast in affinity is, however, somewhat offset by the relative abundance of the two gases at catalytic sites of the enzyme where the ratio of O2:CO2 partial pressures approaches 1000:1! Thus, CO2 assimilation always prevails over CO2 loss in photorespiration. 

2.3.3 - C<sub>4</sub> plants and unicellular algae avoid photorespiration

At around the same time as the nature of photorespiration was becoming clearer Hatch and Slack (1966) demonstrated that in tropical grasses (initially sugar cane) the first-formed products of photosynthetic CO2 fixation were the four-carbon acids oxalacetate, malate and aspartate, rather than the 3-PGA formed in the PCR cycle. Furthermore, the carboxylation reaction involved PEP carboxylase and carbon was subsequently transferred to PCR cycle intermediates. As noted earlier (Section 2.2) C4 plants show no apparent CO2 release in light. The explanation lies in their anatomy and multiple carboxylation reactions rather than in the absence of the pathway of photorespiration. Bundle sheath cells are equipped with a CO2-concentrating mechanism that favours carboxylation over oxygenation reactions due to increased partial pressure of CO2, while photorespiratory release of CO2 is further prevented through the activity of PEP carboxylase which refixes any respired CO2 formed from the oxygenase function of Rubisco.

Unicellular green algae also posed a problem for the simple extrapolation of early models for photorespiratory metabolism in C3 leaves. Although organisms such as Chlorella had been used to establish the PCR cycle, and indeed provided much early evidence for effects of O2 on photosynthesis and formation of glycolate in light, they also appeared to lack CO2 evolution in light (Lloyd et al. 1977). In this case the explanation lies in a CO2-concentrating mechanism which effectively increases the internal pool of inorganic carbon (CO2 and HCO3) thereby favouring the carboxylase function of Rubisco over its oxygenase function.

2.3.4 - Does photorespiration represent lost productivity?

Such a substantial loss of carbon concurrent with CO2 fixation raises the question of whether eliminating or minimising photorespiration in C3 plants could enhance their yield, and specifically that of major crop plants such as rice, wheat, grain legumes, oil seeds and trees, none of which are C4 species. Faced with an expanding world human population and an increasing demand for food and animal feed, enhanced agricultural productivity is a global necessity. In its most obvious form a scenario which alters or removes the oxygenase function of Rubisco could achieve such a goal. In an early review of the process of photorespiration in plants, Ogren (1984) noted that ‘the sequence of reactions constituting the photorespiratory pathway in C3 plants appears to be firmly established’ and he went on to suggest that, although reducing the loss of fixed carbon as CO2 in the process may be a valid goal to improve the yield of crop plants, it is not clear whether or not this can be achieved by specific changes to the kinetic and catalytic properties of Rubisco alone.

Photorespiration may be loosely considered as a wasteful process because previously fixed carbon is lost and energy is dissipated. Ideal destinations for photoassimilates include synthetic pathways leading to fixed biomass and respiratory pathways for re-release of fixed energy in a controlled sequence of reactions leading to ATP and NAD(P)H for use in other synthetic events.

However, situations do exist where energy dissipation via photorespiration can be beneficial. For example, photo-oxidative damage can be alleviated in shade-adapted plants that experience strong irradiance if photorespiratory processes are allowed to proceed. Depriving such plants of an external oxygen supply, and hence preventing photosynthetic carbon oxidation, will exacerbate chloroplast lesions due to strong irradiance. Photosynthetic variants which obviate photo-respiratory loss, and most notably C4 plants, integrate structure and function in a way that forestalls photo-oxidative damage and leads to their outstanding performance under warm conditions. Environmental factors that constitute selection pressure for such photosynthetic adaptation are reviewed by Sage et al (2012). 

2.3.5 - References for photorespiration

Atkins CA, Canvin DT, Foch H (1971) Intermediary metabolism of photosynthesis in relation to carbon dioxide evolution in sunflower. In MD Hatch, CB Osmond, RO Slatyer, eds, Photosynthesis and Photorespiration. John Wiley, New York, pp 497-505

Hatch MD, Slack CR (1966) Photosynthesis by sugarcane leaves. A new carboxylation reaction and the pathway of sugar formation. Biochem J 101: 103-111

Kisaki T, Tolbert NE (1969) Glycolate and glyoxylate metabolism by isolated peroxisomes and chloroplasts. Plant Physiol 44: 242-250

Lloyd ND, Canvin DT, Culver DA (1977) Photosynthesis and photorespiration in algae. Plant Physiol 70: 1637-1640

Ludwig LJ, Canvin DT (1971) The rate of photorespiration during photosynthesis and the relationship of the substrate of light respiration to the products of photosynthesis in sunflower leaves. Plant Physiol 48: 712-719

Meidner HA (1962) The minimum intercellular-space CO2 concentration of maize leaves and its influence on stomatal movements. J Exp Bot 13: 284-293

Ogren WL (1984) Photorespiration: pathways, regulation and modification. Annu Rev Plant Physiol 35: 415-442

Ogren WL, Bowes G (1971) Ribulose diphosphate carboxylase regulates soybean photosynthesis. Nature New Biol 230: 159-160

Sage RF, Sage TL, Kocacinar F (2012) Photorespiration and the evolution of C4 photosynthesis. Annu Rev Plant Biol 63: 19-47.

Tregunna EB, Krotkov G, Nelson CD (1966) Effect of oxygen on the rate of photorespiration in detached tobacco leaves. Physiol Plant 19: 723-733

Warburg O, Krippahl G (1960) Glykolsaurebildung in Chlorella. Z Naturforsch 15b: 197-199

Wang D, Waygood ER (1962) Carbon metabolism of 14CO2 labelled amino acids in wheat leaves. I. A pathway of glyoxylate-serine metabolism. Plant Physiol 37: 826-832

Zelitch I (1966) Increased rate of net photosynthetic carbon dioxide uptake caused by the inhibition of glycolate oxidase. Plant Physiol 41: 1623-1631

2.4 - Respiration and energy generation

Nicolas L. Taylor1,2 and A. Harvey Millar1
1ARC Centre of Excellence in Plant Energy Biology and 2School of Chemistry and Biochemisty, The University of Western Australia.

During photosynthesis the carbon assimilated is either retained in the chloroplast as starch or converted to sucrose and directed for export to sites of growth. Starch is degraded by a series of enzymes in the chloroplast, with sucrose degradation mainly occurring in the cytosol and both leading to glycolysis and the oxidative pentose pathway which produce respiratory substrates. These carbon rich compounds are prime sources of respiratory substrates in plants, although other carbohydrates such as fructans and sugar alcohols are also used.

During respiration, metabolites are oxidised and the electrons released are transferred through a series of electron carriers to O2. Water and CO2 are formed and energy is captured as ATP which is harnessed to drive a vast array of cellular reactions.

In comparison to sucrose and starch, the contribution of proteins and lipids as sources of respiratory substrates in most plant tissues is minor; exceptions to this generalisation are the storage tissues of seeds such as castor bean and soybean, in which amino acids and lipids may provide respiratory substrates, and during the processes of senescence in plant tissues where protein and lipid degradation increases.

2.4.1 - Starch and sucrose degradation

Starch is the principal storage carbohydrate in plants and this carbon reserve plays a number of important roles in plants. It is composed of two polymers of glucose, amylose and amylopectin and is stored in the plastid (chloroplast in leaves, amyloplasts in non-photosynthetic tissues) as insoluble, semi-crystalline granules. Starch is accumulated during rapid growth in the day and is almost completely degraded at night to mostly glucose and maltose, which is exported from the chloroplast and metabolised in the cytosol (Figure 2.19). Starch degradation is initiated by the addition of phosphate groups at the C6-position and C3-position of individual glucosyl residues that act to disrupt the packing of the glucans at the granule surface. These phosphate additions are catalysed by two enzymes, glucan water dikinase (GWD) and phosphoglucan water dikinase (PWD) respectively. The hydrolysis of the resulting glucan and phosphoglucan chains is carried out by a suite of enzymes including the phosphoglucan phosphatases (SEX4/LSF2), β-amylases (BAM1/BAM3), debranching enzymes (DBE; ISA3/LDA), α-amylase (AMY3), α-glucan phosphorylase and the disproportionating enzyme 1 (D-enzyme 1; an α-1,4-glucanotransferase).). The resulting maltose and glucose are exported to the cytosol by the glucose transporter (pGlcT) and maltose transporter (MEX1) and glucose-1-phosphate is thought to be exported by a similar but yet unknown mechanism. Once in the cytosol the maltose and glucose are converted to substrates for either sucrose synthesis, glycolysis or the oxidative pentose phosphate pathway by a number of enzymes including the disproportionating enzyme 2 (D-enzyme 2; an α-1,4-glucanotransferase), α-glucan phosphorylase, hexokinase and phosphoglucomutase.

Fig.2.19.png

Figure 2.19. Pathways of starch degradation. ATP, adenosine triphosphate; AMP, adenosine monophosphate; Pi, inorganic phosphate; GWN, glucan water dikinase; PWD, phosphoglucan water dikinase; SEX4/LSF2, phosphoglucan phosphatases; ISA3/LDA debranching enzymes (DBEs); BAM1/BAM3, β-amylases; D-Enyzme 1/2, disproportionating enzyme (α-1,4-glucanotransferase); pGlcT, glucose transporter; MEX1, maltose transporter, HK, hexokinase; PGM, phosphoglucomutase; Glu-1-P, Glucose-1-phosphate; Glu-6-P, Glucose-6-phosphate; OPP, Oxidative pentose phosphate pathway. (Original drawing courtesy Nicolas Taylor & Harvey Millar)

Sucrose is the world’s most abundant disaccharide, it is only produced by photosynthetic organisms and serves a role as a transportable carbohydrate and sometimes as a storage compound. The reactions in plant tissues leading to degradation of sucrose to hexose monophosphates are outlined in Figure 2.20.

Fig.2.20.png

Figure 2.20. The pathways of sucrose breakdown. SPP, sucrose phosphate phosphatase; S-6-P, sucrose-6-phosphate; SPS, sucrose phosphate synthase; UDP, uridine diphosphate; HK, hexokinase, ATP, adenosine triphosphate; ADP, adenosine diphosphate; Pi, inorganic phosphate; HPI, hexose phosphate isomerase; OPP, Oxidative pentose phosphate pathway. (Original drawing courtesy Nicolas Taylor & Harvey Millar)

The first step is cleavage of the glycosidic bond by either invertase (Equation 2.1) or sucrose synthase (Equation 2.2).

\[\text{Sucrose + H}_2\text{O} \rightarrow \text{D-Glucose + D-Fructose}\tag{2.1}\]

\[\text{Sucrose + UDP} \rightarrow \text{UDP-Glucose + D-Fructose}\tag{2.2}\]

Plant tissues contain distinct invertases located in the vacuole, cell wall (acid invertases) cytosol, mitochondria, nucleus, and cholorplast (neutral/alkaline invertases) which hydrolyse sucrose to glucose and fructose in an irreversible reaction. The invertases are differentially regulated by a number of mechanisms including pH to allow them to function in cell expansion, supply of carbon skeletons and energy metabolism. Multiple isoforms of sucrose synthase are located in the cytosol or cytosolic membranes that catalyse a thermodynamically reversible reaction, but this reaction probably acts only to breakdown sucrose in vivo. Their activity is developmentally regulated and they have functions in the supply of activated glucose for starch and cellulose biosynthesis. While both invertase and sucrose synthase can both breakdown sucrose, research using knockouts of multiple isoforms of both enzymes has shown that sucrose synthase is not required for normal growth in Arabidopsis, whereas invertase is indispensable. However this does not rule out the requirement of sucrose synthase in certain tissues of crop plant tubers, seeds and fruits where it has been shown to be crucial. Glucose and fructose are metabolised further by phosphorylation to the corresponding hexose-6-P by hexokinase. Hexokinase in plant tissues is associated with the outer surface of mitochondria.

2.4.2 - The glycolytic pathway

The glycolytic pathway involves the oxidation of the hexoses and hexose phosphates molecules produced from the breakdown of starch or sucrose to generate ATP, reductants and pyruvate (Figure 2.21).

Fig.2.21.png

Figure 2.21 The glycolytic pathway. OPP, Oxidative pentose phosphate pathway; PPi, pyrophosphate, Pi, inorganic phosphate; TPI, triose phosphate isomerase; NAD+, nicotinamide adenine dinucleotide (oxidised); NADH, nicotinamide adenine dinucleotide (reduced); NADP+, nicotinamide adenine dinucleotide phosphate (oxidised); NADPH; nicotinamide adenine dinucleotide phosphate (reduced); ATP, adenosine triphosphate; ADP, adenosine diphosphate;  MDH, malate dehydrogenase; PEPC, phosphoenolpyruvate carboxylase; PK, pyruvate kinase. (Original drawing courtesy Nicolas Taylor & Harvey Millar)

The process of glycolysis occurs within both the cytosol and plastid, with reactions in the different compartments catalysed by separate enzyme isoforms. The first step in the pathway is the phosphorylation of glucose by hexokinase to form glucose-6-phosphate in an ATP consuming reaction. This glucose-6-phosphate is converted to fructose-6-phosphate by glucose phosphate isomerase to form fructose-6-phosphate, which is also the entry point for fructose that can be phosphorylated by hexokinase also forming fructose-6-phosphate. The fructose-6-phosphate is then further phosphorylated to fructose-1,6-bisphosphate by one of two enzymes capable of catalysing this step: an ATP-dependent phosphofructokinase (PFK), which catalyses an irreversible reaction and occurs in the cytosol and plastids, and a pyrophosphate-dependent phosphofructokinase, (PPi-PFK), which occurs only in the cytosol and utilises pyrophosphate (PPi) as the phosphate donor in a reaction that is readily reversible.

Regulation of PFK and PPi-PFK is achieved by a combination of mechanisms, including pH, the concentration of substrates and effector metabolites and changes in subunit association. Phosphoenolpyruvate (PEP) is a potent inhibitor of both of PFK and PPi-PFK, inhibiting at µM concentrations and Pi can activate the cytoplasmic PFK, whereas the plastidic form is slightly inhibited by Pi. A number of other effectors of PFK have been identified including ADP, 3-phosphoglycerate and phosphoglycolate as well as it ability to accept ribonucleoside triphosphates other than ATP as the phosphate donor. PPi-PFK, has a catalytic potential higher than that of PFK and is strongly activated by Fructose-2,6-bisphosphate, but has no effect on PFK.

Fructose-1,6-bisphosphate is cleaved by fructose bisphosphate aldolase to form glyceraldehyde-3-phosphate and dihydroxyacetone phosphate, and these triose phosphates can be interconverted in a reaction catalysed by triose phosphate isomerase. Glyceraldehyde-3-phosphate is oxidised to 1,3-bisphosphoglycerate by a nicotinamide adenine dinucleotide (NAD+)-dependent glyceraldehyde 3-P dehydrogenase. Glyceraldehyde 3-P dehydrogenase is sensitive to inhibition by the reduced pyridine nucleotide cofactor (NADH), which must be reoxidised to maintain the flux through the glycolytic pathway. A phosphate group is then transferred from 1,3-bisphosphoglycerate to ADP forming ATP and 3-phosphogylcerate by phosphoglycerate kinase. In the cytosol a bypass is present that can convert glyceraldehyde-3-phosphate directly to 3-phosphoglycerate without phosphorylation by a non-phosphorylating NADP dependent glyceraldehyde 3-phosphate dehydrogenase. The resulting 3-phosphoglycerate is then converted to phosphenolpyruvate (PEP) by the action of phosphoglycerate mutase and then enolase.  

The end-products of glycolytic reactions in the cytosol are determined by the relative activities of the two enzymes that can utilise PEP as a substrate: pyruvate kinase, which forms pyruvate and a molecule of ATP, and PEP carboxylase, which forms oxaloacetate (Figure 2.21). Both of these reactions are essentially irreversible and there are fine controls that regulate the partitioning of PEP between these reactions. Pyruvate kinase is controlled post translationally by a partial C-terminal truncation which may yield altered regulatory properties and a phosphorylation and ubiquitin conjugation that targets the protein to the 26S proteasome for complete degradation, it is also inhibited by ATP. Whereas PEP carboxylase is inhibited by malate and thus its regulation is independent of cell energy status. The sensitivity of PEP carboxylase to malate is regulated by phosphorylation of a N-terminal serine of the enzyme, with the phosphorylated form less sensitive to malate inhibition. Oxaloacetate is then reduced by malate dehydrogenase to malate which, along with pyruvate, can be taken up into mitochondria and metabolised further in the TCA cycle (see below). The reduction of oxaloacetate in the cytosol could provide a cytosolic mechanism for oxidising NADH formed by glyceraldehyde 3-P dehydrogenase (Figure 2.21).

Another level of regulation of components of glycolysis is their physical location within the plant cell. Under conditions of high respiratory activity, a greater proportion of the cytosolic enzymes of glycolysis are present on the surface of mitochondria. In contrast when respiration is experimentally inhibited, a decrease in the association of glycolytic enzymes with the mitochondria is observed. It is likely that the glycolytic enzymes associate dynamically with mitochondria to support respiration and that this association restricts the use of glycolytic intermediates by competing metabolic pathways.

2.4.3 - The oxidative pentose phosphate pathway

An alternative route for the breakdown of glucose-6-phosphate is provided by the oxidative pentose phosphate pathway (OPP) (Figure 2.22). This pathway functions mainly to generate reductant (i.e. NADPH) for biosynthetic processes including the assimilation of inorganic nitrogen and fatty acid biosynthesis and to maintain redox potential to protect against oxidative stress. In addition, the reversible oxidative section of the pathway is the source of carbon skeletons for the synthesis of a number of compounds. For example ribose-5-phosphate provides the ribosyl moiety of nucleotides and is a precursor for the biosynthesis of purine skeletons and erythrose-4-phosphate, which is the precursor for the biosynthesis of aromatic amino acids by the shikimic acid pathway.


Fig.2.22.png

Figure 2.22. The oxidative pentose phosphate pathway. NADPH, nicotinamide adenine dinucleotide phosphate (reduced); R-5-p I, ribose-5-phosphate isomerase; R-5-p Epimerase, ribulose-5-phosphate epimerase. (Original drawing courtesy Nicolas Taylor & Harvey Millar)

The pathway begins with the dehydrogenation of glucose-6-phosphate catalyzed by glucose-6-phosphate dehydrogenase to produce 6-phosphoglucolactone and is the first step of the oxidative phase of the pathway. The 6-phosphoglucolactone is then hydrolysed to 6-phosphogluconate by 6-phosphogluconolactonase and then undergoes oxidative decarboxylation by 6-phosphogluconate dehydrogenase to produce ribulose-5-phosphate in the final step of the oxidative phase. Overall this phase of the pathway produces two molecules of NADPH from the conversion of glucose-6-phosphate to ribulose-5-phosphate. The non-oxidative phase begins with the reaction of ribulose-5-phosphate with either ribulose-5-phosphate isomerase or ribulose-5-phosphate epimerase followed by a series of reactions catalyzed by transaldolase and transketolase. These reactions result in the production of two molecules of fructose-6-phosphate and one glyceraldehyde 3-phosphate. The glyceraldehyde 3-phosphate and fructose-6-phosphate in the oxidative pentose phosphate pathway may be exchanged with enzymes of glycolysis.

As with glycolysis, reactions of the pentose phosphate pathway are catalysed by different isoforms of the enzymes that occur either in the cytosol or in plastids. Although transketolase and transaldolase may be absent from the cytosol of some species, the activity is maintained by phosphate translocator proteins on the plastid inner-envelope membrane that have the capacity to translocate sugar phosphates.

2.4.4 - Mitochondria and organic acid oxidation (the TCA cycle)

Organic acids such as pyruvate and malate produced in the cytosol by processes described above are further oxidised in mitochondria by the tricarboxylic acid (TCA) cycle and subsequent respiratory chain. Energy released by this oxidation is used to synthesise ATP which is then exported to the cytosol for use in biosynthesis and growth.

(a)  Mitochondrial structure

Fig.2.23.jpg

Figure 2.23. Transmission electron micrograph of a parenchyma cell in a floral nectary of broad bean (Vicia faba) showing an abundance of mitochondria, generally circular in profile and varying between about 0.75 and 1.5 µm in diameter. Each mitochondrion is encapsulated by an outer and inner membrane which is in turn infolded to form cristae. Scale bar = 0.5 µm. (Original electron micrograph courtesy Brian Gunning)

Plant mitochondria (Figure 2.23) are typically double-membrane organelles where the inner membrane is invaginated to form folds known as cristae to increase the surface area of the membrane. The outer membrane contains relatively few proteins (<100) and is permeable to most small compounds (< Mr=5 kDa) due to the presence of the pore-forming protein VDAC (voltage dependent anion channel) which is a member of the porin family of ion channels. The inner membrane is the main permeability barrier of the organelle and controls the movement of molecules by means of a series of carrier proteins many of which are members of mitochondrial substrate carrier family (MSCF). The inner membrane also houses the large complexes that carry out oxidative phosphorylation and encloses the soluble matrix which contains the enzymes of the TCA cycle and many other soluble proteins involved in a myriad of mitochondrial functions.

Mitochondria are semi-autonomous organelles with their own DNA and protein synthesis machinery. However, the mitochondrial genome encodes only a small portion of the proteins which make up the mitochondrion; the rest are encoded on nuclear genes and synthesised in the cytosol. These proteins are the transported into the mitochondrion by the protein import machinery and assembled with the mitochondrially synthesised subunits to form the large respiratory complexes. The number of mitochondria per cell varies with tissue type (from a few hundred in mature differentiated tissue to some thousands in specialised cells). Understandably, more active cells, with high energy demands, such as those in growing meristems are generally equipped with larger numbers of mitochondria per unit cell volume, and consequently show faster respiration rates.

(b)  Mitochondrial substrates

Two substrates are produced from glycolytic PEP for oxidation in mitochondria: malate and pyruvate (Figure 2.21). These compounds are thought to be the most abundant mitochondrial substrates in vivo. However, amino acids may also serve as substrates for mitochondrial respiration in some tissues, particularly in seeds rich in stored protein or under conditions of sugar depletion such as extended darkness, shading and senescence. β-oxidation of fatty acids typically does not occur in plant mitochondria, this oxidation is principally carried out in peroxisomes in plants.

(c) Carbon metabolism in mitochondria

Malate and pyruvate enter the mitochondrial matrix across the inner membrane via separate carriers. Malate is then oxidised by either malate dehydrogenase (a separate enzyme isoform from that in the cytosol), which yields oxaloacetate (OAA) and reduced nicotinamide adenine dinucleotide (NADH), or NAD+-linked malic enzyme, which yields pyruvate and NADH and releases CO2 (Figure 2.24). Cytosolic pyruvate carboxylase is an alternative means of providing substrate to mitochondria by combining pyruvate with HCO3 to yield OAA that can then be imported into mitochondria.

Fig.2.24.png

Figure 2.24. The tricarboxylic acid cycle. NAD+, nicotinamide adenine dinucleotide (oxidised); NADH, nicotinamide adenine dinucleotide (reduced); ATP, adenosine triphosphate; ADP, adenosine diphosphate; Pi, inorganic phosphate; GTP, guanosine triphosphate; GDP, guanosine diphosphate; Q, qunione; QH2, dihydroquinone. (Original drawing courtesy Nicolas Taylor & Harvey Millar)


Pyruvate formed either from malate and malic enzyme or transported directly from the cytosol is oxidised inside mitochondria by the pyruvate dehydrogenase complex (PDC) to form CO2, acetyl-CoA and NADH. This enzyme, which requires coenzyme A, thiamine pyrophosphate and lipoic acid as cofactors, effectively links the TCA cycle to glycolysis. PDC comprises three enzymes E1 (2-oxo acid dehydrogenase), E2 (acyltransferase) and E3 (lipoamide dehydrogenase). This complex is regulated by phosphorylation of the E1 subunit, lowering PDC activity in the day and increasing PDC activity at night. Pyruvate dehydrogenase is also subject to feedback inhibition from acetyl-CoA and NADH.

(d) Tricarboxylic acid (TCA) cycle

The TCA cycle begins with the condensation of acetyl-CoA and OAA, to form the six-carbon molecule citrate and the release coenzyme A (CoA) (Figure 2.24) in a reaction catalysed by citrate synthase. Aconitase catalyses the next step, converting citrate to isocitrate in a two-step reaction (dehydration/hydration) with cis-aconitate as an intermediate.

NAD-linked isocitrate dehydrogenase then oxidatively decarboxylates isocitrate to form CO2 and 2-oxoglutarate, and reduce NAD+ to NADH. The 2-oxoglutarate formed is also oxidatively decarboxylated to succinyl-CoA in a reaction catalysed by the enzyme 2-oxoglutarate dehydrogenase. This enzyme complex has similarities to pyruvate dehydrogenase and its reaction is analogous to the formation of acetyl-CoA from pyruvate by pyruvate dehydrogenase. The reaction mechanisms are also very similar, with 3 subunit enzymes, but 2-oxoglutarate dehydrogenase is not subject to the phosphorylation control that regulates pyruvate dehydrogenase. Succinyl-CoA synthase then catalyses the conversion of succinyl-CoA to succinate, with the concomitant phosphorylation of ADP to ATP, the only substrate-level phosphorylation step in the mitochondrion. This enzyme in plants differs from its mammalian counterpart in that it is specific for ADP rather than GDP.

Succinate dehydrogenase (SDH, Complex II), which catalyses the oxidation of succinate to fumarate, is the only membrane-bound enzyme of the TCA cycle and is part of the respiratory electron transfer chain (Figure 2.25). SDH is a large complex consisting of four core subunits, as well as number other associated subunits.

Fumarase catalyses the hydration of fumarate to malate followed by malate dehydrogenase that catalyses the final step of the TCA cycle, oxidising malate to OAA and producing NADH. The reaction is freely reversible, although the equilibrium constant strongly favours the reduction of OAA, necessitating rapid turnover of OAA and NADH to maintain this reaction in a forward direction.

Overall, during one turn of the cycle, three carbons of pyruvate are released as CO2, one molecule of ATP is formed directly, and four NADH and one FADH2 are produced. The strong reductants are oxidised in the respiratory chain to reduce O2 and produce ATP. Although most of the TCA cycle enzymes in plant mitochondria are NAD linked, NADP-dependent isoforms of isocitrate and malate dehydrogenases also exist, and these may play a role in a protective reductive cycle in the matrix.

Regulation of carbon flux through the TCA cycle probably occurs via phosphorylation/dephosphorylation of pyruvate dehydrogenase, which will depend in turn on mitochondrial energy status and feedback inhibition of various enzymes by NADH and acetyl-CoA. The rate of cycle turnover thus depends on the rate of electron flow through the respiratory chain (to reoxidise NADH) and the utilisation of ATP in the cell to provide ADP for substrate level and oxidative phoshorylation. TCA cycle turnover will also depend on the rate of substrate provision by reactions in chloroplasts and cytosol. A number of studies of TCA cycle mutants have demonstrated the wide impact these enzymes have not simply on TCA cycle function but as steps for the delivery of organic acids for other processes in plant cells such a photosynthetic performance, plant biomass, root growth, photorespiration, nitrogen assimilation, amino acid metabolism, and stomatal function.

2.4.5 - Electron transport chain

The respiratory electron transfer chain (ETC) of mitochondria consists of a series of large membrane-bound protein complexes (Complexes I, II, III, IV) which together with a small lipid ubiquinone (UQ) and the small protein cytochrome c catalyse the transfer of electrons from NADH and succinate to O2, forming H2O (Figure 2.25). Electron flow from NADH and succinate to oxygen is coupled to proton translocation out of the matrix to the intermembrane space which establishes a proton electrochemical gradient (DµH+) across the inner membrane that is used to drive phosphorylation of ADP to form ATP by the F1FO ATP synthase (Complex V, Figure 2.25).

Fig.2.25_edit_1.png

Figure 2.25. The electron transport chain of plant mitochondria. Numbers (I-V) identify the large respiratory complexes located on the inner mitochondrial membrane. Complex I, NADH:ubiquinone oxidoreductase; complex II, succinate dehydrogenase; complex III, ubiquinone-cytochrome c oxidoreductase; complex IV, cytochrome c oxidase; complex V, ATP synthase. Letters identify alternative pathway enzymes, eN, external NAD(P)H dehydrogenase; iN, internal NAD(P)H dehydrogenase; A, alternative oxidase and UQ, ubiquinone/ubiquinole pool; c, cytochrome c; U, uncoupling protein. NADH, nicotinamide adenine dinucleotide (reduced); NAD+ nicotinamide adenine dinucleotide (oxidised); ATP, adenosine triphosphate; ADP, adenosine diphosphate; Pi, inorganic phosphate.  Unbroken arrows indicate pathways of electron flow; broken arrows indicate proton translocation sites. (Original drawing courtesy Nicolas Taylor & Harvey Millar)

(a) Complex I (CI)


NADH-UQ oxidoreductase, is responsible for the oxidation of matrix NADH and reduction of ubiquinone (UQ) in the inner mitochondrial membrane (Figure 2.25). In plants it is a large multi-subunit complex composed of 49 subunits, up to ten of which are synthesised in the mitochondrion whilst the others are imported from the cytosol. One of the subunits, a 50 kDa protein, contains flavin mononucleotide as a cofactor and is the dehydrogenase which oxidises NADH and passes electrons to iron-sulphur containing subunits of the complex, and eventually to ubiquinone. The passage of electrons through the complex is accompanied by H+ translocation across the membrane. Complex I is inhibited specifically by the flavonoid rotenone and its analogues. The NADH-binding site is exposed to the matrix and the complex oxidises NADH produced by the TCA cycle and other NAD-linked enzymes (Figure 2.25). Studies of mutations of CI subunits have shown that plants can survive without CI due to the activity of alternative NAD(P)H dehydrogenases (see below). Such mutants have a variety of interesting phenotypes including viral infection tolerance, prolonged hydration under water-deficient conditions and altered organic and amino acid concentrations. Using a series of Arabidopsis CI subunit knockout mutants, a number membrane arm subcomplexes (of 200, 400, 450 and 650 kDa) have been identified using BN-PAGE and antibodies. It is proposed that at least some of these subcomplexes may be assembly intermediates during CI formation, and these are seen to accumulate when specific subunits are absent.

(b) Complex II (CII)

Succinate dehydrogenase, is an enzyme of both the respiratory ETC and the TCA cycle (see above) (Figure 2.25). It is composed of four core subunits: a flavoprotein (SDHI), an iron-sulphur subunit (SDH2) and two membrane anchor subunits (SDH3 and SDH4) in most organisms. In plants, the purification of the complex has revealed the common core subunits, but also additional proteins of unknown function that co-migrate with the complex. All SDH subunits are encoded in the nuclear genome in Arabidopsis. SDH contains FeS and flavin centres which participate in electron transfer from succinate to ubiquinone. Unlike complex I, complex II does not pump H+ and succinate oxidation is therefore linked to the synthesis of less ATP per O2 reduced (see below). Malonate, an analogue of succinate, is a strong competitive inhibitor of succinate dehydrogenase. Knockout mutants of the SDH1 gene have been shown to be embryo lethal, but knockdown of SDH1 and SDH2 leads a array of phenotypes including altered stomatal aperture, mitochondrial ROS production and nitrogen use efficiency. SDHAF1 and SDHAF2 assist in CII assembly in plants and knockdown of the SDHAF2 homolog lowers SDH assembly and reduces root growth.

(c) Complex III (CIII)

Ubiquinone-cytochrome c oxidoreductase or the cytochrome b/c1 complex as it is sometimes known, contains 10 subunits including a number of bifunctional core proteins. These proteins act both in CIII function and as a matrix processing peptidase, removing targeting presequences from imported matrix synthesized proteins (Figure 2.25). A single subunit of this complex, cytochrome b, is encoded by the plant mitochondrial genome, whilst the others are encoded by the nuclear genome. It contains two b-type cytochromes, b566 and b562, cytochrome c1, an iron-sulpher protein named the Rieske iron–sulphur protein and several other polypeptides. Electron flow from ubiquinol to cytochrome c is accompanied by the translocation H+ across the membrane, via the so-called Q cycle. Various inhibitors of complex III have been discovered, with antimycin A and myxothiazol most widely used in research. The assembly of CIII is modular and includes an early core subcomplex, a late core subcomplex and the final dimeric CIII. Approximately 13 assembly factors implicated in aiding one or more of the different stages of CIII assembly in yeast, however little is known about CIII assembly or functional assembly factors in plants.

(d) Complex IV (CIV)

Cytochrome c oxidase is the final step of electron transfer of the classical ETC. As the name implies, cytochrome c oxidase accepts electrons from cytochrome c and transfers them to O2 which is reduced to form H2O. Purification of CIV in plants has identified a complex containing 14 protein subunits (Figure 2.25). Eight of these proteins are homologous to known CIV subunits from other organisms, together with a further six proteins that are probably plant specific. Two cytochrome haem centres, a and a3, and two copper atoms make up its redox active components and like complex I, cytochrome oxidase is a proton pump. Cytochrome c oxidase is sensitive to a number of inhibitors, the best known of which are carbon monoxide and cyanide. Plants, however, show resistance to both carbon monoxide and cyanide because they are equipped with an alternative oxidase (see below). Studies of human and yeast CIV has shown an assembly pathway that involves the sequential incorporation of CIV subunits, initiated by subunit 1 and assisted by over 40 assembly factors. Research investigating the plant homolog of the yeast assembly factor COX19 has found it is capable of complementing the yeast cox19 null mutant. This suggests it might play a role in the biogenesis of plant cytochrome c oxidase or in the replacement of damaged forms of the enzyme. However, our knowledge of the assembly of CIV in plants is still incomplete.

(e) Ubiquinone and Cytochrome c

These large multi-subunit complexes (I, II, III, IV) of the respiratory ETC chain are embedded in the inner mitochondrial membrane by virtue of their hydrophobic subunits, and interact with one another via two smaller molecules: ubiquinone and cytochrome c. The lipid-soluble ubiquinone also known as coenzyme Q10 is a small mobile electron carrier which moves rapidly along and across the membrane, and participates in H+ transport across the membrane via the Q-cycle as well as shuttling electrons from complexes I and II to complex III. Cytochrome c is a small haem-containing protein located on the outer surface of the inner membrane, which shuttles electrons between complexes III and IV. In this respect, the respiratory chain is similar in layout to the photosynthetic electron transport chain: three large complexes which communicate by a quinone and a small mobile protein (Cyt c or plastocyanin). However, orientation of components in the membrane is inverted and the net reaction catalysed is opposite to that in chloroplasts (Figure 1.12).

2.4.6 - ATP synthesis (oxidative phosphorylation)

When electrons are transferred from NADH to O2, a large release of redox energy enables ATP formation in complex V of the respiratory chain (Figure 2.24). Energy release associated with electron transport is conserved by H+ translocation across the membrane to form a proton electrochemical gradient (ΔµH+) that has both an electrical membrane potential (Δψ) and a pH component (ΔµH+ = Δψ + ΔpH). This is known as the chemiosmotic theory and was originally proposed by Peter Mitchell in 1960s. In plant mitochondria, ΔµH+ exists mainly as a Δψ of ~150–200 mV, with a pH gradient (ΔpH) of ~0.2–0.5 units. ATP synthesis occurs as H+ move from a compartment of high potential (the intermembrane space) to one of low potential (the mitochondrial matrix) through the ATP synthase complex. Oxidation of NADH via the cytochrome pathway has three associated H+ translocation sites and is linked to synthesis of up to three ATP molecules for each molecule of NADH oxidized. By contrast, both succinate and alternative NADH oxidation by the rotenone-insensitive NADH dehydrogenases (see below) are linked to the synthesis of only two ATP molecules per NADH or succinate, as these events are associated with only two H+ pumping sites.

Fig.2.26.png

Figure 2.26. Stylised O2 electrode recording of respiring plant mitochondria illustrating respiratory control. Oxygen consumption is measured as a function of time. The isolated mitochondria are depleted of substrates and are therefore dependent on added substrates and effectors. Addition of ADP (Pi is in the reaction medium) allows oxidative phosphorylation to proceed, dissipating some of the electrochemical gradient (ΔµH+) and thereby stimulating electron transport; the enhanced rate of O2 uptake is called State 3. When all the ADP is phosphorylated, electron transport slows to what is known as State 4. Addition of more ADP stimulates O2 uptake further, but addition of oligomycin, which blocks the ATP synthase, lowers O2 uptake to the State 4 rate. The addition of an uncoupler (protonophore) fully dissipates the electrochemical gradient (ΔµH+) and stimulates O2 uptake; no ATP synthesis occurs in the presence of the uncoupler. When the O2 concentration falls to zero, respiration ceases (Original drawing courtesy David Day)


(a) Complex V (CV)

ATP synthase is a membrane-bound F1F0 type H+-ATP synthase that harnesses the ΔµH+ generated by the ETC to produce ATP. It is composed of a hydrophobic F0 component which channels protons through the inner mitochondrial membrane and also anchors the complex to the membrane and a hydrophilic F1 component which catalyses ATP formation and protrudes into the matrix. The core subunits of the enzyme are highly conserved in both prokaryotic and eukaryotic organisms. In plants, the majority of mitochondrial F1 subunits are encoded in the nucleus and translated in the cytosol before being imported into the mitochondria (including  α, β, γ and ε subunits), while most of the F0 subunits are encoded in the plant mitochondrial genome and translated in the mitochondrial matrix (including a, b, c and A6L subunits).  The reaction mechanism of the ATP synthase is known as the three-site alternating binding site mechanism. According to this model, F1 has three nucleotide-binding sites which can exist in three configurations: one with loosely bound nucleotides, one with tightly bound nucleotides and the third in a nucleotide-free state. H+ movement through F0 results in rotation of F1, causing a conformational change during which the site with loosely bound ADP and Pi is converted to one which binds them tightly in a hydrophobic pocket in which ATP synthesis occurs. Further H+ movement then causes another rotation of F1 and the ATP binding site is exposed and releases the nucleotide. In the meantime, the other nucleotide-binding sites are undergoing similar changes, with ADP and Pi being bound and converted to ATP. Thus H+ translocation drives the three sites through three different configurations and the main expenditure of energy is in the induction of a conformational change that releases tightly bound ATP, rather than in ATP synthesis itself. The F0 complex also contains a protein known as the oligomycin-sensitivity-conferring protein (OSCP) because it binds the antibiotic oligomycin that prevents H+ translocation through F0 and inhibits ATP synthesis. Therefore, adding oligomycin to mitochondria oxidising a substrate in the presence of ADP restricts O2 uptake. Generally knockouts of ATP synthase core subunits are lethal in plants, however inducible knockdowns have enabled investigations into the tissue-specific phenotypes incurred by slowing the rates of mitochondrial ADP:ATP cycling at a number of different developmental stages. It has been proposed that the assembly of plant CV comprises of three steps, the first being the formation of a rapidly turned over F1 subcomplex in the matrix, followed by an intermediate stage where F1 associates with the inner membrane and still turns over at a fast rate, and then finally a union of F1 with FO to form functional CV. A number of assembly factors (Atp10, Atp11, Atp12, Atp22, Atp23 and Fmc1) have been discovered for yeast ATP synthase, however, a detailed study of the presence and conservation of CV assembly factors in plants has not been undertaken.

(b) Respiratory control

Electron transport through the respiratory chain, and therefore rate of O2 uptake, is controlled by availability of ADP and Pi, a phenomenon described as ‘respiratory control’. In the absence of ADP or Pi, the proton pore of ATP synthase is blocked and a ΔµH+ builds up to a point where it restricts further H+ translocation across the inner membrane. Since electron transport is functionally linked to H+ translocation, this elevated ΔµH+ will also restrict O2 consumption. That outcome is easily seen with isolated mitochondria (Figure 2.26) where O2 uptake is stimulated by adding ADP (‘State 3’ respiration). When all of the added ADP has been consumed, O2 uptake decreases again (‘State 4’). In steady state, the rate of electron flow is determined by the rate of flow of H+ back across the membrane: when ADP and Pi are available the backflow is rapid and occurs via ATP synthase; in the absence of these compounds, backflow is by slow diffusion through the membrane.

The ratio of State 3 to State 4 (the respiratory control ratio) is thus an indication of coupling between ADP phosphorylation and electron transport. Larger values represent tighter coupling. The proton leak can be dramatically stimulated by some compounds which act as protonophores or proton channels; these compounds collapse the ΔµH+ and increase O2 uptake up to the State 3 rate (Figure 2.26). However, no ATP is formed and these compounds are called uncouplers because they uncouple the linked processes of electron transport and phosphorylation.

2.4.7 - Alternative electron transport pathways

Plant mitochondria have a respiratory chain which is more complicated than that of animals and contains alternative NADH dehydrogenases, alternative oxidases which catalyse cyanide-insensitive O2 consumption and uncoupling proteins that acts to dissipate the ΔµH+. The alternative NADH dehydrogenases and alternative oxidase do not translocate protons and therefore are not linked to ATP synthesis; they are often referred to as the non-phosphorylating bypasses of the plant respiratory chain. These pathways were initially identified in plant mitochondria as they are able to continue to respire in the presence of the CIV inhibitor, cyanide and the CI inhibitor, rotenone and by their ability to exhibit natively uncoupled respiration in the absence of an ADP source.

(a) Alternative oxidase

Cyanide-insensitive respiration is catalysed by the alternative oxidase (AOX). This alternative terminal oxidase is a diiron quinol oxidase that branches from the classical respiratory chain at UQ and reduces oxygen to water without an associated proton translocation. The oxidase exists in mitochondria as a dimer which can be inactivated by covalent linkage via disulphide bonds. The reduced enzyme is stimulated allosterically by pyruvate and some other 2-oxo acids (such as glyoxylate), which interact directly with the oxidase. The exact role of AOX continues to be debated but it appears to play an antioxidant role in plant mitochondria. Research has shown it is actively induced by oxidative stress and the different genes for the oxidase have been shown to be both development- and tissue-specific. Knockout of AOX leads to reactive oxygen species and anthocyanin accumulation in the leaves exposed to a combination of high light and drought stress. AOX can be inhibited by hydroxamic acids such as n-propylgallate (nPG) and salicyl hydroxamic acid (SHAM).

(b) Alternative NAD(P)H dehydrogenases

Alternative NAD(P)H dehydrogenases have been shown to be present on both sides of the inner mitochondrial membrane. These type II NAD(P)H dehydrogenases oxidise external or cytosolic and matrix NADH and NADPH and are insensitive to the classical CI inhibitor rotenone. As with AOX, these enzymes do not translocate protons and therefore are not linked to ATP synthesis. The Arabidopsis genome contains seven genes encoding NAD(P)H dehydrogenases, although it appears that some of these isoforms are present in multiple subcellular compartments in addition to mitochondria.

(c) Uncoupling proteins

Uncoupling proteins (UCPs) are members of the mitochondrial carrier family of proteins. They act to dissipate the ΔµH+ built up the ETC by transporting H+ back across the inner membrane uncoupling proton and electron transport. The reactive oxygen species superoxide activates UCPs and this suggests a possible mechanism for the engagement of this enzyme in vivo. Analysis of knockouts of UCP (AtUCP1) showed that its absence led to localized oxidative stress but did not impair the ability of the plant to withstand a wide range of abiotic stresses. However, knockout of UCP1 did limit the photorespiration rate of plants and led to a reduction in photosynthetic carbon assimilation. This suggests that the main role of UCP1 in leaves is to maintain the redox poise of the mitochondrial ETC to facilitate photosynthesis.

2.4.8 - Energetics of respiration

(a)  Efficiency

Respiration represents a substantial loss of carbon from a plant, and under adverse conditions can be as high as two-thirds of the carbon fixed daily in photosynthesis. Both the rate and the efficiency of respiration will therefore affect plant growth significantly. The overall process of respiration results in the release of a substantial amount of energy which may be harnessed for metabolic work. In theory, the energy released from the complete oxidation of one molecule of glucose to CO2 and H2O in respiratory reactions leads to the synthesis of 36 molecules of ATP. However, in plants, because there are alternative routes for respiration, this yield can be greatly reduced. Mechanisms for regulating respiration rates in whole plants remain unclear. Convention has it that the rate of respiration is matched to the energy demands of the cell through feed-back regulation of glycolysis and electron transport by cytosolic ATP/ADP. However, since plants have non-phosphorylating bypasses in their respiratory chain that are insensitive to ATP levels, and since PEP carboxylase and PFP might be involved in sucrose degradation, the situation in vivo is not so simple. For example, the rotenone-insensitive alternative NADH dehydrogenases requires high concentrations of NADH in the matrix before it can operate and seems to be active only when substrate is plentiful and electron flow through complex I is restricted by lack of ADP. Alternative oxidase activity also depends on carbon and ADP availability and its flux is very dependent on the degree of environmental stress of the plant. In other words, non-phosphorylating pathways act as carbon or reductant ‘overflows’ of the main respiratory pathway and will only be active in vivo when sugar levels are high and the glycolytic flux rapid, when the cytochrome chain is inhibited, or when the bypasses have been induced significantly during stress. In glycolysis, the interaction between environmental signals and key regulatory enzymes, as well as the role of PFP and its activator fructose-2,6-P2, will be important.

(b)  Allocation of respiratory energy to process physiology

One way of viewing respiratory cost for plant growth and survival is by subdividing measured respiration into two components associated with (1) growth and (2) maintenance. This distinction is somewhat arbitrary, and these categories of process physiology must not be regarded as discrete sets of biochemical events. Such energy-dependent processes are all interconnected because ATP represents a universal energy currency for both, while a common pool of substrates is drawn upon in sustaining production of that ATP. Nevertheless, cells do vary in their respiratory efficiency, while genotype × environment interactions are also evident in both generation and utilisation of products from oxidative metabolism. The benefit of a high respiration rate is that more ATP is produced, which provides vital energy for growth of new tissue and defence processes, such as antioxidant activation, metabolite transport or production of resistant protein isoforms. However, the cost of high respiration rates is that carbon is expended on respiration instead of being allocated to synthesis of new tissue, therefore limiting growth capacity. Variation in respiration rate has implications for growth and resource use efficiency in plants during drought, temperature and salinity responses of plants.

2.4.9 - Further Reading

Araujo WL, Nunes-Nesi A, Nikoloski Z, Sweetlove LJ, Fernie AR (2012) Metabolic control and regulation of the tricarboxylic acid cycle in photosynthetic and heterotrophic plant tissues. Plant Cell Environ 35: 1-21

Atkin OK, Macherel D (2009) The crucial role of plant mitochondria in orchestrating drought tolerance. Ann Bot 103: 581-597

Atkin OK, Tjoelker MG (2003) Thermal acclimation and the dynamic response of plant respiration to temperature. Trends Plant Sci 8: 343-351

Jacoby RP, Li L, Huang S, Pong Lee C, Millar AH, Taylor NL (2012) Mitochondrial composition, function and stress response in plants. Journal of Integrative Plant Biology 54: 887-906

Jacoby RP, Taylor NL, Millar AH (2011) The role of mitochondrial respiration in salinity tolerance. Trends Plant Sci 16: 614-623

Kruger NJ, von Schaewen A (2003) The oxidative pentose phosphate pathway: structure and organisation. Curr Opin Plant Biol 6: 236-246

Mannella CA (2008) Structural diversity of mitochondria functional implications. Mitochondria and Oxidative Stress in Neurodegenerative Disorders 1147: 171-179

Millar AH, Whelan J, Soole KL, Day DA (2011) Organization and regulation of mitochondrial respiration in plants. Annual Review of Plant Biology 62: 79-104

Moller IM (2001) Plant mitochondria and oxidative stress: electron transport, NADPH turnover, and metabolism of reactive oxygen species. Annu Rev Plant Physiol Plant Mol Biol 52: 561-591

Patrick JW, Botha FC, Birch RG (2013) Metabolic engineering of sugars and simple sugar derivatives in plants. Plant Biotechnol J 11: 142-156

Plaxton WC (1996) The organization and regulation of plant glycolysis. Annu Rev Plant Physiol Plant Mol Biol 47: 185-214

Stitt M (2013) Progress in understanding and engineering primary plant metabolism. Curr Opin Biotechnol 24: 229-238

Stitt M, Zeeman SC (2012) Starch turnover: pathways, regulation and role in growth. Curr Opin Plant Biol 15: 282-292

Streb S, Zeeman SC (2012) Starch metabolism in Arabidopsis. Arabidopsis Book 10: e0160

Sweetlove LJ, Beard KF, Nunes-Nesi A, Fernie AR, Ratcliffe RG (2010) Not just a circle: flux modes in the plant TCA cycle. Trends Plant Sci 15: 462-470

Sweetlove LJ, Fernie AR (2013) The spatial organization of metabolism within the plant cell. Annu Rev Plant Biol 64: 723-746

Taylor NL, Day DA, Millar AH (2004) Targets of stress-induced oxidative damage in plant mitochondria and their impact on cell carbon/nitrogen metabolism. Journal of Experimental Botany 55: 1-10

Tcherkez G, Mahe A, Hodges M (2011) (12)C/(13)C fractionations in plant primary metabolism. Trends Plant Sci 16: 499-506

Zeeman SC, Kossmann J, Smith AM (2010) Starch: its metabolism, evolution, and biotechnological modification in plants. Annu Rev Plant Biol 61: 209-234